A Study of Color Space Transformation Method
Using Nonuniform Segmentation of
Color Space Source
Jiabin Deng*
*Computer Engineering Department, Zhongshan Polytechnic, Zhongshan, China Email: [email protected]
Juanli Hu and Juebo Wu#
Computer Engineering Department, Zhongshan Polytechnic, Zhongshan, China
# Shenzhen Angelshine Co., LTD, Shenzhen, China
Email: [email protected] and [email protected]
Abstract—Color space transformation is the process of converting color from one space to the other type of color space, which plays a very important role in image acquisition, display and color information transfer. Though CMYK space is applied to express color when using printer or phototypesetter, editing correction in CMYK color space may cause color loss and lower the speed of computer operation. Thus, it is often converted into CIE L*a*b* uniform color space which is device-independent. In general, there existed a problem of that the dark tone has a big color difference in previous methods when doing color transformation. In order to handle such issue, we put forward a sampling method for color space with the non-uniform segmentation, which utilizes multiple regressions, prism interpolation and pyramid interpolation to model the color space for the same color inkjet. The technical difficulties of the three methods and their implementations are introduced in detail, together with the realizations from CMYK space to CIE L*a*b* space. The comparisons among such three methods are carried out by horizontal-vertical way. By analyzing the modelling results, it clearly shows that the proposed way for color space transformation can get better effect by using polynomial regression method and three-dimensional modelling method. The experiment results also indicate that the introduced approach is a kind of good converting way for color space with less color difference, better effect and much simpler, and it can be easily made widespread into other color space transformation.
Index Terms—color space transformation, multiple regression, prism interpolation, pyramid interpolation, color difference
I. INTRODUCTION
Color space transformation acts a vital role in image acquisition, display and color information transfer. A proper way of color space transformation can achieve lossless conversion among different color spaces [1]. Since different color space is often device-dependent, it is necessary to perform color space transformation for transferring image color between different equipments. Therefore, the matter of color restoration has become a
hotspot in related fields when the reappearance of color images on different equipments (medium) [1, 2].
Some color spaces are closely linked with special equipments (device-dependent). If such spaces are used to generate color, it not only depends upon the parameters, but also lies on the device characteristics. Whereas, the use of some other colors is the same to all space equipments (device-independent), namely the color produced by one group of parameters is identical in any device [3]. For example, the color space of color monitor, printer or scanner is related with some type of equipment. To realize the consistency of the color management, it must accomplish the color space transformation from device-dependent one to device-independent one.
The current algorithms of color space transformation are mainly divided into color-mixing models, multiple regressions, Look-Up-Table, Neural Networks and so on. All through the way, the ways of color space transformation between CMYK and Lab are always complicated, great losses, less precision and unsatisfactory.
In color-mixing models, the methods of Neugebauer equation, Yule-Nielsen and Clapper-Yule are suitable for halftone printer, while Beer-Bouguer and Kubelka-Munk that based on are applicable to full-color printer [4, 5]. The color-mixing models can predict color by the relatively less colors, but the error distribution in color space is nonuniform and the applicable scope is limited. And the problems of improved algorithms as Cellular Yule-Nielson or cellular Clapper-Yulel are that the precision will be dropped with the data increasing. As the mentioned above, the application of the color-mixing models are not very extensive.
win a high precision by applying it into color space transformation for printer because of a lot of constraints [9].
Three-dimensional querying method is a kind of method that creates lookup table through original color space segmentation, which mainly consists of three linear method, three rhombus difference methods, pyramid interpolation method, tetrahedral interpolation method, etc [10, 11, 12]. All sorts of geometry chiefly lies in the different methods of cutting cube. Three-dimensional querying method is applied in electronic image equipment with a large number of measurements, mostly using partition method based on uniform segmentation [3]. But this method often gives rise to precision inconsistence in the color domain.
Even though multiple regression method can realize color space transformation of color printer with less experimental samples, it often generates a low precision [13, 14]. The advantage of fuzzy logic and polynomial regression is that the process between source and objective space is reversible as long as exchanging the position between source space data and target space data. Sampling points is not required to obtain uniform data from source space, but the transformation accuracy of polynomial regression can vary greatly with the difference of distribution of sampling points in target space. After polynomial regression, it ought to carry out polynomial testing in order to ensure the polynomial should meet the precision demand in target space, which may induce a long time [15].
As narrated above, three-dimensional querying method and multiple regression method are the most commonly used and the selection of space sampling is very important in all three methods. In the former way, three-dimensional querying method makes use of uniform segmentation to extract samples in source color space. But, due to the nonuniformity of CMYK color itself, it may lead to the precision inconsistence in the whole color domain. In spite of polynomial rule using random sampling, the transformation accuracy of polynomial regression might cause a large distinction with the difference of distribution of sampling points in the target space. To address the issue that the color difference in dark color exists in previous color space transformation, we propose an improved approach by using nonuniform segmentation to take samples. We design five levels of color-target with nonuniform segmentation and create LUT table by using spectrophotometer to measure the value of L A B in different levels, which can reduce the influence of regional linearity for different sampling points. We adopt prism interpolation method, pyramid interpolation method and multiple regression method respectively to realize color space transformation and execute the test and result analysis by using 182 colorlump in S7, S8 standard color-target. Most of the color difference of colorlump is reasonable, along with the result that the average color differences are 2.1537 by pyramid, 2.3354 by prism and 3.476 by polynomial regression method. In comparison with the traditional
ways, practice has proved that the presented method has four advantages:
1) Easy to realize.
2) Simplifying the solving process. 3) High precision.
4) Easy to apply to other model.
II. THE BASIC PRINCIPLE OF COLOR MODELLING BY THREE-DIMENSIONAL QUERYING AND MULTIPLE
REGRESSION
A. CMYK Space
Computer color printing equipment can form different kinds of color by a variable of ink combination. If the light absorbed by ink is subtracted from white, the more the ink and absorbed light is, the darker the color will be, that is so called "subtraction model". Generally, the complementary of "RGB" is adopted to generate new color by the combinations among cyan (C), magenta (M), yellow (Y), and it is used for printing and other hardcopy output devices. In practical application, the fourth component black (K) is often applied to expand the scope of density and color gamut, in order to compensate the lack of the ink's purity and improve the ability of equipment reappearance. It is a simple way to produce color by CMY (K), however, it has some matter of that CMYK is a kind of device-dependent pattern and the printing effect immensely lies in the ink, sheet and many other factors. Therefore, it has to implement the transformation from CMYK to uniform color space with device-independence.
B. Selection of Uniform Color Space
Color space transformation is provided for solving the inconsistency of color coordinate system between different equipments. For this reason, it is necessary to choose a uniform color space as standard and also content the following three conditions:
1) Enough color gamuts.
It is to satisfy all needs of possible coordinate transformation, and there are no losses when converting from different equipment to the color space.
2) Device-independence.
It should meet the color consistency of the same group data at different equipments.
3) Uniformity.
It ought to fulfill two colors with the same distance in space have the same color, aiming at color measurement for easy.
benchmark color space in the mapping process of color transformation.
The color space of CIE L*a*b* can be regarded as basical uniformity although it is not completely well-distributed. CIE L*a*b* has been frequently put to use in the research of computer color equipment. So, in this paper, we pick out the uniform space of CIE L*a*b* as the conversion space.
C. Sampling Points in Source Color Space
In color space of CMYK, the color cube of one type can be used to represent all kinds of color obtained by ordinary printers, and a point in such space is corresponding with only one in CIE L*a*b*. The mapping relationship between two spaces above can be established through the color value of sample piece in CIE output by measurement from cube sampling. How to select the sampling points so as to make them more representative of the printer's color is the basic of mapping relation for color gamut, there are two criteria in the past work:
1) Sampling points can obtain the border of output color gamut from printer.
2) Sampling should be distributed uniformly throughout the output color gamut as far as possible, for the purpose making each sampling points representative.
The way of uniform division is put into use in color space partition. In color cube space, each coordinate is divided into n-1 interval in every dimension, where each interval is selected from the float number 0-1. The whole color space can be divided into( −1)3
n subspaces.
Although the method is easily implemented in the experiment, the output color does not obey to well-distributed linearity. Some areas with high linearity while others with low linearity, such division method may cause the inconsistent accuracy when mapping in the whole color gamut. In this model, according to the big color difference between dark and light in previous algorithms, we propose a method of adopting nonuniform segmentation for the color space of CMYK as following: Each color (CMYK) is divided into five levels, namely, 0, 30, 50, 80 and 100, totally 625 pieces. In addition, it could reduce the influence of regional linearity to sampling points.
D. Testing Iinstrument and Measuring Conditions
In the process of color image restoration and representation, cross-color is influenced by color
characteristics, observing conditions (such as lighting source, observation, background, etc.), and gamut scope. The equipments used for modelling in this paper are as follows:
• X-Rite 968 spectrophotometer. • Prince color ink Jet Media in size A4.
• EPSON STYLUSTM PHOTO 710 (color inkjet). • EPSON S020110 (color ink), EPSON S020093
(black ink).
• D50 light source, 2○ viewing field.
E. Procedure Summary
1) Design five levels of color target with nonuniform segmentation.
2) Measure the values of L, a, b using spectrophotometer in each level.
3) Establish LUT table.
4) Compute L, a, b value respectively by adopting prism, pyramid and multiple regression for each color piece.
5) Detect model with 182 color target in S7 S8 standard color.
6) Compare three kinds of results generated by the algorithms and draw a conclusion.
III. DIVISION AND CUBE GENERATION OF SOURCE CMYK SPACE
A. CMYK Space Division
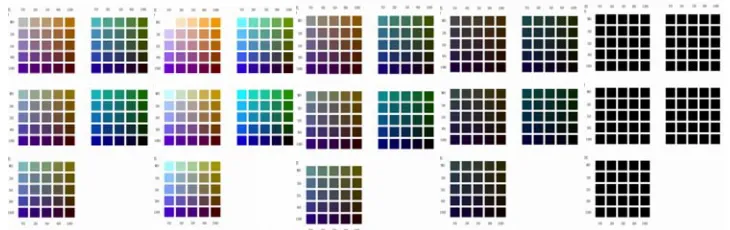
Printing abides by the subtractive color process when using CMYK, and the more the color number is, the darker the color will be. Due to the dark parts of the color, we take nonuniform segmentation method in 5 levels, shown in Fig. 1. We conduct an elabrate division for dark areas in order to reduce dark color difference and improve interpolation precision. The photoshop color lumps are generated and the value range of the input RGB is 0-255. By using the printer, we measure the L, a, b value for each color lump by spectrophotometer, and the results are written down together with each measurement. With the purpose of minishing the error caused by instability of the instrumentation, we extract the average of three points in every piece as the testing results in the whole process.
The four colors of CMYK adopt the following partitions:
C value: 0, 30, 50, 80, 100. M value: 0, 30, 50, 80, 100. Y value: 0, 30, 50, 80, 100. K value: 0, 30, 50, 80, 100.
When K takes the first level 0, use array to record C, M, Y from (0, 0, 0) to (100, 100, 100) with its corresponding 125 values of L, a, b.
Similarly, set K in 30, 50, 80, 100 respectively. For example: C=0, M=0, Y=30, K=30. Figure 1 shows data in 5 groups with 625 modelling data.
B. Identification of The Cube’s 8 Vertices
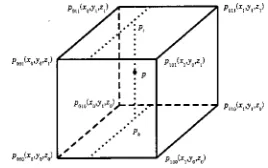
Step 1. Make sure the values in sub-cube, that is, Cmin, Cmax, Mmin, Mmax, Ymin, Ymax, Kmin. Then, combine the values with Cmin, Cmax, Mmin, Mmax, Ymin, Ymax, which contains 8 kinds of group, namely, the cube's 8 vertices. Set K as Kmin.
For instance: CMYK are respectively as 10, 30, 60 and 70.
Cmin = 0, Cmax = 30; Mmin = 0, Mmax = 30; Ymin = 50, Ymax = 80; Kmin = 50.
The coordinate of the unit cube's 8 vertices is shown in Fig. 2.
Figure 2. The coordinate of the unit cube's 8 vertices.
Step 2. Determine the cube label and its eight vertices in color space partition.
As nx, ny, nz denote the level number c, m, y for each vertex, the count n of cubes can be calculated by:
nz ny
nx
n =( −1)*16+( −1)*4− (1)
A three-dimensional array, data[n][x][y], is design in this algorithm, where n means the value in which cube, x implies which vertex it is and y stands for the vertex's value L, a or b. The limitation of such three parameters are: n
∈
[1, 64], x∈
[1, 8], y∈
[1, 3].IV. L,A,B COMPUTING
A. L,a,b Obtaining by Interpolation Method
After putting testing points into the proper cube, conduct Pyramid interpolation. In this process, the cube is divided into three parts, and to determine in which the points should be in prism, as shown in Fig. 3.
Step 1. Determine the position of the interpolation points in pyramid, which calculated by:
0 .
x x x= −
∆ ,∆y=y−y0,∆z= z− z0 (2)
z y z x y z y x x z x y ∆ > ∆ ∆ > ∆ ∆ > ∆ ∆ > ∆ ∆ > ∆ ∆ > ∆ , Test 3 Pyramid , Test 2 Pyramid , Test 1 Pyramid (3)
Step 2. The formulas of pyramid interpolation. Pyramid 1:
011 111
1
p
p
c
=
−
000 010
2 p p
c = −
000 001
3 p p
c = −
000 010 001 011
4 p p p p
c = − − +
)] )( /[( ) /( ) ( ) /( ) , , ( 0 1 0 1 4 0 1 3 0 1 2 0 1 1 000 z z y y z y c z z z c y y y c x x x c p z y x p − − ∆ ∆ + − ∆ + − ∆ + − ∆ +
= (4)
Pyramid 2:
000 100
1
p
p
c
=
−
101 111
2 p p
c = −
000 001
3
p
p
c
=
−
000 100 001 101
4
p
p
p
p
c
=
−
−
+
)] )( /[( ) /( ) ( ) /( ) , , ( 0 1 0 1 4 0 1 3 0 1 2 0 1 1 000 z z x x z x c z z z c y y y c x x x c p z y x p − − ∆ ∆ + − ∆ + − ∆ + − ∆ +
= (5)
Pyramid 3:
000 100
1 p p
c = −
101 111
2 p p
c = −
000 001
3 p p
c = −
000 100 001 101
4 p p p p
c = − − +
)] )( /[( ) /( ) ( ) /( ) , , ( 0 1 0 1 4 0 1 3 0 1 2 0 1 1 000 y y x x y x c z z z c y y y c x x x c p z y x p − − ∆ ∆ + − ∆ + − ∆ + − ∆ + = (6)
Step 3. Compute PC(XYZKmin) by pyramid interpolation with Kmin.
Step 4. Get PC(XYZKmax) with Kmax.
Step 5. Finally, make interpolationusing to K value once again by PC(X1) and PC(X2).
Figure 3. The three prisms.
k xyzk p xyzk p k k xyzk p Endl c c c ∆ − − + = / ) ( ) ( [ )] [( ) ( min max min
min max k k
k = −
∆ (8)
Similarly, value a and b can be obtained by such model.
B. Computing L ,a, b Using Prism Interpolation
The Prism is one of the 3d linear interpolation methods. At the beginning of Prism interpolation, those points location should be determined in color space, that is to say, in which cube it is. After that, divide this cube into two prisms and determine this point in which prism. Then, choose corresponding formulas for the interpolation calculating, as shown in Fig. 4.
Figure 4. The two prisms
According to the formula as follows:
1
_c x
m
x= −
∆ ,∆y=m_m−y1,∆z=m_y−z1 (9)
where m_c, m_m, m_y are the color of the testing point with Cyan, Magenta and Yellow, and x1, y1, z1 is the first vertex with the value of Cyan, Magenta and Yellow.
1) Determine the prism
If
∆
x
>
∆
y
, then we consider that the testing point is in the first prism, and the interpolation formula is:)] )( /[( ) ( )] )( /[( ) ( ) /( ) ( ) ( ) ( ) /( ) ( ) , , ( 0 1 0 1 100 110 101 111 0 1 0 1 000 100 001 101 0 1 000 001 0 1 100 110 0 1 000 100 000 z z y y z y p p p p z z x x z x p p p p z z z p p y y y p p x x x p p p z y x p − − ∆ ∆ + − − + − − ∆ ∆ + − − + − ∆ − + − ∆ − + − ∆ − + = (10)
If
∆
x
≤
∆
y
, then we think that the testing point is in the second prism, while the interpolation formula is:)] )( /[( ) ( )] )( /[( ) ( ) /( ) ( ) ( ) ( ) /( ) ( ) , , ( 0 1 0 1 000 010 001 011 0 1 0 1 010 110 011 111 0 1 000 001 0 1 000 010 0 1 010 110 000 z z y y z y p p p p z z x x z x p p p p z z z p p y y y p p x x x p p p z y x p − − ∆ ∆ + − − + − − ∆ ∆ + − − + − ∆ − + − ∆ − + − ∆ − + = (11)
2) Compute PC (XYZKmin) by the prism interpolation with Kmin.
3) Compute PC (XYZKmax) with Kmax.
4) At last, make interpolationusing to K value once again by PC(X1) and PC (X2).
k xyzk p xyzk p k k xyzk p Endl c c c ∆ − − + = / ) ( ) ( [ )] [( ) ( min max min
min (12)
min max k k
k= −
∆ (13)
By the same way, calculate the value a, b by such model.
C. L,a,b computing by multiple regression method 1) Basic principle:
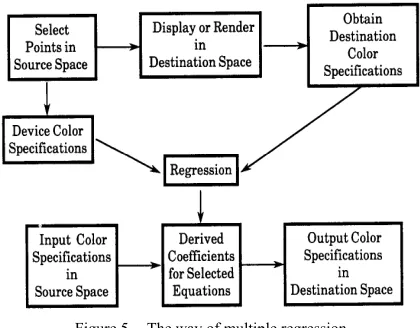
Through simultaneous equations with multiple variables, multiple regression method can build the relationship between the source color spaces, which extracts the appropriate sample point into target space. In terms of the established relationship, the coefficients can be computed, where using least square method. Once the coefficients are confirmed, any color of target space can be calculated by the choice of the polynomial.
The principle of color space transformation by multiple regression method is as shown in Fig. 5.
Figure 5. The way of multiple regression
2) Multivariate linear regression model of color printer.
The error precision of multiple regression model mainly depends on the following two points:
• The established relationship between source and target color space, namely, the polynomial model that we applied.
• The choice of the location and the number of the point is very important, especially the former. The number of points must be more than the one of polynomials in mathematical modeling.
We utilize the existing 625 sampling data for the choice of points in the source color space. The detail division has been described before; it has been fully considered the differences in the darkness and brightness.
V. COLOR DIFFERENCE COMPUTING
The geometric meaning of color difference formula is that it is an ellipsoid with coordinate of standard sample as the center in uniform color space, the semi-axial lengths of L, a, b in three directions are (
L
1−
L
2) , (a
1−
a
2) and (b
1−
b
2) respectively. As it stipulates the color within the ellipsoid satisfy the tolerance requirement, the outside of the ellipsoid will not meet the demand range of the tolerance. If the color difference is within 5, our naked eye can not distinguish that.We can figure out from the equations of color difference computing that:
2 / 1 2 2
2 )
( L a b
Eab = ∆ + ∆ + ∆
∆ (15)
difference Color
) (
) (
)
( 2 2 2
b Endb a
Enda l
EndL − + − + −
= (16)
Where l, a, b are the Lab input, while endl, enda, endb are the value L, a, b calculated by the three method above. The accuracy of this model can be measured by the statistics of the color differences of each color lump.
VI. EXPERIMENTAL DATA ANALYSIS
We test the models generated by the three kinds of color space transformation by using 182 pieces in standard color target.
A. The modeling by pyramid interpolation and data analysis
After finishing modeling, we carry out the detection on 182 pieces in S7, S8 color target with measuring the value L`, a, b and their color difference, also including the comparative analysis.
There are totally 182 pieces in S7, S8 and the average color difference is 2.1537. The number of a variety of color differences are as below: point (0-1):32, point (1-2):73, point (3-4):16, point (4-5):4, point (5-6):3, point (over 6):4.
We can see that except for some individual points, most color difference is within 4. The human eyes can not distinguish the distinct if the color difference is less than 5. So, the proposed method for modeling is successful.
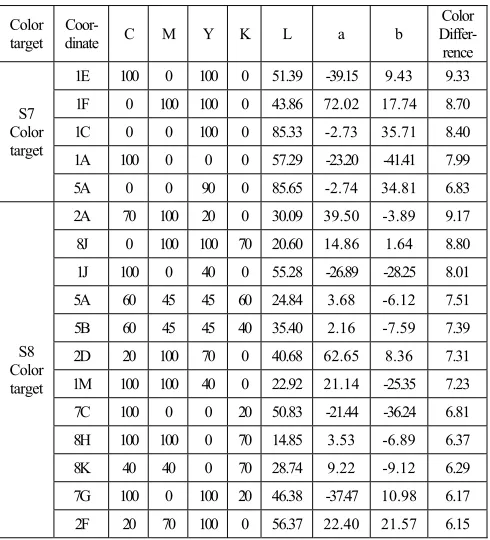
TABLE I.
PYRIAMD-4 PIECES WITH COLOR DIFFERENCE MORE THAN 6
No1 C M Y K L A B Eab
1 70 70 100 0 41.64 2.51 9.77 28.674
2 100 70 100 0 32.36 -16.03 0.31 13.484
3 100 40 40 0 44.11 -19.77 -25.78 9.473
4 100 100 70 0 22.20 15.83 -15.19 7.467
The reasons causing a greater aberration may be: • It can not avoid the matter of the big color
difference when doing a fine granularity division with nonuniform segmentation in the process of modelling, such as 1, 2, 4. (see Table I).
• Inaccuracy of the measurement instrument and the neglect of the tester may cause some error. We can see from Fig. 6 that except for some individual points, most of the color offset is on the small side.
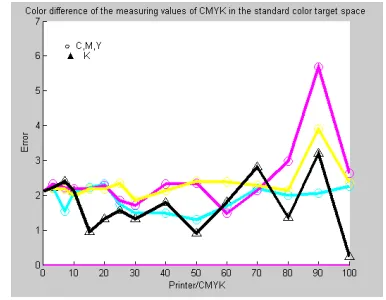
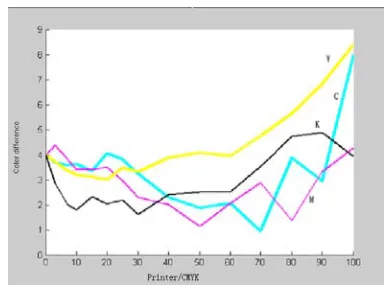
We can see from Fig.7 that the color differences of C, M, Y, K are small in middle parts and brightness, and large in dark sections.
Figure 6. The comparison between the tested data and standard color target in L*a*b* space on pyramid.
Figure 7. Color difference of the measuring values of CMYK in the standard color target space. Transverse axis: single-colored CMYK
(bright tone to dark tone) on pyramid.
B. The modeling results by prism interpolation
There are totally 182 pieces in S7, S8 and the average color difference is 2.3354. The number of a variety of color differences are as below: point (0-1):31, point (1-2):59, point (2-3):58, point (3-4):17, point (4-5):6, point (5-6):5, point (over 6):4(see Table II).
We can see that except for some individual points, most color difference is within 4. So, it proves that the proposed method for modeling is successful once again.
The mostly reason why gives rise to the big color difference for some parts is:
1) The emphasis when carrying out the model with nonuniform segmentation.
6 in Table II. In the meanwhile, although we have focused on dark area, it still can not avoid the problem of excessive color difference in essence, such as 1, 2 in Table II.
TABLE II.
PRISM-6 PIECES WITH COLOR DIFFERENCE MORE THAN 6
Num C M Y K L A B Eab
1 70 70 100 0 41.64 2.51 9.77 28.674
2 100 70 100 0 32.36 -16.03 0.31 13.484
3 40 40 0 0 63.63 9.53 -14.08 8.303
4 40 40 20 0 63.14 6.83 -4.36 8.143
5 100 40 40 0 44.11 -19.77 -25.78 6.248
6 20 20 0 0 76.64 5.01 -10.59 6.047
2) The cyan area is sensitive.
The reason is that the cyan area in CMYK horse-shape space is the least. Lab is the ideal color gamut of forming CIE, but it is not entirely uniform, especially near the blue color [16]. It must bring in some error when conversion, such as 2, 5 in Table II.
3) Inaccuracy of the measuring instrument.
The precision degree of measuring instrument for modelling will directly influence the results.
It can be seen from Fig. 8 that most of color offset is small except for some individuals. From Fig. 9, we know that all the color C, M, Y, K have small color difference in intermediate and bright parts, while big color difference in dark sections.
Figure 8. The comparison between the tested data and standard color target in L*a*b space
C. Multiple regression model and data analysis
There are 182 color lumps and their average color difference is 3.476. The number of a variety of color differences are as below: point (1-2):28, point (2-3):53, point (3-4):45, point (4-5):26, point (5-6):10, point (over 6):17 (see Table 3).
We carry out the testing for the model generated by multiple regression method with 182 pieces in S7 S8 standard color lump, and the average color difference is 3.476. It illustrates that the model can get better effects
for color space transformation from CMYK to the Lab, and with higher precision.
Figure 9. The prism algorithm-fold line distribution of monochrome color difference
TABLE III.
POLYNOMIAL REGRESSION ALGORITHM-COLOR PIECE DISTRIBUTION WITH THE COLOR DIFFERENCE BETWEEN 6 AND 17
Color
target Coor-dinate C M Y K L a b Color Differ-rence
S7 Color target
1E 100 0 100 0 51.39 -39.15 9.43 9.33 1F 0 100 100 0 43.86 72.02 17.74 8.70 1C 0 0 100 0 85.33 -2.73 35.71 8.40 1A 100 0 0 0 57.29 -23.20 -41.41 7.99 5A 0 0 90 0 85.65 -2.74 34.81 6.83
S8 Color target
2A 70 100 20 0 30.09 39.50 -3.89 9.17 8J 0 100 100 70 20.60 14.86 1.64 8.80 1J 100 0 40 0 55.28 -26.89 -28.25 8.01 5A 60 45 45 60 24.84 3.68 -6.12 7.51 5B 60 45 45 40 35.40 2.16 -7.59 7.39 2D 20 100 70 0 40.68 62.65 8.36 7.31 1M 100 100 40 0 22.92 21.14 -25.35 7.23 7C 100 0 0 20 50.83 -21.44 -36.24 6.81 8H 100 100 0 70 14.85 3.53 -6.89 6.37 8K 40 40 0 70 28.74 9.22 -9.12 6.29 7G 100 0 100 20 46.38 -37.47 10.98 6.17 2F 20 70 100 0 56.37 22.40 21.57 6.15
We can find out that the interval in which the most points distribute is from 2 to 4, and it is feasible and effective by using the proposed way for color space transformation.
It can be seen from Fig. 10 that the color offsets of a majority of color lumps are not so apparent, particularly value a, b near zero.
Figure 10. Polynomial regression algorithm-comparison of testing data and standard color target in the Lab space
Figure 11. Polynomial regression algorithm-fold line distribution of monochrome color difference
VII. CONCLUSION
In this paper, we adopted the mode of non-uniform division into source color space, and successfully completed modeling transformation from CMYK to lab space using pyramid interpolation, Prism interpolation and multiple regression method respectively. The modeling errors of all the three ways were on the small side by 182 color pieces in standard color target, and the majority of the color difference created by such methods is less than 4, where the average color differences are 2.1537 with pyramid interpolation, 2.3354 by prism interpolation and 3.476 for polynomial regression. Because of the limited conditions and a great number of data, it can not exclude that the precision degree of instrument may have effect on individual point when modeling. The law of the unity can be reflected by such three methods, as shown in figure 7, 9, 11. It is clearly seen that the color difference is the down cusp (namely, the local minimum) in the fold line chart when the test points locating in the cube's vertexes. In this way, we got the minimum error in interpolation. It is also found that the color difference is the largest when testing points between two vertices in color space cubes, that is, the top cusp in the fold line graph (local maximum). The regular
patterns aforementioned are defined as the fold line law with extreme value point. Another rule has also reflected in figure 7, 9 and 11: the effect of linear interpolation is the best in the middle of the hue while bright tone is less and dark area is the worst, especially in pyramid and prism methods. For example, the values of color differences between brightness and darkness are relatively big. The results explain that it is highly effective when using the proposed methods to do close division in the dark areas although there are some individual with a large error. Thereby, we should also take partition in bright region in order to reduce the color difference, if we carry out finer division.
By means of transverse comparison, it figures out that the pyramid and the prism belong to 3D-LUT, of which the testing results are very similar. Those points with the biggest differences by such two algorithms are identical, as shown in table I. The reason why the prism algorithm having a bigger average error is that the pyramid has a finer granularity than the prism when partitioning, as seen in figure 3, 4.
From longitudinal comparison, the average difference error by polynomial regression is not so good as 3D-LUT and the value is 3.476. Different from the prism and pyramid algorithm, there is no point with difference error overlarge of all 182 standard color targets, and the maximum number is less than 10. The fold line rules of extreme value points by polynomial regression are not obvious as well as the prism and the pyramid, as shown in Fig. 7, 9, 11. Because the model was created directly by using all 625 sampling data through polynomial regression, so it showed the above characteristics. The procedure left out the steps that dividing space into smaller sub-space as the prism and the pyramid, and it also overcomed the shortcomings of individual point with a high value.
In comparison with the previous studies, practice has proved that there are many advantages in our approach when taking color space transformation as listed below: it is easy to realize and suitable for various methods. The process of color space transformation is simple with high precision, and it is easily expanded to other color space segmentation and conversion.
The future work will focus on the aspects as follows: First, trying to integrate other segmentation methods into our approach in 3D-LUT, such as three linear method, prism interpolation method, pyramid interpolation method, together with tetrahedron interpolation. It also includes the homology relations in different division through cross-research. Second, doing vertical comparison by using different types, such as neural networks, fuzzy logic and genetic algorithms.
ACKNOWLEDGMENT
REFERENCES
[1] J. Morovic and M. R. Luo, Developing algorithms for universal colour gamut mapping. L. W. MacDonald and M. R. Luo (Eds), Colour Imaging: Vision and Technology [C], Chichester, England: John Wiley & Sons, 1999, pp.253-282.
[2] M. J. Vrhel, Color device calibration: a mathematical formulation, IEEE TRANSACTIONS ON IMAGE PROCESSING, VOL.8, NO.12, 1999, pp.1796-1805. [3] X. J. Xiu, X. H. Wang, W. H. Zhu, Method of Building
Printer Color Management Model, JOURNAL OF NINGBO UNIVERSITY (NSEE),Vol.17, No.2,2004. [4] A. C. Yule and W. J. Neilsen, The Penetration of Light
Into Paper and Its Effect on Halftone Reproduction, Proceedings of TAGA, 1951(4), pp.65-75
[5] P. KUBELKA, "New Contributions to the Optics of Intensely Light-Scattering Materials. Part II: Nonhomogeneous Layers," J. Opt. Soc. Am. 44, 1954, pp.330-334.
[6] Tominaga, Shoji, Color control using neural networks and its application [J], Proc. SPIE Vol. 2658, 1996, pp.253-260.
[7] M. Z. Guo, The study of color-matching algorithms based on BP neural network [J], Chinese Journal of Computers, 8(3), 2000.
[8] B. Li, G. Cheng, A probe into the application of color management with artificial neural network theory, Guangdong Print Issue(5), 2007.
[9] Q. M. Huang, D. Z. Zhao, Problems of artificial neural networks used for printer color space conversion, Optical Technology, 2003 (2).
[10] K. Knanmori, Fast color processor with programmable interpolation by small memory, J. Electronic Imagine 36, 1992, pp.73-78.
[11] J. M. Kasson, S. L. Nin, W. Plouffe and J. L. Haffner, Performing color space conversions with three-dimensional linear interpolation [J], Electronic Imaging, 1995, pp.226-250.
[12] R. Z. Shi, Translation the CIE Lab Color Space into the CMYK by Looking up Table Interpolation, Journal of Institute of Surveying and Mapping, Vol.19, No.3,2002. [13] M. H. Xia, Saber, E., Sharma, G., Murat Tekalp, A.,
End-to-end color printer calibration by total least squares regression, IEEE Transactions on Image Processing, vol.8, Issue 5, pp.700-716.
[14] Henry R. Kang, Color scanner calibration, Journal of imaging science and technology, 36(2), 1992, pp.162-170 [15] J. Y. Zhang, H. F. Lin, S. G. Yang, Multiple regression
laser display color system establishment, Optical Instruments, Vol. 30, (2), 2008.
[16] G. J. BRAUN, F. EBNER, M. D. FAIRCHILD, Color gamut mapping in a hue-linearized CIELAB color space [J], In: IS&T/SID 6th Color Imaging Conference, Scottsdale, 1998, pp.163–168.
Jiabin Deng is a Lecturer at the Computer
Engineering Department of Zhong Shan Polytechnic. He received a Bachelor Degree in Computer Engineering from Hubei University in 2005, then a Master Degree in Computer Engineering from Wuhan University in 2007.
His research interests include artificial intelligence, data mining, and complex network. His research papers are also indexed by IEEE CS, including "An improved classification algorithm on teaching evaluation", "An Improved Algorithm of Bi-cubic Triangular Curved Surface-splicing for Curved Surface Reconstruction Based on Hermite Surface", and "A New Probe Into The Colour Modelling Of Colour Output Devices Based On The Method Of Five-Level Non-Uniform Partition And Pyramid Interpolation"
Juanli Hu is currently lecturing at the Computer Engineering Department of Zhong Shan Polytechnic. She has been working as Director of Teaching (Fundamental Computing Research) since 2006. She received her Bachelor Degree in Computer Engineering from Xi'an University of Technology in 2000, followed by a Master Degree in Computer Engineering from Xi'an University of Technology in 2005. Her research interests include signal, information processing and data mining. Some of her research papers are indexed by IEEE CS.
Juebo Wu was born in China and has obtained B.A. and M.A
respectively in 2005 and 2007 from International School of Software, Wuhan University, China. At present, he is working for his PH.D. candidate of Mapping and Remote Sensing in State Key Laboratory of Information Engineering in Surveying(Wuhan University, China) and will graduate in the summer 2010.