*Corresponding author: [email protected] 2017 UTHM Publisher. All right reserved. penerbit.uthm.edu.my/ojs/index.php/jst
Complex Permittivity of Materials at Broadband Frequency using
Transmission Phase Shift Method
Yi Lin Chan
1, Fahmiruddin Esa
1*, Kok Yeow You
2, Rosmila Abdul Kahar
1and Zulkifly
Abbas
31Faculty of Applied Sciences and Technology, Universiti Tun Hussein Onn Malaysia, Pagoh Educational Hub,
84600 Pagoh Johor, Malaysia
2Faculty of Electrical Engineering, Universiti Teknologi Malaysia, 81310 Skudai Johor, Malaysia 3Faculty of Science, Universiti Putra Malaysia, 43400 Serdang Selangor, Malaysia
Received 30 September 2017; accepted 30 November 2017; available online 26 December 2017
1. Introduction
There are several methods to determine complex relative permittivity
r
r'
r''
of materials such as resonator, free space, rectangular waveguide and coaxial cavity. However, some of them have drawbacks in material characterization. Resonator offers accurate data but it is limited for narrow band. Free space is a non- destructive test however it yields a less accurate data due to substantial multiple noises. Rectangular waveguide requires a time consuming calibration in aperture and transmission line. Furthermore, different dimensions of therectangular waveguide are needed since each of the rectangular waveguide offers different cut-off frequency [1]. Thus, a Coaxial Cavity Test Fixture (CCTF) is introduced, which used transmission measurement principle. Basically, the determination of
ris based onmeasured scattering parameters (S-parameters) using vector network analyser (VNA). The S-parameters involved in the transmission measurement are reflection, S11
and transmission, S21coefficient.
On the other hand, calculation of
randr
for transmission measurement technique are commonly by Nicholson-Ross-WeirAbstract: This paper reports determination of complex relative permittivity
r
r'
r''
of non-magnetic samples
r 1
Teflon, Nylon and Epoxy via transmission phase shift method. The transmission phase shift method offers calibration independent and invariant position features. In this work, a Coaxial Cavity Test Fixture (CCTF) with dimension of 1.8 and 4.1 mm for inner and outer conductor, respectively was customized based on impedance matching theory to study broadband scattering in the range of frequency 1-18 GHz. Impedance matching and cable calibration were performed to reduce the measurement error of scattering parameters; reflection
S11 and transmission
S21 . Magnitude and phase of S11 and S21 were measured by vector network analyzer (VNA). The measured phase of S21(j
21) for all samples under test were linearized using the MATLAB “unwrap” command for further calculation of
r . The phase shift in S21 between with and without sample inside the cavity was detected and it was used to determine
rfor each material under test. Theaverage value of dielectric constants
r' for Teflon, Nylon and Epoxy were 2.11, 2.42 and 3.05, correspondingly for the selected frequency 2, 4, 6, 8, 10, 12 and 14 GHz. While, the average of dielectric losses
r'' for Teflon and Epoxy were almost overlapped which the values were 0.001 and 0.002, respectively that were higher than that of Nylon at 0.0006. The calculated values are comparable with the theoretical values with small absolute errors. These results suggested that this transmission phase shift method using CCTF was equally consistent when compared to the other techniques used for the determination of
r'and
r''.76 (NRW) conversion routine [2-6].
Nevertheless, the NRW routine needs phase shift of measured S11 and S21 to be on the calibration plane and consistent position of sample in the CCTF [7]. In this study, error due to the phase shift of measured S11 and
21
S affect the calculation of
r of sample can be eliminated by using transmission phase shift method.The used CCTF is made up of inner and outer diameter of 1.8 and 4.1 mm, respectively in order to get as close as possible to 50 line matching with coaxial cable. Therefore, error occurs due to mismatch impedance between CCTF and coaxial cable could be reduced. Dielectric material under test (MUT) Teflon, Nylon and Epoxy were prepared in toroidal shaped in order to fit into CCTF for S-parameters measurement. Complex relative permittivity of these non-magnetic samples
r 1
can be computed by difference in the phase shifts of measured S21 between air (withoutsample) and with sample
2. Theoretical analysis
Cut-off frequency of CCTF [1] can be expressed as below:
2
r r.
c
d
D
c
f
(1)where fcis cuf-off frequency of CCTF, D
and
d
are outer diameter and inner diameter of conductor,
r and
r are relativepermittivity and permeability of air. The designed CCTF with outer and inner diameter 4.1 mm and 1.8 mm, respectively can operate up to 32 GHz. However, our measurement using this CCTF is only up to 18 GHz since the used VNA can only operate up to 20 GHz.
Mismatch of airlines occurs due to the connection of different transmission lines. Uncertainty arises from the mismatch affect the measurement data of S-parameters (
S
11and
S
21). Characteristic impedance of airlines0
can be calculated [8]:
. ln 9585 . 59 0 d D Z r (2)
where D and
d
are outer diameter and inner diameter of conductor,
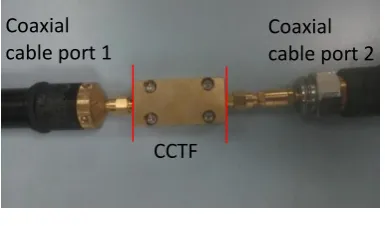
r is relative dielectric constant of air.A transverse electromagnetic (TEM) mode electromagnetic wave transmits through the CCTF as shown in Fig. 1. In this mode, electric and magnetic field are perpendicular to each other and to the propagation direction of the wave. Fig. 2 shows the measurement of S-parameters of
11
S and S21 of a homogenous and isotropic toroidal shaped sample material with thickness dsis partly placed in the CCTF.
When incident TEM wave touches the sample, part of the incident TEM wave is reflected and transmitted through sample as shown in Fig. 2.
S
11is the ratio of reflected TEM wave to the incident TEM wave whereasS
21is the ratio transmitted TEM wave to the incident TEM wave. Both of S11 and S21consist of magnitude ( S11 ,S21) andphase (
11,
21). The phase shift of air ( j
21A) and sample ( j
21S ) can be expressed explicitly as [9]:.
21 c S o S
A
d j d
j
(3).
21 c S S S S S
S
d j d d
j
(4).
2
2c
f
k
o o
(5)77 Meanwhile,
.
2 0 r r
S
k
(6)where
S is the propagation constant of electromagnetic wave in sample,
' ''
r r
r
and
r
r'
r''
are the complex relative permittivity and permeability of the sample respectively and symbol
S (nepers/meter) is the dielectric attenuation constant of the sample. The value of
Sis calculated by [9] 2 21 2 11 10 2 21 2 11 10 log log 15129254 . 1 A A S S S S S S S
(7)
where A
S11 , A
S21 , S
S11 and S
S21 are the measured linear magnitudes of S-parameter reflection and transmission coefficients of air and sample, respectively. The differences between the phase shift of air (1) and sample (2) can be expressed as:
A S
o S
SS
S
d
j
j
d
21
21
(8)Substitute Eq. 5 and Eq. 6 into Eq. 8, the complex relative permittivity
r andpermeability
r of the sample can beexpressed as Eq. 9: (where
ris assumed tobe 1 in this study).
2 21 21 2 1 S S A S S o o r r d j d j k k (9)3. Experimental setup
The CCTF dimension is 1.8, 4.1 and 40 mm in inner, outer conductor and thickness, respectively. Toroidal samples Teflon, Nylon and Epoxy were placed inside the CCTF which it served as a sample holder for S-parameter measurement of reflection and transmission coefficients. Linear magnitudes
11
S , S21 , and phase shifts
j
11,j
21of S-parameters of air and sample were measured using Agilent E5071C VNA which operated at frequency range of 1 – 18 GHz.4. Calibration of experimental setup
Calibration of experiment setup was performed for coaxial cable and CCTF in order to obtain accurate measurement S-parameter. The calibrations of coaxial cable
Fig. 1 Schematic diagram shows CCTF and TEM wave propagates inside the CCTF. Dashed lines represent magnetic field whereas solid lines represent electric field.
Fig. 2 Scattering parameters of reflection S11 ,
11and transmission S21,
21of CCTF with78 involve open, short and load (OSL) whereas
calibrations of CCTF involves thru-reflect-line (TRL). The TRL calibration was carried out within CCTF as shown in Fig. 3. The CCTF is invariant sample position to the calibration plane. Thus, the accuracy of the measured S-parameter was not affected by the thickness of sample,
d
shence it could be placed in any arbitrary position of CCTF.Fig. 3 S-parameters experimental setup where red lines are the OSL calibration planes.
5. Results and discussion
A TEM wave transmits through CCTF that filled with toroidal shaped samples for measurement of linear magnitudes
S
11 ,S
21and phase shifts
j
11,j
21 in the operating frequency range of 1 – 18 GHz. The variation of phase shift,
21 between air and samples caused phase ambiguity regions as shown in Fig. 4 (a). These uncalibrated ambiguity regions of phase shift air,j
21Aand samples,j
21s reduced the accuracy of extracted values of complex relative permittivity
r
r'
r''
using Eq. 9. The phase ambiguity could be eliminated by using MATLAB ‘unwrap’ command as shown in Fig. 4 (b) [10]. Fig. 4 (c) shows measurement result forS
11 of air and samples. The error in measurement ofS
11 is able to be minimized for value ofS
11 of air that is smaller than 0.2 [11]. However, the error could not be minimized for value of11
S
of air that is larger than 0.2, this was probably due to the imperfection of designed CCTF. The TEM wave becomes moresensitive especially at higher frequency due to shorter wavelength and this could be overcome by high precision and very well machined CCTF.
(a)
(b)
(c) CCTF
Coaxial cable port 2 Coaxial
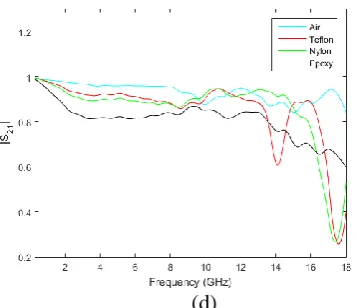
79 (d)
Fig. 4 (a) Phase shift (
j
21) of air and non-magnetic sample, (b) Ambiguity region of21
j
eliminated by phase unwrapping method, linear magnitude of air and non-magnetic samples (c)S
11 , (d)S
21.Complex relative permittivity of non-magnetic
r
1
sample Teflon, Nylon andEpoxy was calculated by using Eq. 8. The calculated
r' and
r'' of the three samples are shown in Fig. 5 (a) and (b).The ideal expectation of the S-parameters measurement should be in satisfactory up to 18 GHz even though the CCTF has been designed with 32 GHz cut off frequency. However due to several reasons as mentioned above, the calculated dielectric constant and dielectric loss seemed to be only acceptable for frequency that was below than 14 GHz. This is probably due to signal distortion at higher frequency transmission wave in CCTF [12].
Table 1, 2 and 3 show comparison between calculated values of
r' and
r'' for Teflon, Nylon and Epoxy samples and the one obtained from literatures [6,13-15]. It can be seen that the real part of permittivity is almost the same as the value calculated from other methods in literatures at several selected frequencies. These values have also been compared with manufacturer specification datasheet. However, the imaginary part of permittivity values are clearly deviated for all tested standard samples. This indicates that the measurementaccuracy of the imaginary part for low loss materials is usually high using S-parameter-based methods as reported in literature [16].
(a)
(b)
80 Table 1
r' and
r''of Teflon.Frequency (GHz)
'
r
''r
Theory [6,13] This work Theory [6,13] This work
2
2.1
2.2
0.0002
0.0012
4 2.0 0.0008
6 2.1 0.0008
8 2.0 0.0006
10 1.9 0.0004
12 2.2 0.0005
14 2.4 0.0028
Table 2
r'and
r''of Nylon.Frequency (GHz)
'
r
''r
Theory [13,14] This work Theory [13,14] This work
2
2.5
2.7
0.03
0.12
4 2.4 0.07
6 2.4 0.06
8 2.3 0.04
10 2.4 0.05
12 2.3 0.03
14 2.5 0.05
Table 3
r'and
r''of Epoxy.Frequency (GHz)
'
r
''r
Theory [13,15] This work Theory [13,15] This work
2
3.1
3.5
0.01
0.34
4 3 0.19
6 2.9 0.19
8 2.9 0.18
10 3 0.22
12 3.1 0.15
14 3 0.17
Absolute error for
r' and
r''of Teflon, Nylon and Epoxy can be defined as:Absolute error = |Average calculated value –Theoretical
value|
(10)
Table 4 Absolute error for
r' of Teflon, Nylon and Epoxy.Sample Average value of
'
r
Absolute error
Teflon 2.11 0.01
Nylon 2.42 0.08
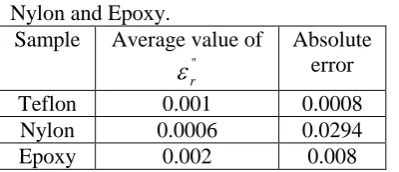
81 Table 5 Absolute error for
r'' of Teflon,Nylon and Epoxy.
Sample Average value of
''
r
Absolute errorTeflon 0.001 0.0008
Nylon 0.0006 0.0294
Epoxy 0.002 0.008
6. Conclusion
In this work, complex relative permittivity has been determined by using transmission phase shift method for non-magnetic samples. The proposed method has invariant position and calibration independent features where samples can be placed in any arbitrary within the CCTF and no sample calibration needed within the CCTF. The customized CCTF shows a good agreement with the dielectric constant value obtained from literatures. This finding will be very useful in designing a well functioned test fixture in determination of complex relative permittivity of samples by utilizing S-parameters measured from VNA.
References
[1] The world’s microwave information resources since 2001. Available: https://www.microwaves101.com/ [2] Nicolson, A. M., & Ross, G. F. (1970).
Measurement of the intrinsic properties of materials by time-domain techniques. IEEE Transactions on Instrumentation and measurement, 19(4), 377-382. [3] Weir, W. B. (1974). Automatic
measurement of complex dielectric constant and permeability at microwave frequencies. Proceedings of the IEEE, 62(1), 33-36.
[4] Hasar, U. C., & Simsek, O. (2009). A calibraton-independent microwave method for position-insensitive and nonsngular dielectric measurements of solid materials. Journal of Physics D:Applied Physics, 42(7), 075403. [5] Caijun, Z., Quanxing, J., & Shenhui, J.
(2011). Calibration-Independent and Position Insensitive Transmission/ Reflection Method for Permittivity Measurement with One Sample in Coaxial Line. IEEE Transactions on
Electromagnetic Compatibility, 53(3), 684-689.
[6] Chalapat, K., Sarvala, K., Li, J., & Paraoanu, G. S. (2009). Wideband Reference-Plane Invariant Method for Measuring Electromagnetic Parameters of Materials. IEEE Transactions on Microwave Theory and Techniques, 57(9),2257-2267.
[7] You, K. Y. (2016). Effects of Sample Thickness for Dielectric Measurements Using Transmission Phase-Shift Method. International Journal of
Advances in Mircowave
Technology,1(3),64-67.
[8] Weinschel, B. O. (1964). Air-Filled Coaxial Lines as Absolute Impedance Standards. Microwave J., 47-50.
[9] You, K. Y., Lee, Y. S., Zahid, L., Malek, M. F. A., Lee, K. Y., & Cheng, E. M. (2015). Dielectric Measurements for Low-Loss Materials Using Transmission Phase Shift Method. Jurnal Teknologi, 77(10), 69-77.
[10]MathWorks. 2013. Documentation Center [Documentation Search]. Available:http://www.mathworks.com/h elp/matlab /ref/unwrap.html.
[11] Randa, J. (2009). Uncertainty Analysis for Noise-Parameter Measurements at
NIST. IEEE Transactions on
Instrumentation and
Measurement, 58(4), 1146-1151.
[12] You, K. Y. (2016). RF Coaxial Slot Radiators: Modeling, Measurements, and Applications. Artech House.
[13] ECCOSTOCK. (R) Low Loss
Dielectrics & Other Common Materials. Dielectric Materials Chart. Available: http://www.eccosorb.eu/sites/default/file s/files/dielectric- chart.pdf.
[14] Elmajid, H., Terhzaz, J., Ammor, H., Chaïbi, M., & Mediavilla Sánchez, Á. (2015). A New Method to Determine the Complex permittivity and Complex Permeability of Dielectric Materials at X-Band Frequencies.
82 [16] Wan, C., Nauwelaers, B., De Raedt, W.,