R E S E A R C H A R T I C L E
Open Access
Exploring the key genes and pathways of
side population cells in human
osteosarcoma using gene expression array
analysis
Yi-Ming Ren
†, Yuan-Hui Duan
†, Yun-Bo Sun
†, Tao Yang, Wen-Jun Zhao, Dong-Liang Zhang, Zheng-Wei Tian
and Meng-Qiang Tian
*Abstract
Background:Human osteosarcoma (OS) is one of the most common primary bone sarcoma, because of early metastasis and few treatment strategies. It has been reported that the tumorigenicity and self-renewal capacity of side population (SP) cells play roles in human OS via regulating of target genes. This study aims to complement the differentially expressed genes (DEGs) that regulated between the SP cells and the non-SP cells from primary human OS and identify their functions and molecular pathways associated with OS.
Methods:The gene expression profile GSE63390 was downloaded, and bioinformatics analysis was made.
Results:One hundred forty-one DEGs totally were identified. Among them, 72 DEGs (51.06%) were overexpressed, and the remaining 69 DEGs (48.94%) were underexpressed. Gene ontology (GO) and pathway enrichment analysis of target genes were performed. We furthermore identified some relevant core genes using gene–gene interaction network analysis such as EIF4E, FAU, HSPD1, IL-6, and KISS1, which may have a relationship with the development process of OS. We also discovered that EIF4E/mTOR signaling pathway could be a potential research target for therapy and tumorigenesis of OS.
Conclusion:This analysis provides a comprehensive understanding of the roles of DEGs coming from SP cells in the development of OS. However, these predictions need further experimental validation in future studies.
Keywords:Osteosarcoma, Side population cells, Differentially expressed genes, Bioinformatics analysis
Background
Osteosarcoma (OS), which is produced by mesenchymal cells, is the most common primary malignant tumor originating from bone tissues. OS occurs mainly in children and adolescents and accounts for 8.9% of cancer-related diseases which lead to death [1, 2]. Al-though new therapies of neoadjuvant chemotherapy and surgery have contributed greatly to OS treatment, the 5-year survival rate of OS is difficult to exceed 60–65% [3, 4]. To sum up, the early diagnosis and effective
treatment of OS are the breakthrough point of OS research and clinical application, and exploring the pathogenesis, development, and metastasis of OS is the key. Although a large number of studies have been made on OS at molecular and cellular levels, the mechanisms of OS formation and metastasis have not been fully elucidated.
Side population (SP) cells are a group of special cells, which were found when Hoechst and flow cytometry are used to separate hematopoietic stem cells and progenitor cells. SP cells are widely distributed in a variety of adult tissues, embryos, and some tumor cell lines [5]. They not only have self-renewal and multipotential differenti-ation potential, but also have unique phenotypic markers and biological characteristics of stem cells, whose
* Correspondence:[email protected]
†Yi-Ming Ren, Yuan-Hui Duan and Yun-Bo Sun contributed equally to this
work.
Department of Joint and Sport Medicine, Tianjin Union Medical Center, Jieyuan Road 190, Hongqiao District, Tianjin 300121, People’s Republic of China
characteristics are very similar to those of tumor stem cells [6, 7]. SP cells help maintain the tumorigenic potential of some tumor cell lines [8–10]. Ho et al. re-ported that SP cells were enriched in tumor-initiating capability compared with non-SP cells by nonobese diabetic/severe combined immunodeficiency xenograft experiments. Matrigel invasion assay showed that SP cells also have higher potential for invasiveness. Human telomerase reverse transcriptase expression was higher in the SP cells, suggesting that this fraction may repre-sent a reservoir with unlimited proliferative potential for generating cancer cells [11]. Chiba et al. hold that a mi-nority population of SP cells detected in hepatocellular carcinoma cells possessed extreme tumorigenic potential and provided heterogeneity to the cancer stem cell sys-tem characterized by distinct hierarchy [12]. Wang et al. observed a strong tumorigenesis ability of SP cells from HeLa cell line following in vivo transplantation into 5-to 6-week-old female Balb/c mice [13]. These findings indicate that SP cells is an enriched source of tumor-initiating cells with stem cell properties and may be an important target for effective therapy and a useful tool to investigate the tumorigenic process.
Interestingly, SP cells are present in primary mesen-chymal neoplasms, including primary OS [14]. Here, we downloaded the gene expression profile GSE63390 from the Gene Expression Omnibus (GEO) database and made bioinformatics analysis to investigate differentially expressed genes (DEGs) that regulated between the SP cells and the non-SP cells from primary human OS. By doing this, we hope that the key target genes and path-ways involved in the carcinogenesis and progression of human OS could be identified and existing molecular mechanisms could be revealed.
Methods
Gene expression microarray data
The gene expression profile GSE63390 was downloaded from the Gene Expression Omnibus (GEO, www.ncbi.nlm.-nih.gov/geo/). GSE63390 was based on Illumina Human HT-12 V4.0 expression beadchip GPL10558 platform. The GSE63390 dataset contained three samples, including three SP cell samples and three non-SP cell samples.
DEGs in SP cells and non-SP cells
The raw data files used for the analysis included TXT files (Illumina platform). The analysis was carried out using GEO2R, which can perform comparisons on ori-ginal submitter-supplied processed data tables using the GEO query and limma R packages from Bioconductor project. The P value < 0.05 and log fold change (FC) > 1.0 or log FC <−1.0 were used as the cut-off criteria. The DEGs with statistical significance between the SP cells and non-SP cells were selected and identified.
GO and KEGG analysis of DEGs
Target genes list were submitted to the Cytoscape software version 3.4.0 (www.cytoscape.org) and ClueGO version 2.33 to identify overrepresented GO categories and pathway categories. Gene Ontology (GO) analysis was used to pre-dict the potential functions of the DEGs in biological process (BP), molecular function (MF), and cellular compo-nent (CC). The Kyoto Encyclopedia of Genes and Genomes (KEGG, http://www.genome.jp/) is a knowledge base for systematic analysis of gene functions, linking genomic in-formation with higher-level systemic functions. Finally, the overrepresented pathway categories with a P value < 0.05 were considered statistically significant using KEGG pathway enrichment analysis.
Gene interaction network construction
A large number of DEGs we obtained may be human OS-associated genes, and it is suggested that these DEGs in SP cells may participate in the progression of human OS. Firstly, DEGs list was submitted to the Search Tool for the Retrieval of Interacting Genes (STRING) database (http://www.string-db.org/) and an interaction network chart with a combined score > 0.4 was saved and exported. Subsequently, the interaction regulatory network of human OS-associated genes was visualized using Cytoscape software version 3.4.0. The distribution of core genes in the interaction network was made by NetworkAnalyzer in Cytoscape. Then, the plugin Molecular Complex Detection (MCODE) was applied to screen the modules of the gene interaction network in Cytoscape.
Results
Identification of DEGs
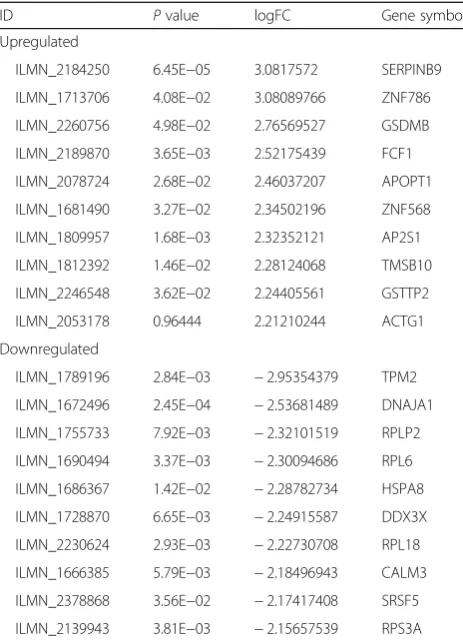
The gene expression profile GSE63390 was downloaded from the GEO, and the GEO2R method was used to identify DEGs in SP cells compared with non-SP cells. P value < 0.05, log FC > 1.0, or log FC <−1.0 were used as the cut-off criteria. After analyzing, differentially expres-sion gene profiles were obtained. Totally, 141 DEGs were identified including 72 upregulated DEGs and 69 downregulated DEGs screened in SP cells of human OS compared with non-SP cells. Parts of DEGs were listed in Table1.
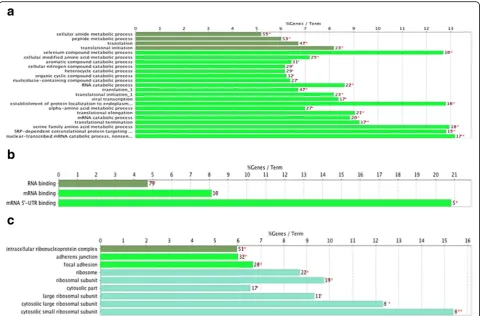
GO term enrichment analysis of DEGs
heterocycle catabolic process, organic cyclic compound catabolic process, nucleobase-containing compound catabolic process, RNA catabolic process, viral transcrip-tion, establishment of protein, localization to endoplas-mic reticulum, alpha-amino acid metabolic process, translational elongation, mRNA catabolic process, trans-lational termination, serine family amino acid metabolic process, SRP-dependent cotranslational protein targeting to membrane, nuclear-transcribed mRNA catabolic process, nonsense-mediated decay, and other biological processes (Fig. 1). For MF, the DEGs were enriched in RNA binding, mRNA binding, mRNA 5′-UTR binding and others. In addition, GO CC analysis also showed that the DEGs were significantly enriched in intracellular ribonucleoprotein complex, adherens junction, focal ad-hesion, ribosome, ribosomal subunit, cytosolic part, large ribosomal subunit, cytosolic large ribosomal subunit, cytosolic small ribosomal subunit, and others.
KEGG pathway analysis of DEGs
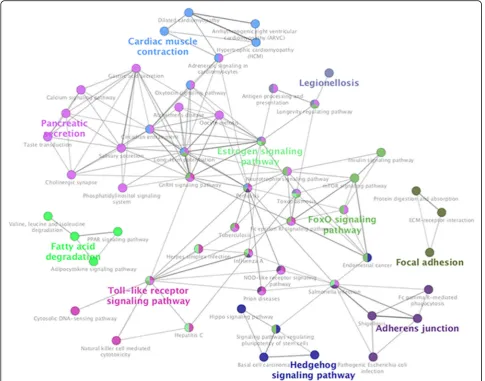
The result of KEGG pathway analysis revealed that target genes were enriched in estrogen signaling path-way, hippo signaling pathway, adherens junction,
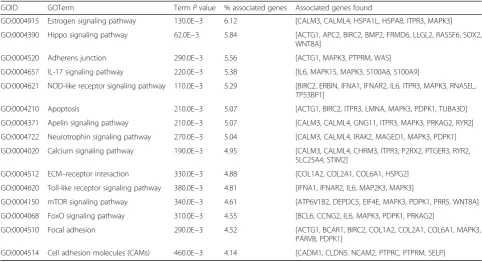
NOD-like receptor signaling pathway, apelin signaling pathway, ECM–receptor interaction, Toll-like receptor signaling pathway, mTOR signaling pathway, FoxO signaling pathway, cell adhesion molecules (CAMs) and hedgehog signaling pathway, and others. These key pathways were showed in Fig.2. Fifty-five nodes and 163 edges could be discovered in this network. FoxO signal-ing pathway and mTOR signalsignal-ing pathway clustered to-gether. Estrogen signaling pathway and hippo signaling pathway clustered together. Besides, these core pathways and their associated genes found were summarized in Table 2. The first-ranking estrogen signaling pathway had the 6.12% associated genes, which included CALM3, CALML4, HSPA1L, HSPA8, ITPR3, and MAPK3. The second-placed hippo signaling pathway had the 5.84% associated genes, which included ACTG1, APC2, BIRC2, BMP2, FRMD6, LLGL2, RASSF6, SOX2, and WNT8A.
Interaction network of DEGs and core genes in the interaction network
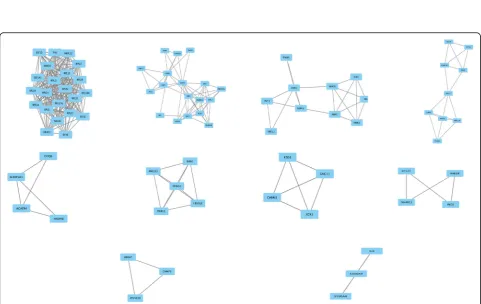
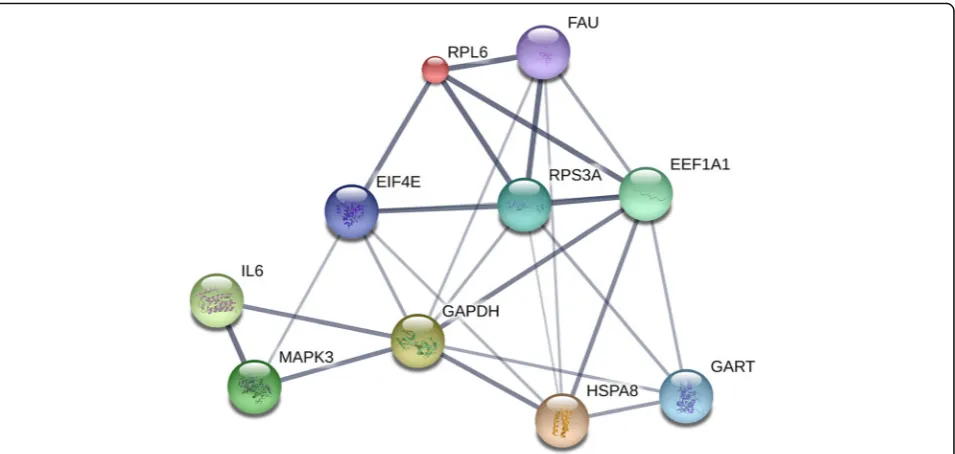
Based on the information in the STRING database, the gene interaction network contained 542 nodes and 1163 edges. The nodes indicated the DEGs, and the edges indicated the interactions between the DEGs. NetworkAnalyzer in Cytoscape software was used to analysis these genes, and core genes were ranked according to the predicted scores. The top 10 high-degree hub nodes included glyceraldehyde-3-phosphate dehydrogenase (GAPDH), phosphoribosylglycinamide formyltransferase, phosphoribo-sylglycinamide synthetase, phosphoribosylaminoimidazole synthetase (GART), ubiquitin-like and ribosomal protein S30 fusion (FAU), heat shock protein family A member 8 (HSPA8), eukaryotic translation elongation factor 1 alpha 1 (EEF1A1), ribosomal protein S3A (RPS3A), eukaryotic translation initiation factor 4E (EIF4E), mitogen-activated protein kinase 3 (MAPK3), interleukin 6 (IL6), and riboso-mal protein L6 (RPL6). Among these genes, GAPDH showed the highest node degree, which was 56. The core genes and their corresponding degree were shown in Table3. The distribution of core genes in the interaction network was revealed in Fig. 3. The correlation between the data points and corresponding points on the line is approximately 0.932. The R-squared value is 0.846, giving a relatively high confidence that the underlying model is in-deed linear. Then, we used MCODE to screen the modules of the gene interaction network, and 10 modules were showed in Fig.4.
The score of top 1 module including FAU and EIF4E was 19.81, which had 22 nodes and 208 edges. The score of top 2 module including GAPDH and GART was 6.824, which had 18 nodes and 58 edges. The score of top 3 module including FBXO10, RNF213, SIAH1, TRIM50, and TRIP12 was 5, which had 5 nodes and 10 edges. Lastly, the interaction network of the top 10 Table 1The top 10 regulated DEGs in OS SP cells withPvalue
< 0.05
ID Pvalue logFC Gene symbol Upregulated
ILMN_2184250 6.45E−05 3.0817572 SERPINB9 ILMN_1713706 4.08E−02 3.08089766 ZNF786 ILMN_2260756 4.98E−02 2.76569527 GSDMB ILMN_2189870 3.65E−03 2.52175439 FCF1 ILMN_2078724 2.68E−02 2.46037207 APOPT1 ILMN_1681490 3.27E−02 2.34502196 ZNF568 ILMN_1809957 1.68E−03 2.32352121 AP2S1 ILMN_1812392 1.46E−02 2.28124068 TMSB10 ILMN_2246548 3.62E−02 2.24405561 GSTTP2 ILMN_2053178 0.96444 2.21210244 ACTG1 Downregulated
ILMN_1789196 2.84E−03 −2.95354379 TPM2 ILMN_1672496 2.45E−04 −2.53681489 DNAJA1 ILMN_1755733 7.92E−03 −2.32101519 RPLP2 ILMN_1690494 3.37E−03 −2.30094686 RPL6 ILMN_1686367 1.42E−02 −2.28782734 HSPA8 ILMN_1728870 6.65E−03 −2.24915587 DDX3X ILMN_2230624 2.93E−03 −2.22730708 RPL18 ILMN_1666385 5.79E−03 −2.18496943 CALM3 ILMN_2378868 3.56E−02 −2.17417408 SRSF5 ILMN_2139943 3.81E−03 −2.15657539 RPS3A
high-degree hub nodes (core genes) was made by STRING database in Fig. 5. GAPDH, GART, FAU, HSPA8, EEF1A1, RPS3A, EIF4E, MAPK3, IL6, and RPL6, which regulate 8, 4, 5, 6, 6, 6, 5, 3, 2, and 4 targets, respectively, showed the good connectivity.
Discussion
OS is the most common primary bone sarcoma [15–19]. Previous studies discovered that sarcomas contain a small subpopulation of tumor-propagating cells (TPCs) such as SP cells, characterized by enhanced tumorigen-icity and self-renewal capacity [20–22]. Self-renewal is a defining characteristic of these cells and is associated with tumor recurrence [23, 24]. The inhibition of self-renewal in OS SP cells may offer valuable targets of therapy and tumorigenesis mechanisms. In the present study, the gene expression profile of GSE63390 was downloaded and a bioinformatics analysis was per-formed. The results showed that there were 141 DEGs in SP cells compared with non-SP cells of human OS. Furthermore, GO and KEGG pathway and gene–gene interaction network analysis were performed to obtain the biomarkers or the major genes related to cytogenetic pathways to OS tumorigenesis.
progression, which could be a potential target for gene therapy [28]. Emerging data suggested that interference with hedgehog signaling signal transduction by inhibitors may reduce OS cell proliferation and tumor growth, thereby preventing osteosarcomagenesis [29]. All these signaling pathways may play important roles in molecular mechanism of development process between SP cells and human OS.
Also of note is that there were numerous evidences for our DEGs of SP cells, which have proven to play important roles during OS tumorigenesis. The STRING database re-vealed top 20 high-degree hub nodes of DEGs including GAPDH, GART, FAU, HSPA8, EEF1A1, RPS3A, EIF4E, MAPK3, IL6, RPL6, eukaryotic translation initiation factor 3 beta (EIF3b), DEAD-box helicase 5 (DDX5), heat shock protein family D member 1 (HSPD1), ribosomal protein S29 (RPS29), ribosomal protein L18a (RPL18A), ribosomal protein L18 (RPL18), calmodulin 3 (CALM3), actin gamma
in the proliferation of OS cells, MYC interacts with the subunits of EIF3 and probably involves the translational control of growth-promoting proteins [31]. EIF3, a multi-subunit complex, plays a critical role in transla-tion initiatransla-tion. Expression levels of EIF3 subunits are elevated or decreased in various cancers, suggesting a role for EIF3 in tumorigenesis [32]. Choi et al. con-firmed that EIF3b silencing could completely suppress cell growth in multiple OS cell lines [33]. Osborne et al. also discovered that EIF4E is uniformly expressed in OS patient samples and it could be a relevant protein biomarker in OS [34]. Rossman et al. found that over-expressing FAU itself is able to transform human osteo-genic sarcoma cells to anchorage independence and make them easy to proliferate [35]. Liang et al. proved that the expression of HSPD1 was high in OS tissues and cells; moreover, targeted inhibition of this gene could inhibit the proliferation of the tumor [36]. Zhang et al. indicated that the decreased expression of KISS1 is correlated with distant metastasis of OS, and KISS1
may function as a tumor suppressor in OS cells through inhibition of the MAPK pathway [37]. EEF1A1 is overexpressed in OS cell lines, and siRNA treatment against EEF1A1 produces a chemosensitization toward methotrexate, which showed that this gene is a poten-tial therapeutic target of OS [38]. Through ASK1/p38/ AP-1 signal pathway, IL-6 occurs, which in turn results in the activations of vascular endothelial growth factor (VEGF) expression and contributing the angiogenesis of human OS cells [39]. In addition, the ILK/Akt/AP-1 pathway is activated after IL-6 treatment, and IL-6 in-duces expression of ICAM-1 and migration activity of human OS cells [40]. Yotov et al. proposed that PRIM1 is a major target of 12q13 amplifications, playing an es-sential role in tumorigenesis of human OS [41]. PTTG1 siRNA markedly downregulates the expression of PTTGl protein in OS cells, leading to obvious inhib-ition of cell proliferation, alters cell cycle distribution, and reduces ability of invasion of OS cells [42]. Tsai et al. deemed that expression stability of RPL32 is high in OS samples, and this gene could be a potential target [43]. In Montesano’s study, the anti-apoptotic role of TRAP1 is confirmed in Saos-2 OS cells, which sug-gested that increased expression of this gene could make diethylmaleate-adapted and chemoresistant cells evade toxic effects of oxidants and anticancer drugs [44]. Endo-Munoz et al. proved downregulation of S100A8 between chemo-naive OS biopsies and non-malignant bone biopsies, highlighting their Table 2Core pathways and their associated genes found
GOID GOTerm TermPvalue % associated genes Associated genes found
GO:0004915 Estrogen signaling pathway 130.0E−3 6.12 [CALM3, CALML4, HSPA1L, HSPA8, ITPR3, MAPK3] GO:0004390 Hippo signaling pathway 62.0E−3 5.84 [ACTG1, APC2, BIRC2, BMP2, FRMD6, LLGL2, RASSF6, SOX2,
WNT8A]
GO:0004520 Adherens junction 290.0E−3 5.56 [ACTG1, MAPK3, PTPRM, WAS] GO:0004657 IL-17 signaling pathway 220.0E−3 5.38 [IL6, MAPK15, MAPK3, S100A8, S100A9]
GO:0004621 NOD-like receptor signaling pathway 110.0E−3 5.29 [BIRC2, ERBIN, IFNA1, IFNAR2, IL6, ITPR3, MAPK3, RNASEL, TP53BP1]
GO:0004210 Apoptosis 210.0E−3 5.07 [ACTG1, BIRC2, ITPR3, LMNA, MAPK3, PDPK1, TUBA3D] GO:0004371 Apelin signaling pathway 210.0E−3 5.07 [CALM3, CALML4, GNG11, ITPR3, MAPK3, PRKAG2, RYR2] GO:0004722 Neurotrophin signaling pathway 270.0E−3 5.04 [CALM3, CALML4, IRAK2, MAGED1, MAPK3, PDPK1] GO:0004020 Calcium signaling pathway 190.0E−3 4.95 [CALM3, CALML4, CHRM3, ITPR3, P2RX2, PTGER3, RYR2,
SLC25A4, STIM2]
GO:0004512 ECM–receptor interaction 330.0E−3 4.88 [COL1A2, COL2A1, COL6A1, HSPG2] GO:0004620 Toll-like receptor signaling pathway 380.0E−3 4.81 [IFNA1, IFNAR2, IL6, MAP2K3, MAPK3]
GO:0004150 mTOR signaling pathway 340.0E−3 4.61 [ATP6V1B2, DEPDC5, EIF4E, MAPK3, PDPK1, PRR5, WNT8A] GO:0004068 FoxO signaling pathway 310.0E−3 4.55 [BCL6, CCNG2, IL6, MAPK3, PDPK1, PRKAG2]
GO:0004510 Focal adhesion 290.0E−3 4.52 [ACTG1, BCAR1, BIRC2, COL1A2, COL2A1, COL6A1, MAPK3, PARVB, PDPK1]
GO:0004514 Cell adhesion molecules (CAMs) 460.0E−3 4.14 [CADM1, CLDN5, NCAM2, PTPRC, PTPRM, SELP]
Table 3The core genes and their corresponding degree
Fig. 3The distribution of core genes in the interaction network. The black node means the core gene. The red line means the fitted line, and the blue line means the power law. The correlation between the data points and corresponding points on the line is approximately 0.932. The R-squared value is 0.846, giving a relatively high confidence that the underlying model is indeed linear
potential as therapeutic targets for OS [45]. Cheng et al. confirmed that through inactivating MAPK and NF-κB signaling pathways, downregulation of S100A9 could inhibit OS cell growth [46]. Besides, Both et al. concluded that some genes, including SHMT1, are can-didate oncogenes in 17p11.2–p12 of importance in OS tumorigenesis [47]. Taken together, all these core genes discovered in OS SP cells by bioinformatics enrichment analysis and gene interaction network analysis may in-crease or dein-crease tumorigenicity and self-renewal cap-acity of OS SP cells; further, these changed SP cells could result in development process of human OS.
Some gene and pathway interaction relationship pdicted in our study has been reported in previous re-searches. Oncogenic activation of mTOR signaling significantly contributes to the progression of different types of cancers including OS. EIF4E is one of the down-stream effectors of mTOR. Activated mTOR contributes to OS cellular transformation and poor cancer prognosis via targeting the downstream effectors such as EIF4E [48]. In addition, our results of core pathways and their associated genes found also confirmed the relationship of EIF4E and mTOR signaling pathway. Therefore, EIF4E/mTOR signaling pathway could be a potential research target for therapy and tumorigenesis of OS.
Lastly, there are several limitations of this study. It is acknowledged that predicting key genes merely by means of bioinformatics is not sufficient, and further molecular biological experiments such as the use of gene transfec-tion/knockdown and quantitative real-time polymerase chain reaction are needed to confirm these results.
Conclusion
In summary, 141 DEGs were identified including 72 up-regulated DEGs and 69 downup-regulated DEGs screened in SP cells compared with non-SP cells. GO and KEGG pathway analysis provided a series of related key genes and pathways to contribute to the understanding of the molecular mechanisms between SP cells and human OS, thus yielding clues to speculate the EIF4E/mTOR signal-ing pathway is highly correlated with the development process of OS. Furthermore, these predictions need further experimental validation in future studies.
Abbreviations
ACTG1:Actin gamma 1; BP: Biological process; CALM3: Calmodulin 3; CAMs: Cell adhesion molecules; CC: Cellular component; DDX5: DEAD-box helicase 5; DEG: Differentially expressed gene; EEF: Eukaryotic translation elongation factor; EIF3b: Eukaryotic translation initiation factor 3 beta; FAU: Ubiquitin-like and ribosomal protein S30 fusion; FC: Fold change; GAPDH: Glyceraldehyde-3-phosphate dehydrogenase;
GART: Phosphoribosylglycinamide formyltransferase,
phosphoribosylglycinamide synthetase, phosphoribosylaminoimidazole synthetase; GEO: Gene Expression Omnibus database; GO: Gene Ontology; HSPA8: Heat shock protein family A member 8; HSPD1: Heat shock protein family D member 1; IL6: Interleukin 6; KEGG: Kyoto Encyclopedia of Genes and Genomes; KISS1: KiSS-1 metastasis-suppressor; MAPK3: Mitogen-activated protein kinase 3; MCODE: Molecular complex detection; MF: Molecular function; OS: Osteosarcoma; PTTG1: Pituitary tumor-transforming 1; RPL6: Ribosomal protein L6; RPS: Ribosomal protein; S100A8: S100 calcium-binding protein A8; SHMT1: Serine hydroxymethyltransferase 1; SP: Side population; SRSF3: Serine/arginine-rich splicing factor 3; STRING: Search Tool for the Retrieval of Interacting Genes; TPC: Tumor-propagating cell; TRAP1: TNF receptor associated protein 1; VEGF: Vascular endothelial growth factor
Acknowledgements
Yi-Ming Ren wants to thank, in particular, the continued supports received from Fiona Xue over 8 years.
Availability of data and materials
The data was freely downloaded from the public GEO database.
Authors’contributions
YMR, YHD, and YBS conceived the design of the study. TY, WJZ, DLZ, and ZWT performed and collected the data and contributed to the design of the study. TY and WJZ analyzed the data. YMR and MQT prepared and revised the manuscript. All authors read and approved the final content of the manuscript.
Ethics approval and consent to participate
Not applicable. This paper does not involve research on humans.
Consent for publication Not applicable.
Competing interests
The authors declare that they have no competing interests.
Publisher’s Note
Springer Nature remains neutral with regard to jurisdictional claims in published maps and institutional affiliations.
Received: 26 January 2018 Accepted: 8 June 2018
References
1. Mirabello L, Troisi RJ, Savage SA. Osteosarcoma incidence and survival rates from 1973 to 2004: data from the surveillance, epidemiology, and end results program. Cancer. 2009;115(7):1531–43.
2. Damron T, Ward WA. Osteosarcoma, chondrosarcoma, and Ewing’s sarcoma: National Cancer Data Base Report. Clin Orthop Related Res. 2007;459(459): 40.
3. Ottaviani G, Jaffe N. The epidemiology of osteosarcoma. Pediatr Adolesc Osteosarcoma. 2009;152:3–13.
4. Marina N, Gebhardt M, Teot L, et al. Biology and therapeutic advances for pediatric osteosarcoma. Oncologist. 2004;9(4):422.
5. Folio C, Zalacain M, Zandueta C, et al. Cortactin (CTTN) overexpression in osteosarcoma correlates with advanced stage and reduced survival. Cancer Biomarkers. 2011;10(1):35.
6. Wu C, Alman BA. Side population cells in human cancers. Cancer Lett. 2008; 268(1):1–9.
7. Patrawala L, Calhoun T, Schneiderbroussard R, et al. Side population is enriched in tumorigenic, stem-like cancer cells, whereas ABCG2+ and ABCG2−cancer cells are similarly tumorigenic. Cancer Res. 2005;65(14):6207. 8. Mitsutake N, Iwao A, Nagai K, et al. Characterization of side population in
thyroid cancer cell lines: cancer stemlike cells are enriched partly but not exclusively. Endocrinology. 2007;148(4):1797–803.
9. Kondo T, Setoguchi T, Taga T, Kondo T, Setoguchi T. Taga TPersistence of a small subpopulation of cancer stem-like cells in the C6 glioma cell line. Proc Natl Acad Sci U S A. 2004;101(3):781–6.
10. Haraguchi N, Utsunomiya T, Inoue H, et al. Characterization of a side population of cancer cells from human gastrointestinal system. Stem Cells. 2006;24(3):506.
11. Ho MM, Ng AV, Lam S, et al. Side population in human lung cancer cell lines and tumors is enriched with stem-like cancer cells. Cancer Res. 2007; 67(10):4827–33.
12. Chiba T, Kita K, Zheng YW, et al. Side population purified from hepatocellular carcinoma cells harbors cancer stem cell-like properties. Hepatology. 2006;44(1):240–51.
13. Wang K, Zeng J, Luo L, et al. Identification of cancer stem cell-like side population cells in human cervical carcinoma cell line HeLa[C]// The Tenth National Conference on obstetrics and Gynecology of China Medical Association, 2012.
14. Hirschmann-Jax C, et al. A distinct“side population”of cells with high drug efflux capacity in human tumor cells. Proc Natl Acad Sci U S A. 2004;101(39):14228–33.
15. Zhou W, Hao M, Du X, et al. Advances in targeted therapy for osteosarcoma. Discov Med. 2014;17(96):301.
16. Li S, Dong Y, Ke W, et al. Transcriptomic analyses reveal the underlying pro-malignant functions of PTHR1 for osteosarcoma via activation of Wnt and angiogenesis pathways. J Orthop Surg Res. 2017;12(1):168.
17. Fei Z, Hao P. LncRNA-ANCR regulates the cell growth of osteosarcoma by interacting with EZH2 and affecting the expression of p21 and p27. J Orthop Surg Res. 2017;12(1):103.
18. Feng J, Lan R, Cai G, et al. Verification ofTREX1as a promising indicator of judging the prognosis of osteosarcoma. J Orthop Surg Res. 2016;11(1):150. 19. Yang XR, Xiong Y, Duan H, et al. Identification of genes associated with
methotrexate resistance in methotrexate-resistant osteosarcoma cell lines. J Orthop Surg Res. 2015;10(1):136.
20. Wang CY, Wei Q, Han I, et al. Hedgehog and notch signaling regulate self-renewal of undifferentiated pleomorphic sarcomas. Cancer Res. 2012;72(4):1013–22.
21. Dela CFS. Cancer stem cells in pediatric sarcomas. Front Oncol. 2013;3:168. 22. Wu C, Wei Q, Utomo V, et al. Side population cells isolated from mesenchymal
neoplasms have tumor initiating potential. Cancer Res. 2007;67(17):8216–22. 23. Kreso A, Van GP, Pedley NM, et al. Self-renewal as a therapeutic target in
human colorectal cancer. Nat Med. 2014;20(1):29–36.
24. Zhu Z, Khan MA, Weiler M, et al. Targeting self-renewal in high-grade brain tumors leads to loss of brain tumor stem cells and prolonged survival. Cell Stem Cell. 2014;15(2):185–98.
25. Zhou Q, Deng Z, Zhu Y, et al. mTOR/p70S6K signal transduction pathway contributes to osteosarcoma progression and patients’prognosis. Med Oncol. 2010;27(4):1239–45.
26. Wang DY, Wu YN, Huang JQ, et al. Hippo/YAP signaling pathway is involved in osteosarcoma chemoresistance. Chin J Cancer. 2016;35(7):366–73. 27. Chai J, Xu S, Guo F. TEAD1 mediates the oncogenic activities of
hippo-YAP1 signaling in osteosarcoma. Biochem Biophys Res Commun. 2017; 488(2):297–302.
28. Cheng DD, Li J, Li SJ, et al. CNOT1 cooperates with LMNA to aggravate osteosarcoma tumorigenesis through the hedgehog signaling pathway. Mol Oncol. 2017;11(4):388–404.
29. Kumar RM, Fuchs B. Hedgehog signaling inhibitors as anti-cancer agents in osteosarcoma. Cancers. 2015;7(2):784–94.
30. Ajiro M, Jia R, Yang Y, et al. A genome landscape of SRSF3-regulated splicing events and gene expression in human osteosarcoma U2OS cells. Nucleic Acids Res. 2016;44(4):1854.
31. Luo S, Zhao J, Fowdur M, et al. Highly expressed ribosomal protein L34 indicates poor prognosis in osteosarcoma and its knockdown suppresses osteosarcoma proliferation probably through translational control. Sci Rep. 2016;6:37690.
32. Mamane Y, Petroulakis E, Rong L, et al. eIF4E from translation to transformation. Oncogene. 2004;23(18):3172–9.
33. Choi YJ, Lee YS, Lee HW, et al. Silencing of translation initiation factor eIF3b promotes apoptosis in osteosarcoma cells. Bone Joint Res. 2017:186–93. 34. Osborne TS, Ren L, Healey JH, et al. Evaluation of eIF4E expression in an osteosarcoma-specific tissue microarray. J Pediatr Hematol Oncol. 2011; 33(7):524–8.
35. Rossman TG, Visalli MA, Komissarova EV. Fau and its ubiquitin-like domain (FUBI) transforms human osteogenic sarcoma (HOS) cells to anchorage-independence. Oncogene. 2003;22(12):1817.
36. Liang W, Yang C, Peng J, et al. The expression of HSPD1, SCUBE3, CXCL14 and its relations with the prognosis in osteosarcoma. Cell Biochem Biophys. 2015;73(3):763–8.
37. Zhang Y, Tang YJ, Li ZH, et al. KISS1 inhibits growth and invasion of osteosarcoma cells through inhibition of the MAPK pathway. Eur J Histochem Ejh. 2013;57(4):199–204.
38. Selga E, Oleaga C, Ramírez S, et al. Networking of differentially expressed genes in human cancer cells resistant to methotrexate. Genome Med. 2009;1(9):83. 39. Tzeng HE, Tsai CH, Chang ZL, et al. Interleukin-6 induces vascular
endothelial growth factor expression and promotes angiogenesis through apoptosis signal-regulating kinase 1 in human osteosarcoma. Biochem Pharmacol. 2013;85(4):531–40.
40. Lin YM, Chang ZL, Liao YY, et al. IL-6 promotes ICAM-1 expression and cell motility in human osteosarcoma. Cancer Lett. 2013;328(1):135–43. 41. Yotov WV, Hamel H, Rivard GE, et al. Amplifications of DNA primase 1 (PRIM1)
in human osteosarcoma. Genes Chromosomes Cancer. 1999;26(1):62. 42. Wu D, Xia Y, Xu H, et al. Impact of PTTG1 downregulation on cell
43. Tsai PC, Breen M. Array-based comparative genomic hybridization-guided identification of reference genes for normalization of real-time quantitative polymerase chain reaction assay data for lymphomas, histiocytic sarcomas, and osteosarcomas of dogs. Am J Vet Res. 2012;73(9):1335.
44. Montesano GN, Chirico G, Pirozzi G, et al. Tumor necrosis factor-associated protein 1 (TRAP-1) protects cells from oxidative stress and apoptosis. Stress-Int J Biol Stress. 2007;10(4):342–50.
45. Endo-Munoz L, Cumming A, Sommerville S, et al. Osteosarcoma is characterised by reduced expression of markers of osteoclastogenesis and antigen presentation compared with normal bone. Br J Cancer. 2010;103(1):73–81.
46. Cheng S, Zhang X, Huang N, et al. Down-regulation of S100A9 inhibits osteosarcoma cell growth through inactivating MAPK and NF-κB signaling pathways. BMC Cancer. 2016;16(1):1–12.
47. Both J, et al. Identification of novel candidate oncogenes in chromosome region 17p11.2-p12 in human osteosarcoma. PLoS One. 2012;7(1):e30907. 48. Hu K, Dai HB, Qiu ZL. mTOR signaling in osteosarcoma: oncogenesis and