An Investigation of relationship between
learning styles and performance of learners
*Md. Tanwir Uddin Haider , **Aditya K Sinha and ***Banshi Dhar Chaudhary
* National Institute of Technology, Patna **National Institute of Technology,Jamshedpur ***Motilal Nehru National Institute of Technology, Allahabad
{ INDIA}
* [email protected] , **[email protected], ***[email protected]
Abstract
Both academic institutions and industries have a common shared experience that approximately five to ten percent of talented students and trainees become academically deficient during their academic or training programs. This is a significant loss both to organizations and to students and trainees. Our research work is aimed to identify some of the factors, which may be responsible for these losses. This paper presents the results of the experiment conducted to investigate the relationship, if any, between learning styles, different category of learners and academic deficiency. Further, the experiment aimed to investigate the relationship between learning styles and performance of learners in online quizzes in three different subject domains of distinctive characteristics. The results indicate that significant number of academic deficient learners is not inclined towards a specific learning style. Study of the performance of different category of students on online quiz of different subject domain shows that difference in learning styles does not affect it. However, learners belonging to verbal learning styles did well in “Introduction to Engineering Profession” subject. Learners who are neutral to visual- verbal learning style group did well in “Computer Programming” and those who belong to active learning style group did well in “ Database Management System”.
1 INTRODUCTION
In India selection for either professional degree programs or jobs is highly competitive due to limited availability of opportunities. Those who get selected are highly talented and are generally from top ten percent in order of merit of the selection criteria. It has been observed in both academic institution and industries approximately five to ten percent of selected students and trainees become academically deficient during their degree or training programs. Some of these academically deficient students and trainees are forced out of the organization. This loss is significant for both academic institutions and industries.
Present research work is motivated by our desire to identify factors which make these talented students and trainees academically deficient and provide an alternative solution to come out of such problems. This paper presents results of experiments conducted to categories students and trainees based on their learning styles and to investigate the relationship between learning styles and academic deficiency. Further, experiments were conducted to investigate the relationship between learning styles and performance of students in on-line quizzes and conventional style end-semester examination in three courses of distinct characteristics, which are offered at different levels of Bachelor of Technology program in university like setting.
This paper is organized in four sections. Section 2 presents the related work. Section 3 describes experiments and their results. Section 4 contains the conclusion and observations.
2 RELATED WORK
task”. There have been many characteristics of learning style preferences. Felder-Silverman [2] proposed four dimensions of learning styles viz. active-reflective, sensing-intuitive, visual-verbal and sequential-global based on information processing model of the learner. The active learners prefer to learn by trying things out where as the reflective learners learn by thinking things through. The sensing learners are practical, concrete oriented and prefers facts and procedures whereas intuitive learners are innovative and prefers conceptualization and abstraction. The visual learners prefers visual representation where as verbal learners prefers written and spoken explanations. The sequential learners learn in small incremental steps where as the global learners learn in large leaps.
Bohlen and Ferrat [3] experimentally investigated whether end-user learning outcomes (i.e. achievement, efficiency and satisfaction) are affected by the methods of instruction, the user's learning style, or the combination of these two factors. The results indicated that the method of instruction alone and in combination with learning style makes a difference in some but not all measures of achievement, efficiency and satisfaction.
Lynda Thomas [4] examined correlations between preferred learning style and performance on both the examination and practical aspects of an introductory programming course. Students of different learning style were compared to their performance on the examination and the practical programming part of the introductory programming module. They have experimentally shown that there was significant difference in performance between groups of students having different learning styles.
Davis [5] investigated outcomes of first year English students under seven instructors where the learning style of the students was either matched, unmatched or partially matched to that of instructors. They found no significant differences in student outcomes among the groups.
Larsen [6] reported the results of students with different learning styles using interactive video instruction to learn the concepts of data communications. He found no significant difference in student’s outcomes as a result of different learning styles.
Aditya [9] investigated the relationships between learning styles, instruction methods and performance of learners. The result of investigation indicated that there is no significant difference in performance of students due to different methods of instruction. Further, the online behavior and performance of students with different learning styles were different. Results of these experiments are pointer to the complexity of learning process and effect of instruction and evaluation methodologies.
3 EXPERIMENTS
We have conducted experiment to investigate the relationship between learning styles and academic deficiency of the learner appeared for the examination in the conventional university type setting. Further, experiment was conducted to investigate the relationship between learning styles and performance of students in both conventional end-semester examination and on-line quizzes in three subjects offered at different levels of degree programs. For the measurement of learning styles, we have used Index of Learning Style (ILS) instrument developed by Felder and Soloman [7] to find the learning styles. It consists of forty-four questions each of having four alternative answers and is available at http://www.engr.ncsu.edu/learningstyles/ilsweb.html. We provided a link to this site from our intranet web server developed exclusively for these experiments. Each participant was required to sign-in and then answers the questions. Results for each participant were captured in a database and were also displayed to participants.
Table 1. Merged group in each dimension
3.1 Relationship between Learning Styles and Academic Deficiency
This experiment was conducted to see if the academic deficient (ACD) students belonged to any specific learning style groups. There were only thirty-five students found as academic deficient in the total of three hundred twenty three students in end-semester results. These students were belonged to B.Tech first semester of Motilal Nehru National Institute of Technology, Allahabad. Table 2 shows the distribution of academic deficient students in different learning style groups. Here nar, nsi, nvv, and nsg, stands for neutral preferences to active-reflective, sensing-intuitive, visual-verbal and sequential-global dimensions respectively.
Learning Style act nar ref sen nsi int vis nvv vrb seq nsg glo
No. of Student 7 21 7 6 26 3 10 21 4 7 24 4
Table 2. Number of academic deficient students in different learning style groups.
It is evident from the Table 2 that the number of academic deficient (ACD) students belongs to the students who exhibit neutral preferences to various dimensions of learning styles.
3.2 Relationship between Learning Styles and Performance of Students
The performances of students were tested both on on-line quizzes and on conventional end-semester examination. The online quizzes were conducted for three courses: Introduction to Engineering Profession (IEP), Computer Programming (CP) and Database Management System (DBMS). Introduction to Engineering Profession (IEP) is being taught in B.Tech first semester where as Computer Programming (CP) course is a part of B.Tech second semester. The subjects taught in first and second semesters are common to all streams of undergraduate B.Tech. Whereas the subject Database Management System (DBMS) is taught in B.Tech fourth semester(“Computer Science & Engineering” and “Information Technology” streams of engineering).
3.2.1 Participants
There were eight hundred and five students participated in online quizzes. Students participated in this quizzes were belonged to B.Tech. first semester, B.Tech second semester and B.Tech fourth semester students of Motilal Nehru National Institute of Technology(MNNIT), Allahabad.
3.2.2 Online quiz
The online quiz was authored using Instructional Management Systems Question and Test Interoperability (IMS QTI) standard. Our implementation provided for shuffling the order of questions, shuffling the alternative options and changing the data values in the question or the alternatives answers. This was used to ensure that each student would receive a unique but semantically equivalent question.
3.2.3 Results
We analyzed the clicking pattern of each student. The performance was computed as a ratio of right clicks and total number of clicks. The average performance of students categorized according to their learning styles in online quiz in different courses is tabulated in Table 3. We also analyzed the performance of students in end-semester examination belonged to different category of learning styles. The grade points are given in Semester Grade Performance Index (SGPI). The results of analysis are tabulated in Table 4.
It is evident from both the figures that variation in performance of students based on learning styles was not statistically significant. However, reflective students did well in three subjects and tops in the performance in end-semester examination but neutral visual-verbal group did well in Computer Programming (CP) subject in online quiz.
Average Score in %
Subjects
Category
IEP CP DBMS
Active (act) 65.7 93.6 63.1
Neutral active-reflective (nar) 65.1 96.2 55.2
Reflective (ref) 66.7 92.0 56.0
Sensing (sen) 65.8 90.7 52.0
Neutral sensing-intuitive (nsi) 64.2 96.7 57.6
Intuitive (int) 71.3 94.1 57.8
Visual (vis) 67.5 92.6 59.0
Neutral visual-verbal (nvv) 62.3 99.4 53.7
Verbal (vrb) 77.2 77.6 55.0
Sequential (seq) 63.0 91.6 56.0
Neutral sequential-global (nsg) 65.4 96.6 55.9
Global (glo) 71.9 93.7 61.1
Table 3. Summary of results of average performance for each categorization of LS in online quizzes
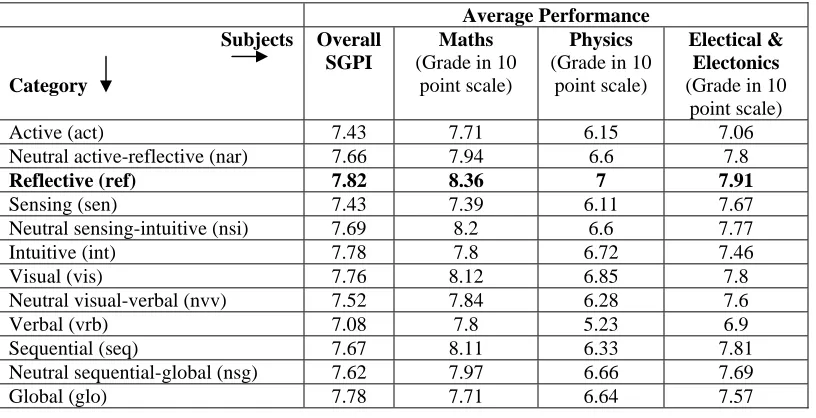
Average Performance Subjects Category Overall SGPI Maths
(Grade in 10 point scale)
Physics
(Grade in 10 point scale)
Electical & Electonics
(Grade in 10 point scale)
Active (act) 7.43 7.71 6.15 7.06
Neutral active-reflective (nar) 7.66 7.94 6.6 7.8
Reflective (ref) 7.82 8.36 7 7.91
Sensing (sen) 7.43 7.39 6.11 7.67
Neutral sensing-intuitive (nsi) 7.69 8.2 6.6 7.77
Intuitive (int) 7.78 7.8 6.72 7.46
Visual (vis) 7.76 8.12 6.85 7.8
Neutral visual-verbal (nvv) 7.52 7.84 6.28 7.6
Verbal (vrb) 7.08 7.8 5.23 6.9
Sequential (seq) 7.67 8.11 6.33 7.81
Neutral sequential-global (nsg) 7.62 7.97 6.66 7.69
3.3 Other experiments and results
This experiment was conducted to investigate whether groups of students registered for different degree programs and trainees employed by the industry have similar distribution based on their learning styles.
3.3.1 Participants
There were eight hundred fifty four participants in this experiment from an academic institution and an Information Technology (IT) company. Participants from the IT industries were new recruitment undergoing a fourteen-week in-house training program. Participants from academic institution belonged to B.Tech., M.Tech., MCA and Ph.D. degree programs. Table 5 shows the number of participants belonging to different groups.
Groups Trainees B.Tech. MCA M.Tech. Ph.D Total
No. of Participants
275 471 41 56 11 854
Table 4 Summary of results of performance for each categorization
3.3.2 Results and discussion
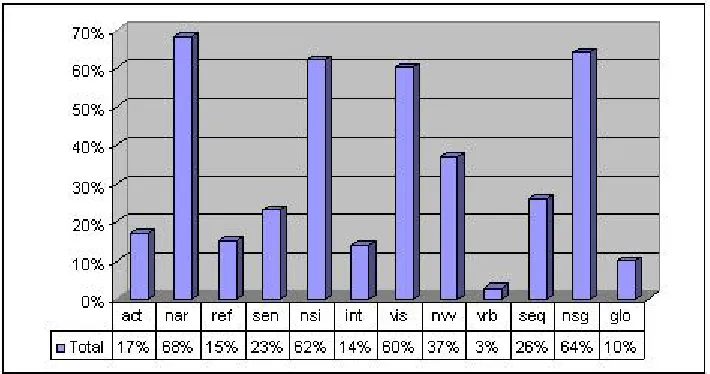
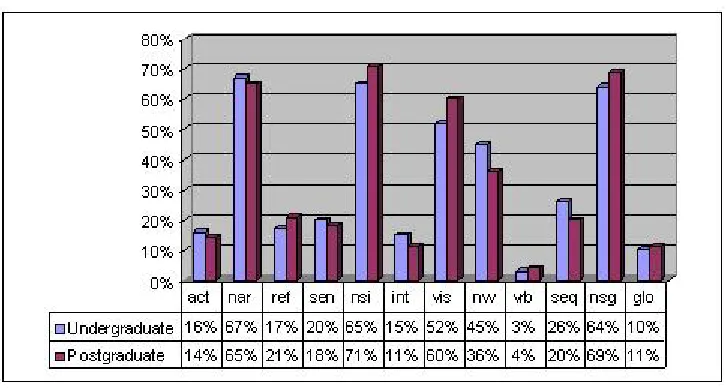
Distribution of Learning styles of the entire population of the participants and its sub-groups are shown in Figure 1. Figure 2 and Figure 3 shows distribution of learning styles of students vs. trainees and of undergraduate vs. postgraduate students respectively.
These figures indicate that the dominant learning style is the neutral group on all four dimensions of learning styles. However, in visual-verbal dimension visual group was the dominant one. It is also evident from these figures that the distribution of learning styles in different category of learner is significantly similar.
Fig. 2. Learning Style of Students vs Trainees
Fig. 3. Learning Style of Undergraduate vs Postgraduate Students
4 CONCLUSION
In the experiments it was found that more than sixty five percent of participants both from academic institution and industry belonged to neutral group on all four dimensions of learning styles. It means that either in educational environment or in industrial setup people who are fairly well balanced on the two dimensions always dominate. The variation of performance of students based on learning styles was not statistically significant. However, reflective students did well in end-semester examination. It is therefore concluded that the reflective students benefited from the conventional teaching in Motilal Nehru National Institute of Technology, Allahabad.
References
[1] Keefe, J.W. & Ferrell, B.G. (1990): “Developing a defensible learning style paradigm”, Educational Leadership, 48 (2) pp. 57-61. [2] Felder, Richard M.(1996).: “Matters of style”, ASEE Prism, 6(4),18-23.
[3] George A. Bohlen,Thomas W. Ferratt (1993):”The effect of learning style and method of instruction on the achievement, efficiency and satisfaction of end-users learning computer software”, Proceedings of the 1993 conference on Computer personnel research, 273-283,ACM Press.
[5] Davis, J.F,, Murrell, P,H. and Davis, T.M.(1988): “On Matching Teaching Approach With Student 281 Learning Style: Are We Asking the Right Question?”, Annual Meeting of Mid South Educational Research Association, Louisville, KY, ERIC Document 303859.
[6] Larsen, R. E.(1992), “Relationship of Learning Style to the Effectiveness and Acceptance of Interactive Video Instruction”, Journal of
Computer-Based Instruction (19:1), pp. 17-21.
[7] Soloman, Barbara A., Felder, Richard M.: “Index of Learning Styles Questionnaire”, http://www.engr.ncsu.edu/learningstyles/ilsweb.html [8] Colin Smythe, Eric Shepherd, Lane Brewer, and Steve Lay (2002): “IMS Question and Test Interoperability: ASI Best Practice and
Implementation Guide”, IMS Global Learning Consortium Inc.,
[9] Sinha Aditya K., Chaudhary B. D.,(2004) : “An investigation of relationship between Learning Styles, Instruction Methods and Performance of Learner”, 15th Annual AAEE conference, Toowoomba, Australia.