Analysis and Effect of Input Parameters on
Surface Roughness and Tool Flank Wear in
Turning Operation
BADRU DOJA1 and DR.D.K.SINGH2
Department of Mechanical Engineering Madan Mohan Malaviya Engineering College
Gorakhpur - 273010 India [email protected], [email protected]2
Abstract - This experimental work presents a technique to determine the better surface quality by controlling the surface roughness and flank wear. In machining operations, achieving desired surface quality features of the machined product is really a challenging job. Because, these quality features are highly correlated and are expected to be influenced directly or indirectly by the direct effect of process parameters or their interactive effects. Thus The four input process parameters such as spindle speed, depth of cut, feed rate, and diameter have been selected to minimize the surface roughness and flank wear simultaneously by using the robust design concept of Taguchi L9(34) method . Taguchi’s optimization analysis indicates that the factors level, its
significance to influence the surface roughness and flank wear for the tuning process.
Keywords: Surface Roughness, Flank Wear, Turning, CMM.
1. Introduction
A typical manufacturing process has several quantitative and qualitative output and performance characteristics that are indicative of its contribution to the success of a manufacturing company (1-8). Such characteristics will generally fit into the broader areas of quality and productivity, with subcategories that include product requirements, throughput, flexibility, labor hours, downtime, safety, and reliability. Furthermore, these and other characteristics can be interdependent – a mismanaged increase in throughput can affect quality, for example. A robust system should therefore include a robust engineering process that seeks a balance among the output and performance aspects of a manufacturing process (2-4).
Among several CNC industrial machining processes, turning is a fundamental machining operation. Turning is the removal of metal from the outer diameter of a rotating cylindrical work piece (3-7). Turning is used to reduce the diameter of the work piece, usually to a specified dimension, and to produce a smooth finish on the metal. Often the work piece will be turned so that adjacent sections have different diameters. In the age of globalization manufacturers are constantly facing the challenges of quality, cost and lead time in order to survive in the cut-throat competitive market(6). The quality of machined components is evaluated in respect of how closely they adhere to set product specifications for length, width, diameter, surface finish, and reflective properties(9-10). Dimensional accuracy, tool wear and quality of surface finish are three factors that manufacturers must be able to control at the machining operations to ensure better performance and service life of engineering component. In the leading edge of manufacturing, manufacturers are facing the challenges of higher productivity, quality and overall economy in the field of manufacturing by machining (5-7).
2. Experimental Setup
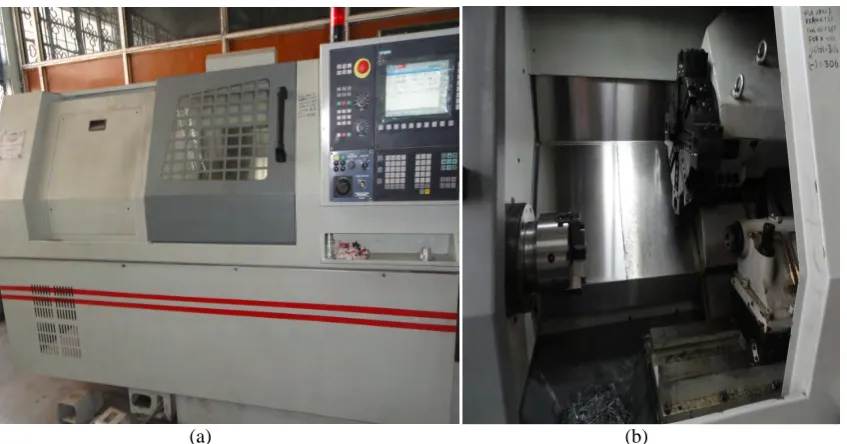
Experiments have been performed on Two-axis CNC turning machine ( SPRINT16TC ) at Indo Danish Tool Room, Jamshedpur (India). The photographic view of CNC turning and experimental set-up are shown in Figure 1.
2.1 Surface Roughness measurement
It was measured on Subtronic-10 surface tester giving Ra value in microns. Ra is measured along four
different lines on the surface and the average value is considered for further analysis.
(a) (b) Figure. 1 Photographic view of (a) CNC turning and (b) experimental set-up
2.2 Flank Wear Measurement Setup
Precision measurement of the manufactured products in cartesian coordinate system can be performed by using a coordinate measuring machine (CMM). Model 850 – CARL ZEISS coordinate measuring machine, which is available at Indo Danish Tool Room, Jamshedpur ( India ), is utilized for the flank wear examination of the experimental tool insert. The available CMM at the Center which is presented in Figure 2 uses digital readouts, air bearings, computer controls to achieve volumetric accuracies in the order of 2.8+L/250 μm . The reference coordinate which is used throughout the machining operations is recreated by forming reference planes on the surfaces of the product. By intersecting surface, reference coordinate of the machined part is defined and fixed.
Figure. 2. Coordinate measuring machine (CMM)
After converting the CMM coordinate system to the part coordinate system, measuring probe becomes aware of the reference coordinate and angular position of the each axis. Comparison of the real flank wear value with the value predicted by CMM indicates flank wear in the tool face. In this experimental study flank wear measure in the tool face.
3. Work piece Material
The material used in this experimental is the commercial mild steel in the form of round bar with 30mm, 40mm and 50mm diameter. Nine experiment done accordingly Taguchi’s L9 orthogonal array. Cutting fluid
Table. 1. Chemical composition of mild steel
Material C Mn Cu Si
Mild Steel 0.16-0.29% 1.65% 0.6% 0.6%
4. Tool and tool material
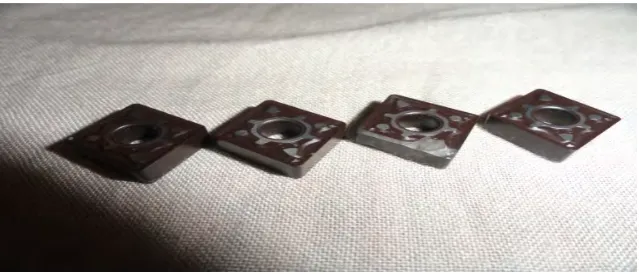
A photographic view of tool inserts show in figure 3. The cutting materials are K10 type uncoated carbide inserts, and as per ISO specification, inserts are designated as CNMG 0808-QM H13A, which are having the following tool geometry: inclination angle, −6°; orthogonal rake angle, −6°; orthogonal clearance angle, 6°; auxiliary cutting edge angle, 15°; principal cutting edge angle, 75°; and nose radius, 0.8 mm. Cutting tool inserts were clamped onto a tool holder with a designation of DBSNR 2020K 12 for turning process make by CERADIZET.
.
Figure 3 photographic view of tool insert
5. Machining parameters and their levels
In this experimental study, spindle speed ( x1 ), depth of cut ( x2 ), feed ( x3 ), and diameter ( x4 ) were
considered as machining parameters. Based on the pilot experimentation, parameters range has been decided [3]. The considered process parameters and their levels are listed in Table 2.
Table. 2. Machining parameters and their levels
level Spindle speed
(rpm)
Depth of cut (mm) Feed(mm/rev) Diameter
(mm)
1 600 0.4 0.1 30
2 700 0.5 0.2 40
3 800 0.6 0.3 50
6. Taguchi method
The quality engineering method proposed by Taguchi is commonly known as the Taguchi method or Taguchi approach. His approach provides a new experimental strategy in which a modified and standardized form of design of experiment (DOE) is used. In other words, the Taguchi approach is a form of DOE with special application principles. The concept of the Taguchi method is that the parameter design is performed to reduce the sources of variation on the quality characteristics of product, and reach a target of process robustness Taguchi designs experiments using specially constructed tables known as “orthogonal array” ( OA ).It utilizes the orthogonal arrays from experimental design theory to study a large number of variables with a small number of experiments. This technique helps to study effect of many factors (variables) on the desired quality characteristic most economically. By studying the effect of individual factors on the results, the best factor combination can be determined. The standardized Taguchi-based experimental design used in this study is an L9
(34) orthogonal array (4).
6.1 Analysis of S/N ratio
In the Taguchi method, the term ‘signal’ represents the desirable value (mean) for the output characteristic and the term ‘noise’ represents the undesirable value (S.D) for the output characteristic. Therefore, the S/N ratio is the ratio of the mean to the S.D. S/N ratio is used to measure the quality characteristic deviating from the desired value. The S/N ratio η is defined as
⁄ 10 . .
where M.S.D is the mean square deviation for the output characteristic. To obtain optimal cutting performance, the–lower–the–better quality characteristic for Surface Roughness and flank wear must be taken[6]. The M.S.D. for the–lower– the– better quality characteristic can be expressed as:
. . 1
Where yi is the value of the observed data for the i-th test and M=1.
6.2 Design Of Experiment
Four machining parameters were selected as control factors, each parameters have three levels, denoted by 1, 2, and 3. The experimental design was based on L9 orthogonal array based on Taguchi method. Minitab 15
software was used for graphical analysis of the obtained data.
Table. 3 experimental design matrix based on Taguchi L9 orthogonal array
S.N. Spindle speed (rpm) Depth of cut(mm) Feed (mm/rev) Diameter (mm)
1 1 1 1 1
2 1 2 2 2
3 1 3 3 3
4 2 1 2 3
5 2 2 3 1
6 2 3 1 2
7 3 1 3 2
8 3 2 1 3
9 3 3 2 1
7. Result and discussion
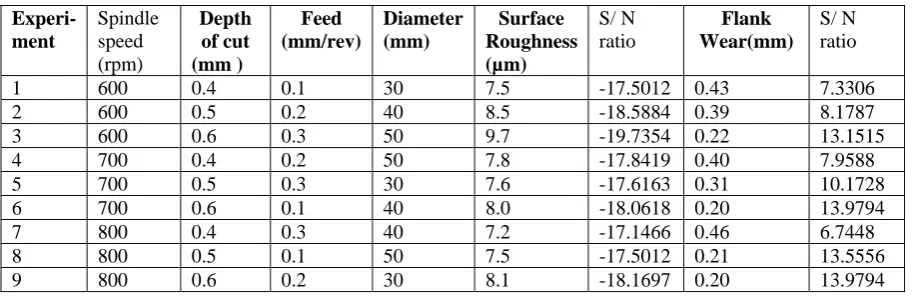
Table. 4 Experimental result for surface roughness and flank wear and the corresponding S/N ratio.
Experi-ment
Spindle speed (rpm)
Depth of cut (mm )
Feed (mm/rev)
Diameter (mm)
Surface Roughness (µm)
S/ N ratio
Flank Wear(mm)
S/ N ratio
1 600 0.4 0.1 30 7.5 -17.5012 0.43 7.3306 2 600 0.5 0.2 40 8.5 -18.5884 0.39 8.1787 3 600 0.6 0.3 50 9.7 -19.7354 0.22 13.1515 4 700 0.4 0.2 50 7.8 -17.8419 0.40 7.9588 5 700 0.5 0.3 30 7.6 -17.6163 0.31 10.1728 6 700 0.6 0.1 40 8.0 -18.0618 0.20 13.9794 7 800 0.4 0.3 40 7.2 -17.1466 0.46 6.7448 8 800 0.5 0.1 50 7.5 -17.5012 0.21 13.5556 9 800 0.6 0.2 30 8.1 -18.1697 0.20 13.9794 7.1.1 Effect of input parameters on Surface roughness
800 700
600 -17.50
-17.75
-18.00 -18.25 -18.50
0.6 0.5
0.4
0.3 0.2
0.1 -17.50
-17.75 -18.00
-18.25 -18.50
50 40
30 Spindle Speed (rpm)
M
e
a
n
of S
N
r
a
ti
os
Depth of Cut(mm)
Feed(mm/rev) Diameter(mm)
Main Effects Plot for SN ratios
Data Means
Signal-to-noise: Smaller is better
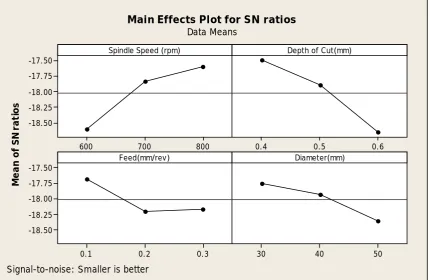
Figure. 4 Effect of input parameters on Surface roughness
7.1.2Selection of Optimal Levels
The response table 5 shows the average of each response characteristic for each level of each factor. The Tables include ranks based on delta statistics, which compare the relative magnitude of effects. The delta statistic is the highest minus the lowest average for each factor. Minitab assigns ranks based on delta values; rank 1 to the highest delta value, rank 2 to the second highest, and so on. The ranks indicate the relative importance of each factor to the response. The ranks and the delta values for various parameters show that has the depth of cut effect on surface roughness and is followed by spindle speed, diameter and feed in that order. As surface roughness is the “lower the better” type quality characteristic, from Figure 3 it can be seen that the third level of spindle speed, first level of depth of cut, first level of feed and first level of diameter result in minimum value of surface roughness.
Table. 5 Response Table for Signal to Noise Ratios for surface roughness Smaller is better
Level Spindle speed (rpm) Depth of cut (mm) Feed (mm/rev) Diameter(mm)
1 -18.61 -17.50 -17.69 -17.76
2 -17.84 -17.90 -18.17 -17.93
3 -17.61 -18.66 -18.17 -18.36
Delta 1.00 1.16 0.51 0.60
Rank 2 1 4 3
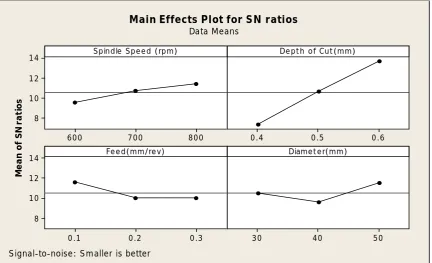
7.2.1 Effect of input parameters on Flank Wear
In order to see the effect of input parameters on the wear experiments were conducted using L9 OA (Table 3). The experimental data is given in Tables 4.
Figure 5 shows that the flank wear increases with the increase of spindle speed and depth of cut and decreases with increase in feed and flank wear first decrease than increase with the increase of diameter.
800 700
600 14
12
10
8
0.6 0.5
0.4
0.3 0.2
0.1 14
12
10
8
50 40
30 Spindle Speed (rpm)
M
e
a
n
of S
N
r
a
ti
o
s
Depth of Cut (mm)
Feed(mm/rev) Diamet er(mm)
Main Effects Plot for SN ratios Data Means
Signal-to-noise: Smaller is better
Figure. 5 Effect of input parameters on flank wear
7.2.2Selection of Optimal Levels
The response table 6 shows the average of each response characteristic for each level of each factor. The Tables include ranks based on delta statistics, which compare the relative magnitude of effects. The delta statistic is the highest minus the lowest average for each factor. Minitab assigns ranks based on delta values; rank 1 to the highest delta value, rank 2 to the second highest, and so on. The ranks indicate the relative importance of each factor to the response. The ranks and the delta values for various parameters show that depth of cut has the greatest effect on flank wear and is followed by diameter, spindle speed and feed in that order. As flank wear is the “lower the better” type quality characteristic, from Figure 3 it can be seen that the third level of spindle speed, third level of depth cut, first level of feed and third level of diameter result in minimum value of flank wear.
Table. 6 Response Table for Signal to Noise Ratios for flank wear Smaller is better
Level Spindle speed (rpm) Depth of cut (mm) Feed (mm/rev) Diameter(mm)
1 9.554 7.345 11.622 10.494
2 10.704 10.636 10.039 9.634
3 11.427 13.703 10.023 11.555
Delta 1.873 6.359 1.599 1.921
Rank 3 1 4 2
8. Conclusions
In the present investigation, analysis of cutting parameters influence on surface roughness and flank wear of tool in CNC turning of mild steel have been successfully studied by Taguchi. By the experimental and the analytical results, the following conclusions were drawn.
1) The optimum conditions for smaller surface roughness are spindle speed at 800 rpm, depth of cut at 0.4mm, feed at 0.1 and diameter at 30mm.
2) The optimal machining condition for flank wear in tool was 800 rpm spindle speed, 0.6mm depth of cut, 0.1 mm/rev feed and 50mm diameter.
Acknowledgment
This work is supported by the Indo-Danish Tool Room of Jamshedpur, India. The author would like to extend his gratitude for the support and technical assistance rendered by Mr. Jyoti Razak and Mr. R.D. Gupta in machining.
References
[1] Arunachalam RM (2007) Wear of mixed alumina ceramic tools inhigh speed facing of Inconel 718. Int J Mach Mach Mater 2,3/
4:433–450.
[2] Alakesh Manna, Bijay Bhattacharyya Taguchi method based optimization of cutting tool flank wear during turning of PR-Al/20vol.% SiC-MMC. Int. Journal of Machining and Machinability of Materials 4 488 - 499 (2006).
[3] Aslan E., at al. (2007). Design of optimization of cutting parameters when turning hardened AISI 4140 steel (63 HRC) with Al2O3+TiCN mixed ceramic tool, Materials and Design, Vol.28, pp.1618-1622.
[4] Chauhan pinkey et al “optimizing cnc turning process using real coded genetic algorithm and differential evolution” ISSN: 2229-8711 Online Publication, June 2011 GA-O31/GJTO
[5] Dhar NR, Islam S, Md K, Paul S (2006) Wear behavior of uncoated carbide inserts under dry, wet and cryogenic cooling conditions in
turning C-60 steel. J Brazil Soc Mech Sci Eng XXVIII(2):146–152
[6] Hascalik, A. & Caydas, U (2007). Optimization of turning parameters for surface roughness and tool life based on the Taguchi method. Int. J. Adv. Manuf. Tech, pp.1147-1154
[7] J.S.Senthilkumaar, et al “Selection of machining parameters based on the analysis of surface roughness and flank wear in finish turning and facing of inconel 718 using taguchi technique”. Emirates Journal for Engineering Research, 15 (2), 7-14 (2010).
[8] J. S. Senthilkumaar, et al, Intelligent optimization and selection of machining parameters in finish turning and facing of Inconel 718,
Int JAdv Manuf Technol DOI 10.1007/s00170-011-3455-7(2011).
[9] Taguchi method, International Journal of Advanced Manufacturing Technology 24 (2004) 190-198
[10] Wang J, Kuriyagawa T, Wei XP, Gou GM (2002) Optimization of cutting conditions using a deterministic approach. Int J Machine
Tool Manuf 42:1023–1033