1
Gene expression profiling identifies distinct molecular subgroups of
leiomyosarcoma with clinical relevance
Yin-Fai Lee1,2, Toby Roe1, D Chas Mangham3, Cyril Fisher4, Robert J Grimer3, Ian Judson1,4
1Institute of Cancer Research, 15 Cotswold Road, Belmont, Sutton, London SM2 5NG, UK
2Department of Pharmacology and Pharmacy, The University of Hong Kong, Hong Kong
3Department of Pathology, The Royal Orthopaedic Hospital NHS Trust, Birmingham B31 2AP, UK
4Sarcoma Unit, The Royal Marsden Hospital NHS Trust, Fulham Road, London SW3 6JJ, UK
Running title: Gene profiling identifies leiomyosarcoma subgroups
Correspondence to: Dr Yin-Fai Lee ([email protected])
2
Key words: leiomyosarcoma, microarray, gene expression, molecular classification, clustering, soft tissue sarcoma
Competing interests statement
3
ABSTRACT
Background
Soft tissue sarcomas are heterogeneous and a major complication in
their management is that the existing classification scheme is not definitive
and is still evolving. Leiomyosarcomas, a major histologic category of soft
tissue sarcomas, are malignant tumours displaying smooth muscle
differentiation. Although defined as a single group, they exhibit a wide range
of clinical behaviour. We aimed to carry out molecular classification to identify
new molecular subgroups with clinical relevance.
Methods
We used gene expression profiling on twenty extra-uterine
leiomyosarcomas and cross-study analyses for molecular classification of
leiomyosarcomas. Clinical significance of the subgroupings was investigated.
Results
We have identified two distinct molecular subgroups of
leiomyosarcomas. One group was characterised by high expression of 26
genes which included many genes from the sub-classification gene cluster
proposed by Nielsen et al. These sub-classification genes include genes that
have importance structurally as well as in cell signalling. Notably, we found a
statistically significant association of the subgroupings with tumour grade.
Further refinement led to a group of 15 genes that could recapitulate the
tumour subgroupings in our dataset and in a second independent sarcoma
set. Remarkably, cross-study analyses suggested that these molecular
subgroups could be found in four independent datasets, providing strong
4
Conclusions
Our study strongly supported the existence of distinct leiomyosarcoma
molecular subgroups, which have clinical association with tumour grade. Our
findings will aid in advancing the classification of leiomyosarcomas and lead
5
INTRODUCTION
Adult soft tissue sarcomas are malignant tumours that occur in
connective tissues throughout the body, other than the bone or cartilage
(Goldblum et al, 2014). Major histologic categories of soft tissue sarcomas
include leiomyosarcoma (smooth muscle differentiation), liposarcoma (fatty
differentiation), rhabdomyosarcoma (striated muscle differentiation), synovial
sarcoma and undifferentiated pleomorphic sarcoma. These tumours are
heterogeneous and a major complication in the management of this disease is
that the existing classification scheme is not definitive and is still evolving.
Leiomyosarcomas are malignant tumours with smooth muscle differentiation
that are defined as a single group based on morphology and
immunohistochemical examination, while exhibiting a wide range of clinical
behaviour that correlates to some extent with histological grade (Goldblum et
al, 2014). Gastrointestinal stromal tumour (GIST) was historically classified as gastrointestinal leiomyosarcoma prior to the identification of activating
mutations in KIT by Hirota et al. (1998) and the immunohistochemical
association with interstitial cells of Cajal by Kindblom and others (Kindblom et
al, 1998) in the late 1990’s. Advances in molecular understanding and techniques clearly distinguished GIST from leiomyosarcoma, and with the
advent of imatinib therapy this became a paradigm for the molecularly
targeted treatment of cancer (Bauer & Joensuu, 2015; Nishida et al, 2015;
Verweij et al, 2004). This clearly illustrates the importance of improving the
classification of sarcomas and the beneficial effect this can have on disease
management and patient outcome. With further advances in modern
6
classify the tumours into subgroups, which may eventually lead to improved
management of the disease. To this end, we have used microarray gene
expression profiling to study the expression pattern of leiomyosarcomas with
the aim of improving its molecular classification and identifying new molecular
subgroups that may be of clinical relevance. We have focused on
leiomyosarcomas of extra-uterine origin in this study as uterine
leiomyosarcoma represents a relatively distinct clinical entity and can be
easily identified from its site of origin (Amant et al, 2009; Linch et al, 2014).
Our findings provide important support to the initial findings of Nielsen et al.
(2002) in an independent sarcoma set.
Nielsen et al. (2002) used microarrays to molecularly characterise 41 soft tissue tumours which included some leiomyosarcomas and GISTs as well
as tumours of other histologic categories. They noted a distinct gene
expression pattern of the GISTs that was distinct from the leiomyosarcomas.
11 leiomyosarcomas were included in their study, and they found initial
evidence of separation of leiomyosarcomas into two subgroups, one group
characterised by the high expression of a group of 24 gene representing 20
distinct genes which included the gene for calponin and other genes
implicated in muscle structure and function. Recently, coinciding with our
investigations, other studies also suggested the existence of subtypes of
leiomyosarcoma (Beck et al, 2010; Guo et al, 2015). In this study we further
investigated the molecular classification of leiomyosarcomas and the clinical
relevance of the new classification.
7
Microarray procedures
Leiomyosarcoma is a relatively rare form of cancer. Sarcoma tissue
samples used in this study were collected from patients undergoing surgery at
two hospitals (the Royal Marsden NHS Foundation Trust, London and the
Royal Orthopaedic Hospital NHS Foundation Trust, Birmingham) that treat
significant numbers of sarcoma patients in the UK over the period of 1987 to
2001. Diagnoses were performed by experienced sarcoma pathologists using
conventional criteria, including immunohistochemistry and electron
microscopy, if appropriate. This study was conducted with the approval of our
local Research Ethics Committee. Clinicopathologic descriptions of the cases
are shown in Supplementary Table S2. (Summary patient characteristics:
median age = 61 years; sex (M = 58%, F = 42%); location (extremity = 58%,
non-extremity (thoracic/abdominal/retroperitoneal sites) = 42%); tumour size
(5 cm or less in greatest dimension = 21%, more than 5 cm in greatest
dimension = 79%).) The tumour samples were snap-frozen in liquid nitrogen
and stored at –80ºC until RNA extraction. Tumour and control RNA
preparation were performed as in Lee et al. (2003), except that HB4a was not
included in the control RNA. Microarray slides were gridded with 11622 spots
consisting of 1937 I.M.A.G.E cDNA clones (gridded six times each) acquired
from the UK Human Genome Mapping Project Resource Centre and
Research Genetics (http://www.resgen.com). The majority of the clones
included were selected at random, except for the 23 gene probes that
corresponded to 18 of the distinct genes reported by Nielsen et al. (2002) as
described below. We were unable to get hold of the clones that corresponded
8
leiomyosarcoma samples into the two subgroups. Information on the geneset
can be found at the supplementary information online (Supplementary Table
S1) (Array data to be found on Gene Expression Omnibus GSE76216). The
preparation of the microarray slides including gridding and blocking were as
described in Clark et al. (Clark et al, 2002), except that the BioRobotics
Microgrid II was used for gridding in this study. RNA labelling was performed
as in Lee et al. (2003), except that after the final wash with 400 μl 0.5x SSPE,
the sample was reduced to a volume of 4 μl.
Microarray hybridisation was performed as in Lee et al. (2003) except
the following: after the coverslip fell off, the slide was then washed with 4x
SSPE, 10 mM EDTA for 1 min at 42oC; then 50% formamide, 6x SSPE at 42oC for 15 sec with gentle rocking; then 2x SSPE, 10mM EDTA for 30 sec at room temperature; and 0.1x SSPE for 30 sec at room temperature. The slide
was then rinsed briefly with HPLC grade water and dried with canned air.
Hybridised microarray slides were scanned in a GenePix 4000B
scanner (Axon Instruments, Foster City, CA) as described before (Lee et al,
2004) and slides were scanned at PMT (photomultiplier tube) voltage levels
that provided a Cy5:Cy3 hybridisation ratio across the slide of roughly 1.
Analysis of microarray data
Data processing and analyses were performed with the GenePix Pro
software (Axon Instruments, Foster City, CA) and the GeneSpring software
(Silicon Genetics, Redwood City, CA). Background determination and
flagging were performed as described before (Lee et al, 2004). Further
9
intensity in the control channel being less than 1.4 times the local background
of that channel. Ratios of fluorescent intensities (Cy5:Cy3) for individual
cDNA were then determined after subtraction of background as described
before (Lee et al, 2004) except that the average fluorescent intensity ratios of
replicate spots were used. These ratios were then normalised by making the
median of all measurements in each sample to be 1. The resulting ratios
were further normalised so that the median of all measurements taken for a
particular gene is 1. To obtain genes that showed variation in expression
among the tumours, a subset of genes that had normalised expression ratios
of above 2 in at least 5 of the samples or below 0.5 in at least 5 of the
samples were selected. Hierarchical clustering was then applied to the
log-transformed data for these genes and the tumours, using average-linkage
clustering with Pearson correlation around zero as the similarity metric. Only
genes with expression data present in half or more of the tumour samples
following quality filtering were included in the gene clustering. Clustering
analysis was also performed with the ‘leio-subclass’ genes from Nielsen et al.
(2002) present in our array, as well as gene clusters identified from our
dataset. Class comparison analysis (BRB array tools) using two sample t test
and multivariate permutations test computed based on 1000 random
permutations (confidence level of false discovery rate assessment: 80 %;
maximum allowed proportion of false-positive genes: 0.1) was carried out to
identify statistically significant genes associated with the group I and II
tumours.
Gene expression data of the 17 leiomyosarcomas reported in the study
10
(GEO) data repository. Array data normalisation and clustering analysis were
performed as described above.
Other statistical analyses including Kendall’s taub for assessing the
significance of association between tumour subgroupings and tumour grade
were performed using SPSS (SPSS Inc, Chicago, IL).
RESULTS
The expression profiles for 20 leiomyosarcomas were investigated
using cDNA microarrays. To better explore the expression differences that
may exist between the different tumours, a subset of 169 genes that showed
the most variation in expression among the tumours was used in the cluster
analysis. Hierarchical clustering using these most varied genes in this set of
tumours gave rise to two clusters of tumours (Fig. 1), one group (group I) was
characterised by higher expression of a cluster of 26 genes. Ten of these
genes were also found in the 20 distinct genes reported by Nielsen et al.
(2002). In making this array, we have mined the expression data from
Nielsen et al. (2002) and have specifically included clones that corresponded
to all except 2 of the 20 distinct genes from Nielsen et al. (2002)
(‘leio-subclass’ genes) that distinguished their leiomyosarcoma samples into the
two subgroups that they called the ‘Calponin’ subgroups (Supplementary
Table S1). This allowed us to specifically carry out clustering analysis using
the expression of these ‘leio-subclass’ genes (23 gene probes corresponding
to 18 of the distinct genes reported by Nielsen et al. (2002)). Hierarchical
clustering analysis on the tumours using these 23 ‘leio-subclass’ genes
11
group of tumours exhibiting high level of expression of these genes (called
‘Calponin-positive’ group by Nielsen et al. (2002)) (Fig. 2). Gene clustering
was also carried out for the 12 of these genes that satisfied the criteria for use
in gene clustering (Fig. 2).
We repeated tumour clustering analysis using only the cluster of 26
genes that defined the groupings in the ‘most varied genes’ analysis (Fig. 3),
and the result showed two distinct clusters of tumours, with a well-defined
cluster of 8 tumours (group I) that matched exactly with the tumours identified
to be ‘Calponin-positive’ using the ‘leio-subclass’ genes.
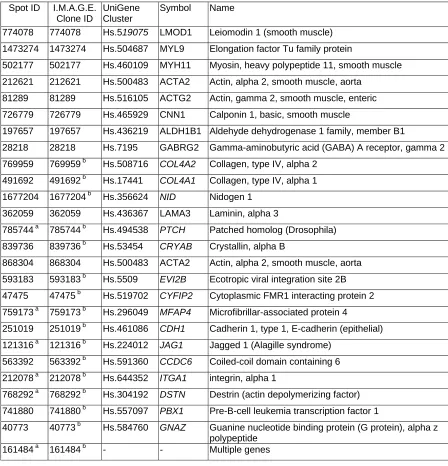
The group I tumours were defined by the high expression of this cluster
of 26 genes (Table 1). We noted that 10 of the ‘leio-subclass’ genes were
present in the most varied genes (169 genes), and remarkably, all 10 of these
10 ‘leio-subclass’ genes were found in this cluster of 26 genes. The 16
additional genes that were new to the ‘leio-subclass’ gene cluster were also
shown in Table 1, and included a number of genes that have structural
importance for plasma membrane (EVI2B), basement membrane (COL4A2;
COL4A1; NID1) and in extracellular matrix (MFAP4); cell adhesion (CDH1; ITGA1); as well as genes that have important functions like cell signalling (JAG1 involved in Notch signalling; GNAZ in transmembrane signalling;
PTCH1 in hedgehog and other signalling).
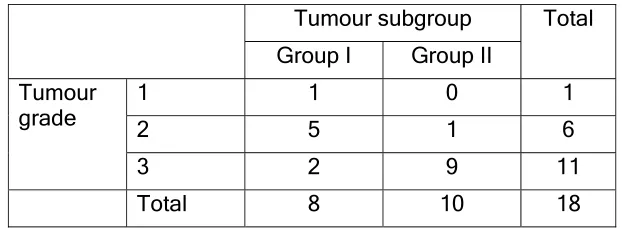
We then looked into the clinical relevance of these subgroups of
tumours. Analysis of relevant clinical data showed a statistically significant
association of the subgroupings with tumour grade (Kendall’s taub 0.650,
P<0.01) (Table 2). Group I was found to be associated with lower tumour
12
cluster grouping with other clinical parameters (tumour size (≤5 cm or >5cm),
site (superficial or deep), location (extremity or non-extremity), stage (I to IV)
or tumour status (primary, local recurrence or metastasis)) (Supplementary
Table S2).
We noted that a cluster of 15 genes were best associated with the
subgroupings of tumours and may allow us to further refine the genelist, so
these were tested to see if they could recapitulate the subgroupings of
tumours (Table 1). We performed clustering analysis with this group of 15
genes and found that the tumours were clustered in the same two groups as
with the use of the larger gene clusters; one group was defined by the high
expression of these genes (Supplementary Fig. S1). We further validated the
use of this group of 15 genes in an independent sarcoma set that has not
been used for identifying subgroups. We downloaded and analysed the gene
expression data of the 17 leiomyosarcomas in the sarcoma study by Baird et
al. (2005). 13 of the genes in their dataset were mapped to genes found in our group of 15 genes and clustering analysis was performed accordingly.
We found that these genes also defined a subgroup of tumours (ten) that had
high expression of these genes.
There was also interest in identifying potential targets for therapy
associated with the two subgroups, particularly as they were found to be
clinically relevant. Class comparison analysis using two sample t test and
multivariate permutations test was performed to identify statistically significant
genes associated with our two subgroups. The statistically significant genes
were compared with the genes from the TARGET V3 database (Allen et al,
13
therapeutic, prognostic, and diagnostic implications for cancer patients, and
are of particular interest in translational oncology. Our comparison showed
that two of the genes (CDH1 and PDGFRA) in our gene list are found in these
TARGET genes and may be potential subgroup-specific targets. The high
expression of CDH1 is associated with group I tumours. This gene has been
reported to be of diagnostic value and is frequently mutated in lobular breast
carcinoma and in certain hereditary cancer syndromes, including a type of
gastric cancer (Allen et al, 2014). The high expression of PDGFRA is
associated with group II tumours, and is associated with sensitivity to tyrosine
kinase inhibitors (Allen et al, 2014).
DISCUSSION
Gene expression profiling has become an increasingly important aid in
the molecular diagnosis and classification of human malignancies, including
soft tissue sarcomas (Alizadeh et al, 2000; Bittner et al, 2000; Elias et al,
2015; Francis et al, 2007; Golub et al, 1999; Lee et al, 2003; Nielsen et al,
2002; Perou et al, 2000; Tschoep et al, 2007). Although the existing
classification permits soft tissue tumours to be distinguished from one
another, there is still much room for improvement in the classification scheme.
Identification of new molecular subtypes will aid in the management of the
disease, which was well illustrated by the introduction of the diagnostic
category GIST and the development of new targeted therapies specific to this
class of tumours which have revolutionised its treatment (Nishida et al, 2015).
In this study, we have attempted to identify molecular subtypes of
14
the subgroupings proposed by Nielsen et al. (2002). We have focused on
leiomyosarcomas of extra-uterine origins as uterine leiomyosarcoma
represents a relatively distinct clinical entity and can be easily identified from
its site of origin (Amant et al, 2009; Linch et al, 2014). When clustering
analysis was performed in our tumour set using the ‘leio-subclass’ genes
reported by Nielsen et al. (2002), we similarly found two subgroups of
leiomyosarcomas. Additionally, tumour clustering using a set of most varied
genes (169 genes) in our dataset also gave rise to two groups of tumours that
very much matched the tumour groupings using the 18 ‘leio-subclass’ gene
set. These groups of tumours were defined by the high expression of a
cluster of 26 genes (Table 1). 16 additional genes were new to the
‘leio-subclass’ gene cluster and it is interesting to note that a number of these
genes have structural importance just like genes reported in Nielsen et al.
(2002) being implicated in muscle structure and function which included
Calponin, laminin, actin, and leiomodin. Also included in these 16 additional
genes was the gene for D10S170 DNA fragment (clone 563392, now called
CCDC6 coiled-coil domain containing 6), which was present immediately next
to the ‘leio-subclass’ genes in the gene dendrogram from Nielsen et al. (2002)
and also showed similar expression pattern to these genes. Though its gene
function is still largely unknown, it has been suggested to have tumour
suppressor function. It is worth noting that COL4A1 and COL4A2 are two
closely related genes located on the same chromosome. COL4A2 gene is
organised in a head-to-head conformation with the other type IV collagen
15
supported the reliability of the microarray data as both genes were picked up
and were clustered next to each other in clustering analysis.
The tumour groupings using the most varied genes largely matched
with the groupings using the ‘leio-subclass’ genes, but there was a small
difference in the groupings that could have arisen from the noise in the data.
We might have included many genes in the clustering using the most varied
genes that are not relevant to the ‘Calponin’ groupings. So clustering analysis
was performed using the cluster of 26 genes that defined the tumour
subgroups, and we obtained two groups that matched exactly with the two
groups from clustering using the ‘leio-subclass’ genes.
Nielsen et al. (2002) reported that too few cases were available to allow for meaningful comparison based on histological findings between the
two groups. And within the limit of their study, clinical features, such as
tumour location, did not account for the separation of the leiomyosarcomas
into the two subgroups. They did not comment directly on other clinical
associations apart from tumour location. We have investigated possible
association with various clinical parameters, and we have found a statistically
significant association of the subgrouping of leiomyosarcomas with tumour
grade. The histological grading of soft tissue sarcomas is determined by an
assessment of various factors including differentiation (pleomorphism of
tumour cells), mitotic activity, degree of cellularity, matrix formation, and
amount of necrosis (Oliveira & Nascimento, 2001; Trojani et al, 1984). It is
considered an important prognostic factor for adult soft tissue sarcomas and
has been used in guiding patient management (Oliveira & Nascimento, 2001).
16
achieve (Oliveira & Nascimento, 2001). Genes identified from these gene
expression studies may aid in achieving better tumour grading, and may be
particularly useful in difficult cases.
We have further refined the genelist to a group of 15 genes that could
recapitulate the tumour subgroupings in our dataset, and have validated this
genelist in an independent sarcoma set from Baird et al. (2005) where we also
found a subgroup of tumours defined by this group of genes. Unfortunately,
associated clinical data were not available and one could not assess the
association of tumour subgrouping with tumour grade in this dataset.
Guo et al. have recently used gene expression profiling to identify three
molecular subtypes of leiomyosarcoma using formalin-fixed,
paraffin-embedded tumour samples (Guo et al, 2015) following their earlier study
(Beck et al, 2010): subtype I was the subgroup that was relatively well defined
molecularly and had higher expression of genes enriched for processes that
included muscle contraction, muscle system processes, and cytoskeleton
organisation. Subtype II had less muscle-specific gene expression than
subtype I. Guo et al. have proposed the use of LMOD1 (replacing CASQ2
proposed in their earlier study) together with the proteins ACTG2, SLMAP,
MYLK, CFL2 to be the panel of subtype I immunohistochemical biomarkers.
They have also proposed the use of ARL4C to be the subtype II biomarker.
They have not proposed any immunohistochemical markers for subtype III.
Subtype III appeared to be less well-defined molecularly and when they
attempted to investigate if they could find these three subtypes in another
publicly available gene expression dataset, they noted that their subtypes I
17
However, they noted from related clinical information that clinically subtype III
tumours were mostly of uterine origin (92% in their own tumour set) and
uterine leiomysarcoma was significantly associated with subtype III. In our
study, we have found two distinct molecular subgroups of leiomyosarcomas.
As we did not include tumours of uterine origin in our study, it is expected that
we would not find a subgroup that corresponded to their subtype III. Our
group I was defined by a cluster of 26 genes (Table 1) which included many
genes implicated in muscle structure and function. We noted that LMOD1
and ACTG2 from the panel of 5 genes whose encoded proteins they proposed to be used as immunohistochemical markers for subtype I were also
found in our 26 group I defining genelist. In fact, further investigation showed
that the majority of the genes in our group I defining genelist were ranked
highly in their list of genes that had a higher expression in subtype I versus
other subtypes including LMOD1, MYL9, MYH11, ACTA2, ACTG2, CNN1,
ALDH1B1, COL4A2, COL4A1, CRYAB, CYFIP2, MFAP4, CDH1, JAG1, DSTN and GNAZ. They have proposed the use of ARL4C as immunohistochemical marker for subtype II, but this gene was not included in
our array. On the other hand, a cluster of 4 genes that correlated with and
had higher expression in our group II (GJA1, COL5A2, THBS2, MFAP2) were
also found to be highly ranked in their list of significant genes that had a
higher expression in subtype II versus other subtypes. In fact, the first three
of these genes were ranked higher (more significantly associated with
subtype II) than the ARL4C whose protein they had chosen to be the
immunohistochemical marker for subtype II in their study. It is perhaps worth
18
use in classifying tumours as subtype II or not using immunohistochemistry
had quite a significant error rate (31% of their tumour samples were
misclassified into a different subtype than the original classification based on
gene expression profiles), so perhaps a combination of markers would help to
improve the accuracy of an immunohistochemical classification. Class
comparison analysis was also performed to identify statistically significant
genes associated with our two subgroups, we got similar genes to the clusters
of group-defining genes mentioned above that also corresponded to their
significant genes for subtype I and II respectively. On the whole, our findings
suggested that our group I corresponded to their subtype I; and our group II
corresponded to their subtype II; providing further support to the existence of
these two molecular subgroups (in a UK dataset). Though they have found
that low-grade tumours were more frequent in their subtype I, this did not
reach statistical significance in their dataset; whereas in our dataset, we have
found a statistically significant association of the subgroups with tumour
grade, with group I being associated with lower grade.
Chibon et al (2010) has reported on identifying a gene expression
signature, which they have called CINSARC – Complexity INdex in
SARComa, that was found to be associated with metastatic outcome in a
mixture of different soft tissue sarcomas. The CINSARC gene set is
composed of 67 genes related to mitosis and chromosomal stability. We have
compared the CINSARC genes with the statistically significant genes
associated with our two subgroups and found no overlap in these genes. It is
perhaps not too surprising as although the authors found that the CINSARC
19
the authors had also done a survival analysis in their validation set of
leiomysarcomas and reported that they could not find a statistically significant
difference in metastasis-free survival in their two subgroups (Chibon et al,
2010).
To conclude, we have identified two molecular subgroups of
leiomyosarcomas, one group being characterised by the high level of
expression of a cluster of 26 genes that included many genes in the
‘leio-subclass’ genes, and provided confirmation of the findings of Nielsen et al.
(2002) in an independent sarcoma set. We have also identified additional
genes to the original ‘leio-subclass’ gene cluster that contributed to
sub-classification of leiomyosarcoma. We have also investigated the clinical
significance of the groupings and found an association with tumour grade.
We have further refined our genelist to a group of 15 genes that could
recapitulate the tumour subgroupings in our dataset, and have validated this
in an independent sarcoma set from Baird et al. (2005). Further comparison
with a recently published dataset suggested that our findings also matched
with two molecular subgroups in their dataset (Guo et al, 2015). Cross-study
comparisons and analyses of expression datasets were renowned for often
giving rise to discrepant or completely different results. Quite remarkably, our
findings suggested that the two distinct molecular subgroups identified here
could be found across four independent datasets, providing strong support for
their existence. Our findings will aid in achieving a better classification of
leiomyosarcomas and eventually lead to better management of the disease
20
ACKNOWLEDGEMENTS
We would like to acknowledge the support of Alexander Boag Sarcoma Fund.
We acknowledge CS Cooper, S Edwards and J Clark for their support in this
study.
REFERENCES
Alizadeh AA, Eisen MB, Davis RE, Ma C, Lossos IS, Rosenwald A, Boldrick JC, Sabet H, Tran T, Yu X, Powell JI, Yang L, Marti GE, Moore T, Hudson J, Jr., Lu L, Lewis DB, Tibshirani R, Sherlock G, Chan WC, Greiner TC,
Weisenburger DD, Armitage JO, Warnke R, Staudt LM, et al. (2000) Distinct types of diffuse large B-cell lymphoma identified by gene expression profiling. Nature 403(6769): 503-11
Allen EMV, Wagle N, Stojanov P, Perrin DL, Cibulskis K, Marlow S, Jane-Valbuena J, Friedrich DC, Kryukov G, Carter SL, McKenna A, Sivachenko A, Rosenberg M, Kiezun A, Voet D, Lawrence M, Lichtenstein LT, Gentry JG, Huang FW, Fostel J, Farlow D, Barbie D, Gandhi L, Lander ES, Gray SW, Joffe S, Janne P, Garber J, MacConaill L, Lindeman N, Rollins B, Kantoff P, Fisher SA, Gabriel S, Getz G, Garraway LA (2014) Whole-exome sequencing and clinical interpretation of FFPE tumor samples to guide precision cancer medicine. Nature medicine 20(6): 682-688
Amant F, Coosemans A, Debiec-Rychter M, Timmerman D, Vergote I (2009) Clinical management of uterine sarcomas. The Lancet Oncology 10(12): 1188-98
Baird K, Davis S, Antonescu CR, Harper UL, Walker RL, Chen Y, Glatfelter AA, Duray PH, Meltzer PS (2005) Gene expression profiling of human sarcomas: insights into sarcoma biology. Cancer Res 65(20): 9226-35
21
Beck AH, Lee CH, Witten DM, Gleason BC, Edris B, Espinosa I, Zhu S, Li R, Montgomery KD, Marinelli RJ, Tibshirani R, Hastie T, Jablons DM, Rubin BP, Fletcher CD, West RB, van de Rijn M (2010) Discovery of molecular subtypes in leiomyosarcoma through integrative molecular profiling. Oncogene 29(6): 845-54
Bittner M, Meltzer P, Chen Y, Jiang Y, Seftor E, Hendrix M, Radmacher M, Simon R, Yakhini Z, Ben-Dor A, Sampas N, Dougherty E, Wang E, Marincola F, Gooden C, Lueders J, Glatfelter A, Pollock P, Carpten J, Gillanders E, Leja D, Dietrich K, Beaudry C, Berens M, Alberts D, Sondak V (2000) Molecular classification of cutaneous malignant melanoma by gene expression profiling. Nature 406(6795): 536-40
Chibon F, Lagarde P, Salas S, Perot G, Brouste V, Tirode F, Lucchesi C, de Reynies A, Kauffmann A, Bui B, Terrier P, Bonvalot S, Le Cesne A, Vince-Ranchere D, Blay JY, Collin F, Guillou L, Leroux A, Coindre JM, Aurias A (2010) Validated prediction of clinical outcome in sarcomas and multiple types of cancer on the basis of a gene expression signature related to genome complexity. Nat Med 16(7): 781-7
Clark J, Edwards S, John M, Flohr P, Gordon T, Maillard K, Giddings I, Brown C, Bagherzadeh A, Campbell C, Shipley J, Wooster R, Cooper CS (2002) Identification of amplified and expressed genes in breast cancer by comparative hybridization onto microarrays of randomly selected cDNA clones. Genes Chromosomes Cancer 34(1): 104-14
Elias D, Vever H, Laenkholm AV, Gjerstorff MF, Yde CW, Lykkesfeldt AE, Ditzel HJ (2015) Gene expression profiling identifies FYN as an important molecule in tamoxifen resistance and a predictor of early recurrence in patients treated with endocrine therapy. Oncogene 34(15): 1919-27
Francis P, Namlos HM, Muller C, Eden P, Fernebro J, Berner JM,
Bjerkehagen B, Akerman M, Bendahl PO, Isinger A, Rydholm A, Myklebost O, Nilbert M (2007) Diagnostic and prognostic gene expression signatures in 177 soft tissue sarcomas: hypoxia-induced transcription profile signifies metastatic potential. BMC genomics 8: 73
22
Golub TR, Slonim DK, Tamayo P, Huard C, Gaasenbeek M, Mesirov JP, Coller H, Loh ML, Downing JR, Caligiuri MA, Bloomfield CD, Lander ES (1999) Molecular classification of cancer: class discovery and class prediction by gene expression monitoring. Science 286(5439): 531-7
Guo X, Jo VY, Mills AM, Zhu SX, Lee CH, Espinosa I, Nucci MR, Varma S, Forgo E, Hastie T, Anderson S, Ganjoo K, Beck AH, West RB, Fletcher CD, van de Rijn M (2015) Clinically Relevant Molecular Subtypes in
Leiomyosarcoma. Clin Cancer Res 21(15): 3501-11
Hirota S, Isozaki K, Moriyama Y, Hashimoto K, Nishida T, Ishiguro S, Kawano K, Hanada M, Kurata A, Takeda M, Muhammad Tunio G, Matsuzawa Y, Kanakura Y, Shinomura Y, Kitamura Y (1998) Gain-of-function mutations of c-kit in human gastrointestinal stromal tumors. Science 279(5350): 577-80
Kindblom LG, Remotti HE, Aldenborg F, Meis-Kindblom JM (1998) Gastrointestinal pacemaker cell tumor (GIPACT): gastrointestinal stromal tumors show phenotypic characteristics of the interstitial cells of Cajal. The American journal of pathology 152(5): 1259-69
Lee YF, John M, Edwards S, Clark J, Flohr P, Maillard K, Edema M, Baker L, Mangham DC, Grimer R, Wooster R, Thomas JM, Fisher C, Judson I, Cooper CS (2003) Molecular classification of synovial sarcomas, leiomyosarcomas and malignant fibrous histiocytomas by gene expression profiling. Br J Cancer 88(4): 510-5
Lee YF, John M, Falconer A, Edwards S, Clark J, Flohr P, Roe T, Wang R, Shipley J, Grimer R, Mangham DC, Thomas JM, Fisher C, Judson I, Cooper CS (2004) A gene expression signature associated with metastatic outcome in human leiomyosarcomas. Cancer Res 64: 7201-4
Linch M, Miah AB, Thway K, Judson IR, Benson C (2014) Systemic treatment of soft-tissue sarcoma-gold standard and novel therapies. Nature reviews Clinical oncology 11(4): 187-202
23
(2002) Molecular characterisation of soft tissue tumours: a gene expression study. Lancet 359(9314): 1301-7
Nishida T, Blay JY, Hirota S, Kitagawa Y, Kang YK (2015) The standard diagnosis, treatment, and follow-up of gastrointestinal stromal tumors based on guidelines. Gastric cancer : official journal of the International Gastric Cancer Association and the Japanese Gastric Cancer Association
Oliveira AM, Nascimento AG (2001) Grading in soft tissue tumors: principles and problems. Skeletal radiology 30(10): 543-59
Perou CM, Sorlie T, Eisen MB, van de Rijn M, Jeffrey SS, Rees CA, Pollack JR, Ross DT, Johnsen H, Akslen LA, Fluge O, Pergamenschikov A, Williams C, Zhu SX, Lonning PE, Borresen-Dale AL, Brown PO, Botstein D (2000) Molecular portraits of human breast tumours. Nature 406(6797): 747-52
Trojani M, Contesso G, Coindre JM, Rouesse J, Bui NB, de Mascarel A, Goussot JF, David M, Bonichon F, Lagarde C (1984) Soft-tissue sarcomas of adults; study of pathological prognostic variables and definition of a
histopathological grading system. International journal of cancer Journal international du cancer 33(1): 37-42
Tschoep K, Kohlmann A, Schlemmer M, Haferlach T, Issels RD (2007) Gene expression profiling in sarcomas. Critical reviews in oncology/hematology 63(2): 111-24
Figure legends
Fig. 1 Two-dimensional cluster analysis of leiomyosarcomas (horizontal) and most varied genes (vertical). Each column corresponds to a tumour, and
each row corresponds to a gene. Red indicates overexpression, while green
indicates underexpression. Grey indicates missing or excluded data. Asterisk
indicates the tumour belongs to group I in clustering analysis of fig. 2.
Fig. 2 Hierarchical clustering analyses of leiomyosarcomas (vertical) and the ‘leio-subclass’ genes in our array (horizontal). Each row corresponds to a
tumour, and each column corresponds to a gene. Red indicates
overexpression, while green indicates underexpression. Grey indicates
missing or excluded data. Asterisk indicates the tumour belongs to group I in
this clustering analysis.
Fig. 3 Hierarchical clustering analyses of leiomyosarcomas (vertical) and the 26 genes (horizontal). Each row corresponds to a tumour, and each column
corresponds to a gene. Red indicates overexpression, while green indicates
underexpression. Grey indicates missing or excluded data. Asterisk indicates
Table 1 List of genes in the cluster of 26 genes that defined the leiomyosarcoma subgrouping
Spot ID I.M.A.G.E. Clone ID
UniGene Cluster
Symbol Name
774078 774078 Hs.519075 LMOD1 Leiomodin 1 (smooth muscle)
1473274 1473274 Hs.504687 MYL9 Elongation factor Tu family protein
502177 502177 Hs.460109 MYH11 Myosin, heavy polypeptide 11, smooth muscle
212621 212621 Hs.500483 ACTA2 Actin, alpha 2, smooth muscle, aorta
81289 81289 Hs.516105 ACTG2 Actin, gamma 2, smooth muscle, enteric
726779 726779 Hs.465929 CNN1 Calponin 1, basic, smooth muscle
197657 197657 Hs.436219 ALDH1B1 Aldehyde dehydrogenase 1 family, member B1
28218 28218 Hs.7195 GABRG2 Gamma-aminobutyric acid (GABA) A receptor, gamma 2
769959 769959 b Hs.508716 COL4A2 Collagen, type IV, alpha 2
491692 491692 b Hs.17441 COL4A1 Collagen, type IV, alpha 1
1677204 1677204 b Hs.356624 NID Nidogen 1
362059 362059 Hs.436367 LAMA3 Laminin, alpha 3
785744 a 785744 b Hs.494538 PTCH Patched homolog (Drosophila)
839736 839736 b Hs.53454 CRYAB Crystallin, alpha B
868304 868304 Hs.500483 ACTA2 Actin, alpha 2, smooth muscle, aorta
593183 593183 b Hs.5509 EVI2B Ecotropic viral integration site 2B
47475 47475 b Hs.519702 CYFIP2 Cytoplasmic FMR1 interacting protein 2
759173 a 759173 b Hs.296049 MFAP4 Microfibrillar-associated protein 4
251019 251019 b Hs.461086 CDH1 Cadherin 1, type 1, E-cadherin (epithelial)
121316 a 121316 b Hs.224012 JAG1 Jagged 1 (Alagille syndrome)
563392 563392 b Hs.591360 CCDC6 Coiled-coil domain containing 6
212078 a 212078 b Hs.644352 ITGA1 integrin, alpha 1
768292 a 768292 b Hs.304192 DSTN Destrin (actin depolymerizing factor)
741880 741880 b Hs.557097 PBX1 Pre-B-cell leukemia transcription factor 1
40773 40773 b Hs.584760 GNAZ Guanine nucleotide binding protein (G protein), alpha z polypeptide
161484 a 161484 b - - Multiple genes
a
Clones that were found by DNA sequencing to have a sequence different from the one originally associated with the I.M.A.G.E. clone ID during sequence confirmation of the genes.
b
Genes that were new to the ‘leio-subclass’ genes.
Table 2
Distribution of tumour grade versus tumour subgroup
Tumour subgroup Total
Group I Group II Tumour
grade 12 15 0 1 16
3 2 9 11