Variable Compression Ratio Diesel Engine Performance
Analysis
K.Satyanarayana*1, Vinodh Kumar Padala1, T.V.Hanumantha Rao1, S.V.Umamaheswararao2
Department of Mechanical Engineering, Anil Neerukonda Institute of Technology And Sciences,
Sangivalasa, Visakhapatnam, Andhra Pradesh, India.‐531162
Department of Marine Engineering, Andhra University, Visakhapatnam, India--531006
ABSTRACT:-Variable Compression Ratio (V.C.R)
engine test rig can be used to determine the effect of Compression Ratio (C.R) on the performance and emissions of the engine. The combustion phenomena, when provided with a pressure transducer. The performance frequency parameters like efficiencies, power adopted, and specific fuel consumption are determined. Further, combustion phenomenon is also observed through this work, we can find the optimum compression ratio for which the best performance is possible. In order to find out optimum compression ratio, experiments were carried out on a single cylinder four stroke variable compression ratio diesel engine. Tests were carried out at compression ratios of 16.5, 17.0, 17.5, 18.0 and 19.0 at different loads the performance characteristics of engine like Brake power (BP), Brake Thermal Efficiency (BTE), Brake Specific Fuel Consumption (BSFC). Results show a significant improved performance at a compression ratio 19.0. The compression ratios lesser than 19.0 showed a drop in break thermal efficiency, rise in fuel consumption.
Keywords: Diesel engine, variable compression ratio,
performance, smokes density.
1. INTRODUCTION
Worldwide pressure to reduce automotive fuel consumption and CO2 emissions is leading to the introduction of various new technologies for the C.I engine as it fights for market share with the petrol. So far, variable compression ratio (VCR) engines have not reached the market, despite patents and experiments dating back over decades. VCR technology could provide the key to enable exceptional efficiency at light loads without loss of full load performance. This paper will review the many embodiments of VCR, the implications for volume manufacture and the strategy for VCR implementation in order to produce the maximum benefit.
2. LITERATURE REVIEW:
.The ever increasing demand for the petroleum based fuels and their scare availability has lead to extensive research on Diesel fuelled engines. A better design of the engine can significantly improve the combustion quality and in turn will lead to better brake thermal efficiencies and hence savings in
experimentation is presented analyzed in this paper.To find out the Optimum Compression Ratio of the Computerized Variable Compression Ratio (VCR) Single Cylinder Four Stroke Diesel Engine using Experimentation analysis.Various parameters defining the performance of V.C.R diesel engine are calculated and they areused as means for obtaining optimum compression ratio. By plotting performance graphs of different loads and different compression ratios from that optimum compression ratio obtained.
3. EXPERIMENTAL SETUP
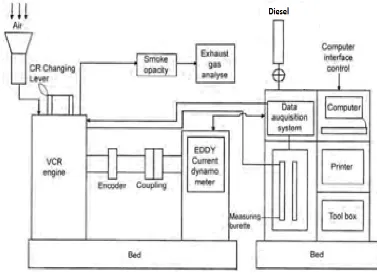
The layout of the experimental setup is shown in fig 3.1. The main components of the system are given
below. The engine, Fuel injection
pump ,Dynamometer , Device for changing starting of fuel, Supercharging system, Dynamic injection indicator , Data acquisition system , Smoke meter
Exhaust gas analyser, Pressure transducer
Figure 3.1: Block Diagram of VCR Engine
TABLEI: V.C.RENGINE (TEST RIG) SPECIFICATIONS
II.THEORETICAL CALCULATIONS
PERFORMANCE
A. Calculations:
Friction Power (FP): The link between the brake power output and indicated power output of an engine is its friction. Friction has a dominating effect on the performance of an engine. Almost invariably, the frictional losses are ultimately dissipated to cooling system (and exhaust) as they appear in the form of frictional heat and this influences the cooling capacity required. Moreover lower friction means availability of more brake power, Hence brake specific fuel consumption is lower. This fuel economy is important because it decides the speed at which an engine can be run economically. Thus the level of friction decides the maximum output of the engine which can be
obtained economically. In design and testing of an engine measurement of friction power is important for getting an insight into the methods by which the output of an engine can be increased. In the evaluation of IP and mechanical efficiency measured friction power is also used. By following methods:
Willan’s Line Method
Morse Test
Motoring Test
Difference between IP and BP
Indicated Power (IP): However while calculating the
Mechanical efficiency another factor called Indicated Power (IP) is considered. It is defined as the power developed by combustion of fuel in the combustion
S .NO. Features Specifications
1 Make Kirloskar diesel Engine
2 Type Four stroke, Water cooled
Diesel
3 No of cylinders one
4 Combustion Principle Compressionignition
5 Max speed 1500
6 Crank Radius 55mm
7 Connecting Rod length 300mm
8
Clinder diameter
80mm
9 Stroke length 110mm
10 Compression ratio variable from 14.0 to 20.0
11 Loading Eddy current dynamometer
12 Load (Max.) 23.86 N-M
chamber (IP). It is always more than brake power. It is the sum of Friction Power and Brake Power.
Indicated Mean Effective Pressure (IMEP): When
quoted as an indicated mean effective pressure or IMEP (defined below), it may be thought of as the average pressure acting on a piston during a power stroke of its cycle.
It is obtained by using the formula.
IP = (Imep) LAN
60
So, Imep = 60IP
LAN
Brake Specific Fuel Consumption (BSFC): Brake
Specific fuel consumption (BSFC) or sometimes simply Brake specific fuel consumption, BSFC, is an engineering term that is used to describe the fuel efficiency of an engine design with respect to thrust output. Brake Specific Fuel Consumption may also be thought of as fuel consumption (grams/second) per unit of thrust (kilo newtons, or kN).
It is obtained by using the formulae.
BSFC = M
BP
Indicated Specific Fuel Consumption (ISFC): Indicated Specific fuel consumption (ISFC) or sometimes simply Indicated specific fuel consumption, ISFC, is an engineering term that is used to describe the fuel efficiency of an engine design with respect to thrust output. Indicated Specific Fuel Consumption may also be thought of as fuel consumption (grams/second) per unit of thrust (kilo newtons, or KN).
It is obtained by using the formulae.
ISFC = M
IP
Brake Thermal Efficiency (BTE): Brake Thermal
Efficiency is defined as brake power of a heat engine as a function of the thermal input from the fuel. It is used to evaluate how well an engine converts the heat from a fuel to mechanical energy.
It is obtained by using the formulae
BTE = BP*3600
M* CV
Indicated Thermal Efficiency (ITE): The ratio
between the indicated power output of an engine and the rate of supply of energy in the steam or fuel.
It is obtained by the relation
ITE = IP*3600
M*CV
Mechanical Efficiency (ME): Mechanical efficiency
measures the effectiveness of a machine in transforming the energy and power that is input to the device into an output force and movement. Efficiency is measured as a ratio of the measured performance to the performance of an ideal machine:
It is given by the relation.
ME= BP
IP
B. Experiment Procedure: The Variable
Compression Ratio Engine is started by using Diesel and when the engine reaches the stable operating conditions at a constant compression ratio. Start applying under a certain Load. To cool the Engine Socket, water is applied at a rate of 40 cc/Sec and the cooling water Temperature is 26.7 degrees. The tests are conducted at a constant speed of 1500rpm.In every test all the performance parameters like Indicated Power(IP) , Indicated
Mean effective pressure, Specific fuel
Consumption(SFC), Brake Thermal Efficiency,
Indicated Thermal Efficiency, Mechanical
Efficiency are determined at different
Compression ratios of 16.5, 17, 17.5, 18, 18.5, 19.
V.RESULTS AND DISCUSSIONS
Test was carried out at compression ratios of 16.5 at different loads or torque like
17, 18, 19, 20, 21 N-m and The performance characteristics of engine like Brake power (BP), Fuel flow rate is noted and from graphs fuel consumption (Kg/Hr) vs. B.P (KW) at a constant Speed is plotted and the graph is extrapolated back to zero fuel consumption as shown in figure (a) the point where this graphs cuts the B.P (KW) axis in an indication of the friction power of the engine at that speed.
From Friction Power, Brake Power. We calculate the remaining performance Characteristics like Indicated Power(IP) , Indicated Mean effective pressure, Specific fuel Consumption (SFC), Brake Thermal Efficiency, Indicated Thermal Efficiency, Mechanical Efficiency are determined.
A. Performance Analysis
1) Brake Thermal Efficiency (BTE): Figure
can be attributed to the better combustion and better intermixing of the fuel and air at this
compression ratio.
C.R 16.5 C.R 17.0 C.R 17.5 C.R 18.0 C.R 19.0
2.45 2.55 2.6 2.65 2.7 2.75 2.8 2.85 2.9 2.95 3 3.05 3.1 3.15 16.25
16.75 17.25 17.75 18.25 18.75 19.25
x y
2) Fuel Consumption:
C.R 16.5 C.R 17.0 C.R 17.5 C.R 18.0 C.R 19.0
2.55 2.6 2.65 2.7 2.75 2.8 2.85 2.9 2.95 3 3.05 3.1 3.15
1.2 1.3 1.35 1.4 1.45 1.5 1.55 1.6
x y
The better fuel consumption was obtained at a compression ratio of 19 (Figure-2). The higher and lower compression ratios than 19 resulted in high fuel consumptions. The fuel consumption at a compression ratio of 17 and 17.5 was almost the
same. The high fuel consumption at higher compression ratios can be attributed to the effect of charge dilution. At the lower sides of the compression ratios, the fuel consumption is high due to incomplete combustion of the fuel.
3) Specific Fuel Consumption:
C.R 16.5 C.R 17.0 C.R 17.5 C.R 18.0 C.R 19
2.45 2.55 2.6 2.65 2.7 2.75 2.8 2.85 2.9 2.95 3 3.05 3.1 0.38
0.42 0.44 0.46 0.48 0.5 0.52 0.54 0.56 0.58
x y
Brake power (KW)
Brake power (KW)
Brake power (KW)
M
ec
h
an
ic
al
ef
fic
ie
n
cy
(
%
)
F
u
el
C
o
n
su
m
p
ti
o
n
(
K
g
/h
The better specific fuel consumption was obtained at a compression ratio of 19.0 and lower compression ratios than 19.0 resulted in high specific fuel consumptions. The specific fuel consumption at a compression ratio of 18.0 and 17.5 was almost the same. At the lower sides of the compression ratios, the specific fuel
consumption is high due to incomplete
combustion of the fuelThe better specific fuel consumption was obtained at a compression ratio of 19.0 and lower compression ratios than 19.0 resulted in high specific fuel consumptions. The specific fuel consumption at a compression ratio of 18.0 and 17.5 was almost the same. At the
lower sides of the compression ratios, the specific fuel consumption is high due to incomplete combustion of the fuel.
4) Mechanical Efficiency: The variation in
mechanical efficiency at different loads for different compression ratios is shown in Fig.4. It is observed that mechanical efficiency increases with the increase in the load due to increase in the BP and IP. With the increase in compression ratio the mechanical efficiency also increases. And the mechanical efficiency at compression ratio of 16.5 and 17.0 was almost the same.
C.R 16.5 C.R 17.0 C.R 17.5 C.R 18.0 C.R 19.0
2.55 2.6 2.65 2.7 2.75 2.8 2.85 2.9 2.95 3 3.05 3.1 3.15 81
82 82.5 83 83.5 84 84.5 85 85.5 86 86.5 87
x y
Break Power
Exhaust gas temperatures were found to be increasing with the increase in load and the compression ratio. The highest exhaust gas temperature was recorded for the compression ratio 19.0 while the least was for 16.5.
S
p
e
c
if
ic
F
u
e
l
C
o
n
su
m
p
ti
o
n
(
K
g
/K
w
-H
r
5) Indicative Mean Effective Pressures:
Indicative Mean Effective Pressures were found to be increasing with the increase in load and the compression ratio. The highest Indicative Mean Effective Pressures was recorded for the compression ratio 19.0 while the least was for 16.5.
6. CONCLUSIONS
Following conclusions can be drawn from the experimentations carried out on the C.I engine with diesel at various compression ratios. The optimum compression ratio is 19 as operation for the given engine. Better fuel economy is obtained at the compression ratio 19.Fuel consumption is higher at compression ratio 16.5.Smoke density is less at compression ratio 19.0.Exhaust gas temperatures are moderate at compression ratio 16.5. For more power at high loads the engine should operate at compression ratio 19 due to less specific fuel consumption. For lower power output at light loads the engine should operate at compression ratio 16.5 due to less fuel consumption.
REFERENCES:
[1] asoudIranmanesh, J.P.Subrahmanyam, M.K.G. Babu, Potential of Diethyl ether as supplementary fuel to improve combustion and emission characteristics of diesel engines,SAE paper number 2008-28-0044 (2008)
[2] M. Senthil Kumar. Experimental investigations on diesel engine with vegetable oils.Ph.D Thesis.IIT Madras, Chennai, India. [3] Ganesan V. 1998. Internal Combustion Engines. Tata
McGrawhill, New Delhi.
[4] B.S. Samaga. Vegetable oil as alternative fuel for C.I engines.8th NCICEC-83. Paper No. AF-2.
[5] J. Ray Smith and Salvador Aceves. 1995. Series Hybrid vehicles and optimized hydrogen engine design. SAE Paper No. 951195.
[6]. Kapilan N., Mohanan P. and Reddy R.P., Performance and Emission Studies of Diesel Engine Using Diethyl Ether as Oxygenated Fuel Additive, SAE Paper number:2008-01- 2466 (2008).
[7]. Ashok M.P. and Saravanan C.G., Effect of Diethyl Ether with Emulsified Fuel in a Direct Injection Diesel Engine, SAE Paper number: 2007-01-2126 (2007)
[8]. Subramanian K.A. and Ramesh A., Use of Diethyl Ether Along with Water-Diesel Emulsion in a Di Diesel Engine, SAE Paper number: 2002-01-2720 (2002).
[9] K.S. Narayana, S. Phani Kumar, M.S.S. Srinivasa Rao “Thermo-Structural Finite Element Analysis of I.C. Engine Pistons “International Colloquium on Materials Manufacturing and Metrology, ICMMM 2014, August 8-9, IIT Madras, Chennai, India. P 882- 84.
[10] Lanka Tata Rao , Katakam Satyanarayana , M.S.S.Srinivasa Rao, T.V. Hanumanta Rao, S.V.UmamaheswaraRao, “stress analysis of 4stroke diesel engine piston “ IJCESR ISSN (print): 2393-8374, (online): 2394-0697,volume-2,issue-2,2015 [11] K.Satyanarayana et al., Condition Monitoring And Detection
Of Unbalance Using Vibration Signature Analysis.
InternationalJournal of Recent Scientific Research Vol. 6, Issue, 8, pp.5796-5800, August, 2015.
[12] D. Simhachalam, N. Indraja, M. Raja Roy"Experimental