CHILDHOOD OBESITY AND FAMILY INFLUENCE ON CHILDREN’S NUTRITION INTAKE, PHYSICAL ACTIVITY PATTERNS, AND BMI Z-SCORES IN OMAN
Basma Al Yazeedi
A dissertation submitted to the faculty at the University of North Carolina at Chapel Hill in partial fulfillment of the requirements for the degree of Doctor of Philosophy in the School of
Nursing.
Chapel Hill 2018
ABSTRACT
Basma Al Yazeedi: Childhood Obesity and Family Influence on Children’s Nutrition Intake, Physical Activity Patterns, and BMI z-scores in Oman
(Under the direction of Diane C. Berry)
Childhood Obesity is a public health problem. It poses a significant health risk, which has been demonstrated to track into adulthood and decreases children’s physical and
psychosocial well-being. The purpose of this study was to examine the relationship between weight status, nutrition intake, and physical activity patterns of Omani middle age children and explore the familial factors that influence them. The sample of the study consisted of 204 Omani mother-child dyads. The mean age of children was 7.74 years (SD ± 1.16). Among examined children, 17.4% were either overweight or obese, and more than 72% of mothers were found to be overweight or obese.
This dissertation work is dedicated to my parents, Mohammed and Laila, whose prayers for my success never stopped. They are my source of power for my achievements. This work is also
dedicated to my beloved husband, Yahya, who has been a continued source of support. I am thankful for having him in my life. This work is also dedicated to my children, Elias and Azzam,
ACKNOWLEDGEMENTS
I am so grateful to Dr. Diane Berry, my advisor and dissertation committee chairperson, for efficiently supporting me through my academic and research journey in the PhD program. This work could not be completed without her continued guidance, support, and feedback. I am also grateful to Dr. Jamie Crandell for supporting me through the analysis of the study results in such a short period of time. I highly appreciated her statistical feedback and guidance. I am also thankful for having Dr. Jennifer Leeman, Amanda Thompson, and Jada Brooks as members of my dissertation committee. Their research expertise had added a lot to my dissertation work.
TABLE OF CONTENTS
LIST OF TABLES ... xi
LIST OF FIGURES ... xvi
LIST OF ABBREVIATIONS ... xvii
CHAPTER 1: INTRODUCTION ... 1
Statement of the Problem ... 1
Definition of Childhood Overweight and Obesity ... 2
Prevalence of Childhood Obesity... 3
Targeting Middle Childhood for Obesity-Related Research ... 3
Etiology of Childhood Obesity ... 4
Genetic Factors... 4
Perinatal and Postnatal Factors ... 5
Environmental Factors ... 6
Nutrition Intake and Physical Activity Pattern in Children in Oman ... 8
Home ... 10
Community ... 11
Purpose of the Study... 16
Research Questions ... 16
Conceptual Framework ... 17
Parenting Styles and Family Characteristics ... 19
Significance of the Study ... 19
CHAPTER 2: LITERATURE REVIEW ... 21
Introduction ... 21
Results ... 32
Childhood Obesity Prevalence ... 32
Children Risk Factors for Obesity ... 33
Discussion ... 39
Childhood Obesity Prevalence ... 39
Childhood Obesity Risk Factors ... 39
Summary ... 51
CHAPTER 3: METHODS ... 52
Introduction ... 52
Aims ... 56
Philosophical Assumptions ... 56
Parenting Styles and Family Characteristics That Influence Children’s Nutrition Intake ... 57
Parenting Styles and Family Characteristics That Influence Children’s Physical Activity ... 57
Design ... 57
Institutional Review Board ... 58
Settings ... 58
Sample ... 59
Sample Size and Power ... 60
Variables and Their Measurement ... 61
Anthropometric Measurements ... 62
Socio-Demographic Data Survey ... 63
Procedures ... 66
School Sites Recruitment ... 66
Participant Recruitment ... 67
Obtaining Mothers Consent and Children Assent ... 68
Data Collection... 68
Data Management ... 70
Data Analysis ... 70
Analysis of Study Variables... 70
Analysis of Study Aims ... 74
Summary ... 76
CHAPTER 4: RESULTS ... 77
Introduction ... 77
Aims ... 77
Descriptive Data Analysis ... 78
Recruitment and Settings ... 78
Sample ... 79
Family Socioeconomic Characteristics ... 81
Anthropometric Measurements ... 83
Nutrition Intake ... 84
Physical Activity Patterns ... 88
Family Nutrition and Physical Activity Pattern ... 90
Analysis of Study Aims ... 91
Aim 1: Assess the Relationship between BMI z- score and Nutrition and Physical Activity Pattern of 1st to 4th-Grade Omani Children ... 94
Aim 2: Examine the Relationship between the Nutrition Intake of 1st
Level, Parental Working Status, Family Income, and Family Nutrition
and Physical Activity Patterns ... 100
Aim 3: Examine the Relationship between the Physical Activity Patterns of 1st to 4th Grade Omani Children and Maternal BMI, Parental Educational Level, Parental Working Status, Family Income, and Family Nutrition and Physical Activity Pattern ... 117
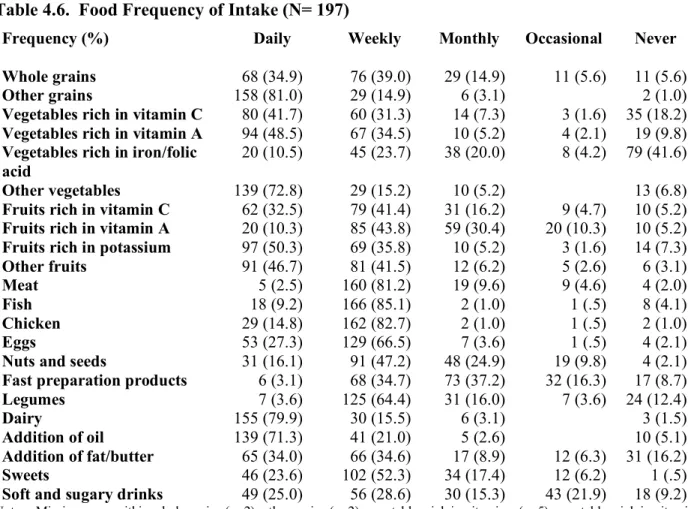
Aim 4: Examine the Relationship between BMI z- scores of 1st to 4th -Grade Omani Children and Maternal BMI, Parental Education Level, Parental Working Status, Family Income, and Family Nutrition and Physical Activity Pattern ... 127
Summary ... 133
CHAPTER 5: DISCUSSION ... 140
Childhood Obesity Prevalence ... 140
Aim One: Relationship between BMI z-scores and Nutrition and Physical Activity Patterns ... 141
Children’s BMI z-scores and Nutrition Intake ... 141
Children’s BMI z-scores and Physical Activity Patterns ... 154
Aim Two: Family Influence on Children’s Nutrition Intake ... 158
Maternal BMI ... 158
Parental Education Level ... 159
Parental Working Status ... 160
Family Income ... 161
Family Nutrition and Physical Activity Pattern ... 162
Aim Three: Family Influence on Children’s Physical Activity Patterns ... 165
Maternal BMI ... 165
Parental Education Level ... 167
Parental Working Status ... 168
Aim Four: Family Influence on Children’s BMI z-score ... 172
Maternal BMI ... 172
Parental Education Level ... 173
Parental Working Status ... 174
Family Income ... 176
Family Nutrition and Physical Activity Patterns ... 177
Synthesis of Aims ... 178
Future Research and Policy Implications ... 179
Limitations ... 180
Summary ... 182
APPENDIX A. SOCIO-DEMOGRAPHIC DATA SURVEY ... 183
APPENDIX B. CHILDREN NUTRITION PHYSICAL ACTIVITY PATTERN INSTRUMENT ... 186
APPENDIX C. APPROVAL FOR USING CHILDREN NUTRITION PHYSICAL ACTIVITY PATTERN INSTRUMENT ... 190
APPENDIX D. THE FAMILY NUTRITION PHYSICAL ACTIVITY SCREENING TOOL ... 191
APPENDIX E. APPROVAL FOR USING THE ARABIC VERSION OF FAMILY NUTRITION PHYSICAL ACTIVITY SCREENING TOOL ... 194
APPENDIX F. FACILITATE A RESEARCHER TASK OFFICIAL LETTER ... 195
APPENDIX G. INVITATION MESSAGE ... 196
APPENDIX H. ADULT CONSENT ... 198
APPENDIX I. CHILD ASSENT ... 201
LIST OF TABLES
Table 2.1. Reviewed Studies ... 26
Table 2.2. Prevalence of Overweight and Obesity among Children Ages 6-to-10 Years Old in Some GCC Countries ... 33
Table 3.1. Summary of Measures ... 61
Table 3.2. Study Variables Descriptive Analysis Plan ... 73
Table 4.1. The Provinces Reached for Participants Recruitment ... 78
Table 4.2. Children’s Characteristics (N=197)... 80
Table 4.3. Family Socioeconomic Characteristics (N=197) ... 82
Table 4.4. Children and Mothers Anthropometric Data (N=197) ... 83
Table 4.5. Children’s and Mothers’ Body Mass Index (BMI) Classification ... 84
Table 4.6. Food Frequency of Intake (N= 197) ... 85
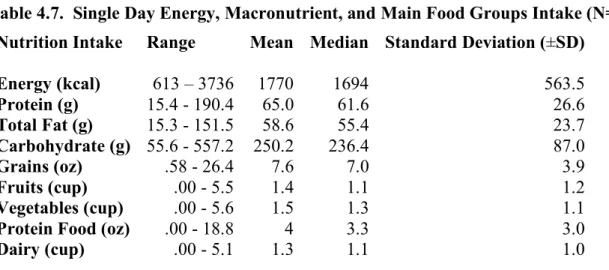
Table 4.7. Single Day Energy, Macronutrient, and Main Food Groups Intake (N=197) ... 87
Table 4.8. Recommended Energy Intake Based on the 2015-2020 Dietary Guidelines for Americans and Omani Guide to Healthy Eating ... 87
Table 4.9. Energy Intake Compared to the Guidelines (n=196)... 88
Table 4.10. Children’s MVPA and Screen Times Means (N=197) ... 89
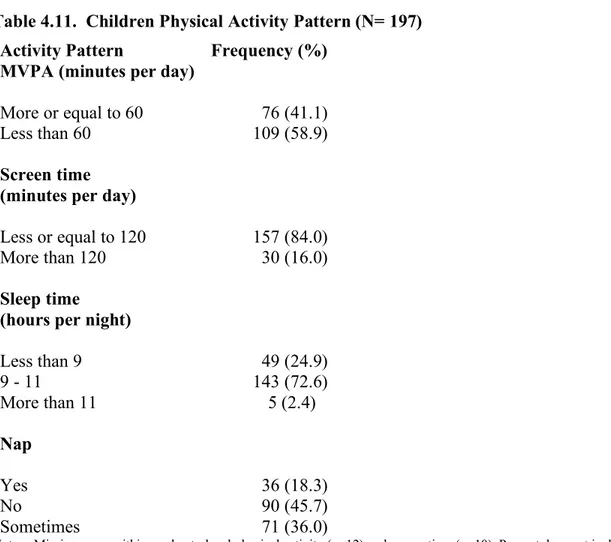
Table 4.11. Children Physical Activity Pattern (N= 197) ... 90
Table 4.12. Family Nutrition and Physical Activity (FNPA) Scores (N=197) ... 91
Table 4.13. Eating with Family (n=196) ... 91
Table 4.14. Modification of Categorical Variables Categories for Study Aims Analysis ... 93
Table 4.15. Pearson’s Correlation of Children’s BMI z-score with Single Day Nutrition Intake... 94
Table 4.17. Coefficients of Single Day Nutrition Intake Predictors on Children’s
Weight Status... 96 Table 4.18. Children’s BMI z-score Means for Soft and Sugary Drinks and
Addition of Fat or Butter Frequency of Intake ... 96 Table 4.19. Crosstabulation of Children’s Weight Status and Soft and Sugary
Drink Frequency of Intake ... 97 Table 4.20. Pearson’s Correlation of Children’s BMI z-score with MVPA and
Screen Time ... 97 Table 4.21. Children’s BMI z-score Means for MVPA, Screen Time, and Sleep
Time ... 98 Table 4.22. Crosstabulation of Children’s Weight Status with MVPA, Screen
Time, and Sleep Time ... 98 Table 4.23. Coefficients of Physical Activity Pattern Predictors on Children’s
BMI z-scores ... 99 Table 4.24. Coefficients of Physical Activity Pattern Predictors on Children’s
Weight Status... 100 Table 4.25. Pearson’s Correlation of Children’s Single Day Nutrition Intake with
Maternal BMI ... 101 Table 4.26. Crosstabulation between Maternal Weight Status and Meat
Frequency of Intake ... 101 Table 4.27. Children’s Single Day Nutrition Intake Means by Mother’s education
Level ... 102 Table 4.28. Single Day Nutrition Intake Means by Father’s Education Level ... 102 Table 4.29. Crosstabulation between Mothers’ Education Level and Frequency of
Intake of Vegetables Rich in Vitamin A and Fish ... 103 Table 4.30. Crosstabulation between Fathers’ Education Level and Meat and
Nuts and Seeds Frequency of Intake ... 104 Table 4.31. Single Day Nutrition Intake Means by Mother’s Working Status ... 104 Table 4.32. Single Day Nutrition Intake Means by Father’s Working Status... 105 Table 4.33. Crosstabulation between Mothers Working Status and Frequency of
Table 4.35. Crosstabulation between Family Income and Fruits Rich in Vitamin
C and Nuts and Seeds Frequency of Intake... 108
Table 4.36. Pearson’s Correlation of Single Day Nutrition Intake with FNPA score ... 109
Table 4.37. FNPA Score Means by Food Frequency of Intake... 109
Table 4.38. Single Day Grains Intake Means by Eating with Family from One Plate... 110
Table 4.39. Crosstabulation of Children’s Food Frequency of Intake with Eating with Family... 111
Table 4.40. Crosstabulation of Eating with Family from One Plate with Fish, chicken, and Nuts and Seeds Frequency of Intake ... 111
Table 4.41. Model Summary of Family Predictors of Single Day Nutrition Intake after Controlling for Children’s Age and Gender ... 112
Table 4.42. Summary of Significant Coefficients for Family Predictors of a Single day Intake after Controlling for Children’s Age and Gender ... 113
Table 4.43. Summary of Significant Coefficients for Family Predictors of Food Frequency of Intake after Controlling for Children’s Age and Gender ... 115
Table 4.44. Coefficient for Eating with Family from One Plate Predictor of Single Day Grain Intake (oz) After Controlling for Children’s Age and Gender ... 116
Table 4.45. Coefficients of Eating with Family Predictor of Children’s Food Frequency Intake ... 117
Table 4.46. Pearson’s Correlation of Children’s MVPA and Screen Time with Maternal BMI ... 118
Table 4.47. Maternal BMI Means by Sleep Time ... 119
Table 4.48. Crosstabulation between Sleep Time and Maternal BMI ... 119
Table 4.49. MVPA and Screen Time Means by Mothers’ Education Level ... 120
Table 4.50. Crosstabulation between MVPA and Fathers’ Education Level ... 120
Table 4.51. MVPA and Screen Time Means by Parental Working Status ... 121
Table 4.53. MVPA and Screen Time Means by Family Income ... 122
Family nutrition and physical activity pattern ... 123
Table 4.54. Pearson’s Correlation of MVPA and Screen Time with Maternal BMI and FNPA Score ... 123
Table 4.55. FNPA score Means by MVPA, Screen Time, and Sleep time ... 123
Table 4.56. Crosstabulation between Eating with Family and Sleep Time ... 124
Table 4.57. Models Summary. Family Predictors of MVPA and Screen Time after Controlling for Children’s Age and Gender ... 125
Table 4.58. Coefficient of Family Predictors of Screen Time after Controlling for Children’s Age and Gender ... 125
Table 4.59. Significant Coefficients for Family Predictors of MVPA, Controlling for Children’s Age and Gender ... 126
Table 4.60. Significant Coefficient for Family Predictors of Sleep time, Controlling for Children’s Age and Gender ... 126
Table 4.61. Coefficients of Eating with Family predictor of Sleep time ... 127
Table 4.62. Pearson’s Correlation of Children’s BMI z-score with Maternal BMI ... 128
Table 4.63. Maternal BMI Means by Children’s Weight Status ... 128
Table 4.64. Children’s BMI z-scores Means by Parental Education Level ... 129
Table 4.65. Crosstabulation between Children’s Weight Status and Mothers’ Education Level ... 129
Table 4.66. Pearson’s Correlation of Children’s BMI z-score with FNPA score ... 130
Table 4.67. Children’s BMI z-score Means by Eating with Family ... 130
Table 4.68. Crosstabulation of Children’s Weight Status and Eating with Family ... 130
Table 4.69. Model Summary. Family Predictors of Children’s BMI z-score After Controlling for Children’s Age and Gender ... 131
Table 4.70. Coefficient for Family Predictors of Children’s BMI z-score after Controlling for Children’s Age and Gender ... 131
Table 4.72. Coefficients for Eating with Family Predictors of Children’s BMI
z-scores ... 133 Table 4.73. Coefficients for Eating with Family Predictors of Children’s Weight
LIST OF FIGURES
Figure 1.1. Davison and Birch (2001) Ecological Model of Childhood Overweight
LIST OF ABBREVIATIONS AAP American Academy Of Pediatrics
ADHD Attention Deficit Hyperactivity Disorder AND Academy of Nutrition and Dietetics ASA24 Automated Self-Administered 24-Hour ATLS Arab Teens Lifestyle Study
BAR Behaviorally Anchored Rating BMI Body Mass Index
BMR Basal Metabolic Rate
BP Blood Pressure
CDC Center for Disease Control and Prevention CLASS Children’s Leisure Activities Study Survey FAO Food and Agriculture Organization
FFS Fish Feeding Study
FFQ Food Frequency Questionnaire
FNDDS Food and Nutrient Database for Dietary Surveys FNPA Family Nutrition and Physical Activity
FTOFat Mass and The Obesity-Associated gene
G Gram
GCC Gulf Cooperation Council
GI Glycemic Index
Kcal Kilocalorie
MOE Ministry Of Education MOH Ministry Of Health
MVPA Moderate to Vigorous Physical Activities NCI National Cancer Institute
NHANES National Health and Nutrition Examination Survey NIH National Institute of Health
OMR Omani Rial
OPAL Obesity Prevention and Lifestyle
OR Odd Ratio
Oz Ounce
RA Research Assistants RMR Resting Metabolic Rate SD Standard Deviation
SE Standard Error
SES Socioeconomic Status
TV Television
UAE United Arab Emirates
US United States
CHAPTER 1: INTRODUCTION Statement of the Problem
Childhood Obesity is a global public health concern. It poses a significant health risk, which has been demonstrated to track into adulthood (Kelsey, Zaepfel, Bjornstad, & Nadeau, 2014; Li et al., 2015; World Health Organization [WHO], 2014) and decreases children’s physical and psychosocial well-being. Prediabetes, type 2 diabetes, asthma, cardiovascular disease, nonalcoholic fatty liver disease, obstructive sleep apnea, polycystic ovarian syndrome, orthopedic complications, increased rates of cancer, and dental issues have been identified as comorbidities in children with obesity (Kelsey et al., 2014; ÖNSÜZ & Demir, 2015; Park, Falconer, Viner, & Kinra, 2012; Pulgaron, 2013; Sahoo et al., 2015; WHO, 2014).
Psychosocially, children with weight problems, are reported to struggle to make friends, suffer from somatic complaints, develop depressive symptoms, have a negative body image and low self-esteem, have sleep problems, and decreased academic performance (Harrist et al., 2016; Karnik & Kanekar, 2012; Pulgaron, 2013).
normal-weight peers (Withrow & Alter, 2011). An Australian study found that 10-years old children with normal weight accumulated fewer health care costs while children with obesity accumulated higher health care costs (Clifford et al., 2015). Increased health care cost differences between normal and overweight children were evident as early as 4-years old (Clifford et al., 2015).
Definition of Childhood Overweight and Obesity
The WHO describes overweight and obesity as abnormal or excessive adiposity accumulation that presents a risk to health (WHO, 2014). Body mass index (BMI), weight in kilograms divided by the square of height in meters, is the measure used to assess weight status (Krebs et al., 2007). In children, BMI values vary with age and gender. Therefore, they are usually converted into BMI percentiles or BMI z-scores, which represent a measure of weight, adjusted for height, gender, and age to ascertain whether the child is underweight, normal
weight, overweight or obese (Flegal & Ogden, 2011). BMI percentiles refer to the percentage of observations that fall below the value of a variable (Wang & Chen, 2012), while BMI z-score denotes the number of standard deviation (SD) units above or below the mean (de Onis et al., 2007).
In the United States (U.S.), the Center for Disease Control and Prevention (CDC) 2000 growth charts are the chosen reference to define weight status in children (Krebs et al., 2007). According to the CDC growth 2000 reference for children and adolescents 2-to-19 years of age, normal weight is defined as a BMI percentile between the 5th and just below the 85th percentile,
overweight is between the 85th and just below the 95th percentile, and obesity is at or above the
95th percentile (Kuczmarski et al., 2000).
Ministry of Health [MOH], 2015). According to 2007 WHO growth charts for children and adolescents age 5-to-19 years, normal weight is identified as a z-score between -2 and 1,
overweight is between greater than 1 and 2, and obesity is at greater than 2 (de Onis et al., 2007). Prevalence of Childhood Obesity
The prevalence of overweight and obesity in children is increasing rapidly. From 1980 to 2013, the worldwide prevalence of childhood overweight and obesity increased by 47.1% (Ng et al., 2014). In Oman, the rate of childhood obesity is increasing as well (Al-Saeed, Al-Dawood, Bukhari, & Bahnassy, 2007; Osman, Muscati, Ganguly, Khan, & Al-Sharji, 2004). From 2012 to 2015, the rate of overweight and obesity in Oman increased from 3.5% to 4.8% among children in the first grade (i.e., 6 - 7 years), from 12.8% to 15.5% among children in the seventh grade (i.e., 12 - 13 years) and from 12.5% to 17.2% among children in the tenth grade (i.e., 15 - 16 years; MOH, 2012, 2015). The prevalence of obesity is increasing, which indicates an urgent need for intervention with children at a younger age before the problem escalates.
Targeting Middle Childhood for Obesity-Related Research
Middle childhood (i.e., 5 - 10 years) is an excellent age to deliver obesity-related
programs. Huston and Ripke (2006) stated, “although the preschool years establish the base for future development, experiences in middle childhood can sustain, magnify, or reverse the
parents have more influence over their children’s environment during middle childhood than they do in the adolescent years (Huston & Ripke, 2006).
Middle childhood is characterized by physical, cognitive, social, and contextual changes (American Academy of Pediatrics [AAP], 2008). Physically, they start the initial stages of puberty (Huston & Ripke, 2006). Cognitively, they begin to develop reasoning and skills at self-reflection (Simpkins, Fredricks, Davis-Kean, & Eccles, 2006). Socially, they can establish relationships with peers and develop a sense of awareness, regulation, and self-confidence (Huston & Ripke, 2006). Also, they can understand and comply with rules and assume accountability for their tasks (AAP, 2008). Contextually, they start to broaden their experiences beyond home (AAP, 2008; Huston & Ripke, 2006). At this stage of life, children’s behaviors and beliefs are highly influenced by their environment (Huston & Ripke, 2006).
Etiology of Childhood Obesity
Obesity was described by Brockmann, Arends, Heise, and Dogan (2017) as, “a complex trait, determined by many genes and influenced by environmental factors” (p. 481). The factors contributing to obesity indicate that they are not isolated and they influence each other. The literature has identified genetic, perinatal and postnatal, and environmental factors, which are described in more detail below.
Genetic Factors
The best explanation for genetic vulnerability to obesity can be made through fat mass and the obesity-associated (FTO) gene, as the risk of obesity was found to be associated with variations in this gene (Granot, 2015). A recent meta-analysis reported a confirmed association between increased risk of childhood obesity and one of the genotypes named rs17782313 (Tang et al., 2016). Another study found that mothers' FTO rs9939609 and LEPR rs1137101 gene polymorphisms had a direct impact on newborns birth weight and BMI percentile (Marginean et al., 2016).
Interactions between genetics and the environment have also been documented in recent research. A large-scale meta-analysis study reported a possible link between the FTO gene, adiposity, and protein intake, but surprisingly not with total energy or other macronutrient intake (Qi et al., 2014). This finding was supported by the del Mar Bibiloni et al. (2015) study that reported that children with overweight and obesity had higher energy intake from protein, which was positively associated with BMI, compared to non-overweight children. Moreover, the interaction between socioeconomic status (SES) and the FTO gene was documented in research (Foraita et al., 2015), which infers the influence of children’s social environment on the FTO gene. An individual’s genetic susceptibility to obesity, therefore, must be balanced with a healthy lifestyle and protective health behaviors.
Perinatal and Postnatal Factors
Interestingly, women’s health during pregnancy influences their children’s risk of
early in an infant’s life were found to increase children’s risk of developing obesity (Ajslev, Andersen, Gamborg, Sørensen, & Jess, 2011; Portela et al., 2015; Song, Dominguez-Bello, & Knight, 2013). The association of these factors with infant obesity can be explained partially by gut microbiota flora, which has been recently identified as a contributing factor to obesity. Researchers have found that the microbiota of lean individuals is much more diverse than that of those with obesity (DiBaise, Frank, & Mathur, 2012). Microbiota effects nutrient and energy homeostasis and consequently the control of body weight (Granot, 2015). Intake of antibiotics during pregnancy and cesarean section delivery may alter maternal and offspring exchange of microbiota, which may disturb the microbial colonization of the infant’s gut (Lemas et al., 2016; Mueller et al., 2015). Similarly, infant formula and antibiotics administered during the first year of life may also alter the infants’ gut microbiota flora, which may predispose them to obesity later in life (Ajslev et al., 2011; Azad, Bridgman, Becker, & Kozyrskyj, 2014; Mueller et al., 2015).
Environmental Factors
Americans, children during middle childhood age (i.e., 5 - 10 years) require an estimated amount of 1,200 to 2,000 calories per day based on their age, gender, and activity level (USDA, 2015).
At middle childhood age, energy expenditure is represented by basal metabolic rate (BMR), metabolic response to food, and physical activity, in addition to negligible expenditure through growth (i.e., 1 - 2 percent) (Food and Agriculture Organization [FAO], 2001; Hill et al., 2012; Westerterp, 2013). The resting metabolic rate (RMR) is the amount of energy necessary to fuel the body at rest, and the thermic effect of food is the energy cost of absorbing and
metabolizing food consumed (Hill et al., 2012). BMR accounts for a large part of daily energy expenditure with up to 70 percent, followed by the physical activity and lastly the metabolic response to food, which increases total energy expenditure by about 10 percent of the BMR (FAO, 2001). Among these processes, physical activity is more frequently measured in research to estimate energy expenditure. Activity energy expenditure for children ranges between 60 and 80 kJ/ kg (Westerterp, 2013). In children, physical activity may be assessed by a variety of methods including direct observation, questionnaires, physiological markers such as heart rate and motion sensors in addition to different devices such as pedometry and accelerometry (Aparicio-Ugarriza et al., 2015; Pate, O'Neill, & Mitchell, 2010; Westerterp, 2013).
When there is high-energy intake and low energy expenditure, a positive balance will result, and extra energy will be stored as adipose tissue (Cuthbertson et al., 2017). With the accumulation of adipose tissue in the body, body weight increases and when it exceeds certain standardized limits, it manifests as overweight or obesity. High-calorie intake may be
2013). In a study with participants with obesity between 5 - 17 years of age, two-thirds have experienced overeating (Anderson et al., 2016). Children sometimes consume high sugar and fat commercial food including candies, chips, and sugary drinks (Kuźbicka & Rachoń, 2013;
Schneider, Jerusalem, Mente, & De Bock, 2013; Tate et al., 2015), which are nutrient deficient (Pan et al., 2014). Low energy expenditure through low levels of physical activity happens in children when they are not engaging in physical play or sports (Janssen, 2014). Innately, children enjoy physical play as it is part of their normal development (Herrington & Brussoni, 2015), however, over time children have decreased physical activity and increased sedentary activity (Kaushal & Rhodes, 2014).
These environmental factors are modifiable, particularly for children in their middle years. Therefore, the work of this dissertation study has focused on energy balance represented by energy intake through the caloric intake and energy expenditure through the level of physical activity.
Nutrition Intake and Physical Activity Pattern in Children in Oman
Studies focused on children with overweight and obesity in the Middle East region were congruent with the earlier discussion on the environmental contribution to obesity and reported that the intake of calorie dense food and decreased physical activity were two of the major causes of overweight and obesity in children (Badran & Laher, 2011; Mirmiran, Sherafat-Kazemzadeh, Jalali-Farahani, & Azizi, 2010; Musaiger, 2011). In Oman, few studies have examined nutrition intake and or physical activity level among children (Kilani, Al-Hazzaa, Waly, & Musaiger, 2013; Musaiger, 1994; Musaiger, 1996). However, none have included children in middle childhood.
to overweight and obesity (12%, Musaiger, 1994). Musaiger (1994) also found that children with overweight and obesity more frequently ate a western diet and adolescent girls with overweight more frequently skipped breakfast compared to adolescent girls who were underweight or normal weight. Two years later, Musaiger (1996) detailed the food habits of preschool children, adolescent girls, and mothers in two main regions in Oman. He documented a decrease in breastfeeding duration and early introduction of formula and commercial baby food compared to two decades earlier (Musaiger, 1996). Also, Musaiger (1996) indicated that
participants’ food consumption was trending toward a diet consisting of high fat, high cholesterol, high- refined sugar, and high sodium.
Kilani and colleagues (2013) examined the lifestyle habits of Omani adolescents aged 15 to 18 years. Study findings indicated unhealthy dietary habits, a high prevalence of total daily screen time (mean 2.9 hours per day for males and 3.7 hours per day for females), shorter duration of sleep (mean 6.7 hours per day), and low levels of physical activity especially among females (Kilani et al., 2013).
Nutrition intake and physical activity level findings in children from other GCC countries were similar. In a group of six to ten years old children from the United Arab Emirates,
researchers found a high percentage of participants reported excessive caloric intake (38% of boys and 43% of girls) and low levels of physical activity, especially among females and those living in urban communities (Ng, Zaghloul, Ali, Harrison, & Popkin, 2011a). Another study conducted in Saudi Arabia carried out with primary school-age children (7 - 12 years)
It is essential to keep in mind that children’s lifestyle behaviors are guided and influenced by other environmental contexts they live within, including the home and community (Classen & Thompson, 2016; Granot, 2015; Karnik & Kanekar, 2012; Martin, Saunders, Shenkin, &
Sproule, 2014). The home environment directly influences children’s nutrition intake and physical activity levels through their interactions with their families (Clark, Goyder, Bissell, Blank, & Peters, 2007), while community and societal norms affect the family (Caprio et al., 2008), which in turn affect child behaviors. To better understand the nature of children’s nutrition and physical activity patterns, it is important to explore the contributing factors within the home and community contexts.
Home
Home is the primary environmental context that impacts children’s lifestyle behaviors especially during the middle childhood period of life. Unlike adolescence where youth begin to exhibit separation from their family and ask to go out with peers unaccompanied (Kumanov & Agarwal, 2016), children during middle childhood are still connected to their home and families. At the same time, they gradually start to make their choices about what to eat (AAP, 2008). Therefore, it is important to promote healthy lifestyle behaviors during middle childhood.
At home, parents create an environment for their children that either promote or do not promote the development of healthy nutrition and physical activity behaviors (Scaglioni, Salvioni, & Galimberti, 2008). Particularly during middle childhood, parents’ beliefs and practices significantly promote or discourage children’s participation in activities such as sports (Simpkins et al., 2006). The support provided to children by families during this period of life is crucial to refining the lifestyle pathway they adopt during their adolescence and adult life
with parental obesity in Oman (Hassan & Al-Kharusy, 2000), which infers parental obesogenic behaviors.
Parenting style regarding weight-related behaviors has been associated with children’s nutrition and physical activity attitudes (Clark et al., 2007; Taylor, Wilson, Slater, & Mohr, 2011). Parental restrictive feeding for weight control (Dev et al., 2013), negative parent modeling regarding nutrition and physical activity behaviors, and using food as an incentive were found to significantly increase the risk for childhood obesity (Mazarello Paes, Ong, & Lakshman, 2015). Also, time limitations due to working status and the absence of nutritional awareness have been identified as factors involved in young children’s obesogenic diets (Mazarello Paes et al., 2015).
A national study completed in Oman found that preschool children’s mothers with high-ranking jobs had lower levels of nutrition knowledge as well as more unhealthy food-related attitudes compared to non-working mothers (Shookri, Shukaily, Hassan, Sheraji, & Al-Tobi, 2011). Another study from Saudi Arabia found that the rate of obesity was higher among school children of mothers with higher levels of education compared to the school children of mothers with lower education levels (Al-Saeed et al., 2007). These findings indicate decreased awareness of obesity in the region that is not necessarily associated with parental job rank or educational level.
Community
Multiple community factors can affect the family dynamics, which consequently
shifting from a traditional healthy lifestyle to a less healthy lifestyle (e.g., nutrition and physical activity), which has been attributed to urbanization, social, and health care system factors.
Urbanization. Oman like other countries in the GCC has experienced a marked shift in economic status secondary to the discovery of abundant oil reserves over 40 years ago (Abdul-Rasoul, 2012; Musaiger, 2004, 2011; Ng et al., 2011a), which resulted in improved health services and a major decline in communicable diseases, but an increase in lifestyle
non-communicable diseases including obesity (Ganguly, Al Shafaee, Al Lawati, Dutta, & Duttagupta, 2009). An increase in individual income and openness to a western lifestyle and the global market with urbanization has resulted in moving away from traditional healthy nutrition and physical activity patterns (Abdul-Rasoul, 2012; Mena, Gorman, Dickin, Greene, & Tovar, 2015; Musaiger, 2004, 2011).
Since food has become more affordable in Oman and despite the fact that the size of families has decreased in Oman (average life birth per women dropped from 10 in 1980 to 4 in 2015) (Hill, Muyeed, & al-Lawati, 2000), the amount of food prepared for the family has increased (Musaiger, 2002). Until the 1970s, family’s main sources of nutrition were farms which produced fruits, vegetables, whole-wheat grains, legumes, and raised cattle, poultry, and fish (ALNohair, 2014; Musaiger, 1991). With urbanization, a broad range of restaurants serving fast food and convenience food stores have become available mainly in the urban communities (Musaiger, 2011), where obesity rates are higher in countries similar to Oman (Al-Saeed et al., 2006). Fast food such as pizza, burgers, sandwiches, and French fries have increased in
popularity in Oman (Kilani et al., 2013). An increased intake of fast food has started to replace some of the traditional food served to families (Musaiger, 1994, 2002). Pita pockets and
part become more popular than Rekhal, which is an Omani traditional thin whole wheat bread that has a lower GI (39.1 ± 7.5) (Ali, Al-Nassri, Al-Rasasi, Akhtar, & Al-Belushi, 2010). Food stores are mainly providing energy dense low nutrient food items including sugared drinks, juice with high fructose corn syrup, candy, and chips (Osman et al., 2004). Unfortunately, they are some of the most requested snacks for children in Oman, which substitute other healthy meals (Osman et al., 2004).
Before urbanization, processed food items were not readily available due to the limited exposure to global markets. The introduction of processed food ingredients into cooking such as processed flour, sugar, salt and saturated fat has increased after urbanization (Mirmiran et al., 2010; Musaiger, 2002), which has shifted traditional dishes into less healthy ones.
Also, to the increased disposable income that families now enjoy in Oman, women in increasing numbers are going to work (Al Riyami, Afifi, & Mabry, 2004; Mohamed et al., 2004). This had a direct impact on family food preparation since many families can now afford to hire full-time housemaids, mainly from South Asia and East Africa to do the cooking and cleaning (Brochmann, 1987; Serour, Alqhenaei, Al-Saqabi, Mustafa, & Ben-Nakhi, 2007). Housemaids from other countries also provide the opportunity for family members to experience a variety of new foods, some of which may be healthy or unhealthy, and are a further shift away from traditional meals (Ng, Zaghloul, Ali, Harrison, Yeatts, et al., 2011b).
operations as well (Birks, Seccombe, & Sinclair, 1988; Kapiszewski, 2006). Also, domestic house tasks were taken over by full-time housemaids (Brochmann, 1987; Birks et al., 1988; Serour et al., 2007), which further enhanced inactivity especially for females who are culturally the ones in charge of domestic tasks. Several, though dated, studies have found that hiring full-time housemaids who take over the cooking and cleaning for the family have been found to have a significant association with obesity in the region (Isa, 1999; Shammari, Khoja, Al-Maatouq, & Al-Nuaim, 1994). However, in Oman, a study reported there was no significant association between the number of house helpers and boys physical fitness measures (Hassan & Al-Kharusy, 2000), which may not be necessarily true for females.
Hiring workers to do the daily tasks family used to do have been combined with the availability and affordability of technology (e.g., televisions [TV], computers and cell phones) has increased sedentary activities (Al-Isa, 1999). Also, cars increasingly became affordable and soon were the preferred option for transportation compared to walking or cycling (Mabry, Winkler, Reeves, Eakin, & Owen, 2013; Serour et al., 2007). Leisure time activities for 9 to 11 years old Omani boys and their parents were previously documented at 6.8 hours per week with 3.2 hours per day of television and video games and 0.82 hours per week for fathers’ exercise and 0.2 hours per week for mothers’ exercise (Hassan & Al-Kharusy, 2000).
Social. GCC countries are family-centered communities and tend to have frequent social gatherings, which involve sharing food among family members and friends (Badran & Laher, 2011; Serour et al., 2007). As a sign of generosity for families with increased wealth, food is prepared in large amounts, and people are encouraged to eat larger portion sizes (Badran & Laher, 2011). Meat and rice are the standard meal in social gatherings, which is high in fat, protein, and carbohydrates (Musaiger, Ahmed, & Rao, 1998). Since the eating patterns of children at middle childhood age usually resemble the eating patterns of their parents (Clark et al., 2007; Taylor et al., 2011), they are at risk for increased caloric intake resulting from this social trend.
In the Arab community, females are less active compared to males, which is attributed to some cultural restrictions (Mabry et al., 2013). However, barriers to physical activity among female Omani youth were described as a lack of energy, interest in other activities, lack of encouragement, worries about looks, and time constraints from academic responsibilities and family obligations (Youssef et al., 2013).
Health Care System. Resources informing parents about their children’s weight status and the consequences of overweight and obesity are limited in Oman. In Oman, there are no scheduled child medical check-ups beyond age 18 months, which is the time that infants
complete their immunizations. School physical check-ups including weight status measurements are only done for children at first, seventh or tenth grade (MOH, 2015). However, these
measurements are completed at school settings without the parents being present, and the results are not necessarily shared with the parents. As a result, the parents’ may have a distorted
status (Al-Qaoud et al., 2010). Multiple other studies reported a distorted perception of children’s weight status in the GCC region as well (Abalkhail, Shawky, & Ghabrah, 2002; Al
-Sendi, Shetty, & Musaiger, 2004; Musaiger, bin Zaal, & D'Souza, 2012). Mothers who do not have a clear understanding of their children’s weight status and underestimate the health risks of overweight and obesity tend to overfeed their children (Hirschler, Calcagno, Clemente, Aranda, & Gonzalez, 2008), which consequently leads to obesity.
Purpose of the Study
Childhood obesity is relatively new in Oman and has not to date been adequately examined, particularly in children during middle childhood. The purpose of this study was to examine the relationship between weight status, nutrition intake, and physical activity patterns of Omani middle age children and explore the familial factors that influence them. The sample of the study involved 1st to 4th-grade Omani children (age ~ 6 - 10 years) and their mothers.
Research Questions
Question 1. What is the relationship between BMI z-scores and nutrition intake and physical activity patterns of 1st to 4th-grade Omani children?
Question 2. What are the familial factors that influence the BMI z-scores, nutrition intake, and physical activity patterns of 1st to 4th-grade Omani children?
Conceptual Framework
The conceptual framework underpinning this study was the ecological model by Davison and Birch (2001) (Figure 1.1). The Davison and Birch (2001) ecological model of predictors of childhood overweight was created based on Bronfenbrenner’s Ecological Systems Theory (Bronfenbrenner, 1986; Bronfenbrenner & Morris, 1998). Consistent with the Ecological Systems Theory (Bronfenbrenner, 1986; Bronfenbrenner & Morris, 1998), development occurs as a result of interactions between the child’s characteristics and procedures in the family and the school, which themselves are influenced by the community and society characteristics
(Bronfenbrenner, 1986; Bronfenbrenner & Morris, 1998). Bronfenbrenner (2009) has defined the ecology of human development as “the scientific study of the progressive, mutual
accommodation between an active growing human being and the changing properties of the immediate setting in which the developing person lives” (p.21).
Guided by the ecological model, Davison and Birch’s (2001) conceptual framework reflects a comprehensive and systematic mean of assessing the predictors of childhood obesity. This framework underpins the complexity of childhood obesity. Recognizing that most public health challenges such as childhood obesity are too complex to be adequately understood from a single level analysis, the ecological model includes a more comprehensive approach that
Figure 1.1. Davison and Birch (2001) Ecological Model of Childhood Overweight Predictors
Parenting Styles and Family Characteristics
Davison and Birch (2001) explained that children’s nutrition intake and physical activity patterns are molded by parenting styles and other family characteristics. Parent’s nutrition knowledge, types of foods parents make available for their children, parental modeling of particular eating behaviors, and parent child-feeding practices were identified as pathways by which parents may shape children’s dietary practices (Clark et al., 2007; Davison & Birch, 2001; Taylor et al., 2011). Similarly, variables including parental preferences of activity, movement pattern, and encouragement of their children’s activity influence their children’s activity patterns (Davison & Birch, 2001).
Significance of the Study
In Oman, childhood overweight and obesity continues to escalate. It is imperative to understand the problem through a cultural lens. The Omani government is aware of the escalating childhood obesity problem and is encouraging the development of programs to
prevent overweight and obesity in children (Times of Oman, 2011). To date, there have been no research studies in Oman that have examined nutrition intake and physical activity behaviors in middle age Omani children.
understand children nutrition and physical activity patterns at multiple ecological levels. The findings of this study provide valuable data necessary to design future intervention studies to prevent and manage overweight and obesity in middle age Omani children within the family context. Therefore, it is imperative to understand middle age children’s nutrition and physical activity patterns and the family factors influencing them about the increasing overweight and obesity epidemic in Oman.
Chapter Summary
This chapter has provided an overview of the childhood overweight and obesity problem and definitions. It specifically examined the problem for middle age children (i.e., 5 to 10 years). The chapter discussed the etiology of childhood obesity focusing mainly on the
CHAPTER 2: LITERATURE REVIEW Introduction
Childhood overweight and obesity is a contemporary disease that constitutes a major risk to public health. Its incidence is particularly high in developed countries compared to
developing countries (Ng et al., 2014). However, a substantial rise in overweight and obesity was recently reported in children and adolescents 2-to-19 years of age in developing countries from 1980 (8.1% in boys, 8.4% in girls) to 2013 (12.9% in boys, 13.4% in girls) (Ng et al., 2014).
Childhood underweight has been a long-term problem in Oman. In 2016, the rates of severe underweight and underweight ranged between 11 to 17% among school-age children in Oman (Ministry of Health [MOH], 2016). However, most recently child overnutrition has emerged as a serious public health concern resulting in childhood overweight and obesity (MOH, 2016). The 2016 MOH report demonstrated that among about 50,000 first grade children
examined in Oman, 3.7% were overweight and 2.1% were obese (MOH, 2016). Among a total of about 36,000 seventh grade children, 9.7% were overweight, and 6.7% were obese (MOH, 2016). Further, a total of 34,400 tenth grade children were examined, and 10.6% were overweight, and 7.8% were obese (MOH, 2016).
Despite this alarming development, little is known about overweight and obesity in Omani children to date. For example, a search for manuscripts using the terms Oman and
(GCC), Oman’s sister countries, were limited (Abdul-Rasoul, 2012; Ng et al., 2011a). The GCC countries include a political and economic association of six countries including Saudi Arabia, United Arab Emirates, Kuwait, Qatar, Bahrain, and Oman. They are homogenous in many aspects of origin, culture, traditions, language, geographic characteristics, and economic status (Torstrick & Faier, 2009). The 2016 Global Nutrition Report (International Food Policy Research Institute, 2016) indicated that these six countries were among the top 20 with the largest percentages of overweight and obesity in adults out of 190 countries around the world.
Also, countries in the GCC have witnessed a rapid increase in childhood obesity
(Musaiger, 2011; Osman et al., 2004). A recent review indicated that the prevalence of obesity was 8 to 9% among Saudi and Kuwaiti preschoolers and up to 40 to 46% among Kuwaiti
adolescents (Ng et al., 2011a). One literature review identified some of the contributing factors, which included family history, sedentary lifestyle, urbanization, increased income, family dietary patterns, poor knowledge about food choices, lack of physical activity, and the perception of greater weight as a sign of high social class and beauty (Abdul-Rasoul, 2012). Also, other organizational factors including policies related to nutrition and physical activity practices in the school system were noted (Abdul-Rasoul, 2012). An additional search for manuscripts related to the risk factors of childhood overweight and obesity in the GCC was also inclusive of other Eastern Mediterranean countries (Mirmiran et al., 2010; Musaiger, 2004, 2011).
Therefore, a review of the literature was conducted using PubMed, Medline, and Google Scholar databases to find articles published from January 1, 2007, through January 1, 2017. The search terms used for each of the GCC countries included child, obesity, overweight, risk factor, and the countries name (i.e., Saudi Arabia, Kuwait, United Arab Emirates, Bahrain, Qatar,
examined childhood overweight or obesity risk factors, targeted children five to ten years old, and were conducted in either Saudi Arabia, Oman, United Arab Emirates (UAE), Qatar, Bahrain, or Kuwait. This review examined children in middle childhood (5 - 10 years of age), because research has indicated that interventions targeting children in middle childhood compared to adolescents may have better outcomes (Eccles et al., 1993; Erickson, 1982; Huston & Ripke, 2006; Partridge et al., 2008). There was a limited amount of published research conducted on childhood obesity in the GCC region. Therefore, to increase the number of eligible articles, studies focusing on children in middle childhood that also included other age groups were reviewed. Systematic reviews, literature reviews, meta-analysis, dissertations, and non-peer reviewed articles were excluded.
A total of 478 manuscripts were screened for eligibility (PubMed and Medline [n = 61]), Google Scholar [n = 417]). After screening the titles, a total of 33 manuscripts were retrieved for abstract screening (PubMed and Medline [n = 22]), Google Scholar [n = 11]). After reviewing the abstracts, 22 articles were excluded (PubMed and Medline [n = 11]), Google Scholar [n = 11]), because they did not meet inclusion criteria. These studies were excluded because the participants ages did not include children five to ten years of age (n = 8), the ages of the
Another study from the reference list was found to be eligible for review and so was added. Therefore, a total of eight manuscripts were available for review. A Prisma diagram detailing the search strategy for eligible articles for review is presented in Figure 2.1. Extraction of the primary author name, publication date, study design, study purpose, setting, sample details, data collection measures, and results was performed for each of the included manuscripts. Table 2.1 provides a summary of the study articles reviewed.
Figure 2.1. Prisma Diagram
The reviewed study manuscripts were published between 2010 and 2015, and all were cross-sectional. Among them, three were completed in Saudi Arabia (Al Alwan, Al Fattani, & Longford, 2013; Al-Hussein, Tamimi, Al Banyan, Al-Twaijri, & Tamim, 2014; Al-Muhaimeed, Dandash, Ismail, & Saquib, 2015), two in the Emirates (Al Junaibi, Abdulle, Sabri, Hag-Ali, & Nagelkerke, 2013; Ng et al., 2011b) and three in Kuwait (Al-Isa, Campbell, & Desapriya, 2010; Al-Refaee et al., 2013; Jackson, Al Hamad, Prakash, & Al Somaie, 2011). No eligible study articles were retrieved from Oman, Qatar or Bahrain.
Table 2.1. Reviewed Studies Author Date Design Purpose Setting Sample Measures Results Al-Alwan et al., 2013 Cross-sectional design
- To provide data about obesity and overweight prevalence - To assess the effect of education and economic status of the parents as risk factors to obesity
Public and private schools in Riyadh, Saudi Arabia - Gender: Male and Female
- Grade: Not reported
- Age: 6 - 16 years - n = 1212
Measures 1- Social and demographic variables
questionnaire: Pilot tested
Prevalence
1- World Health Organization (WHO) 2007 - Overweight: 21.5% male, 21.3% female, mean 21.4%
- Obesity: 17.4% male, 9.3% female, mean 13.4%
Risk Factors 1- Gender:
- A significant relationship between gender and overweight (p < 0.05) and gender and obesity (p < 0.05)
- Males are at higher risk of overweight (females OR = 0.6, p < 0.05) and obesity (females OR = 0.5, p < 0.05) compared to females
2- Age:
- A significant relationship between age and overweight (p < 0.05)
- Older children (12 years) are at higher risk of overweight compared to younger children (6 years) (Odd Ratio [OR] = 3.53, p < 0.05)
3- Income:
- A significant relationship between income and overweight (p < 0.05).
- High-income families are at higher risk for having overweight children compared to low-income families (OR = 3.38, p < 0.05) 4- Parental education:
- A significant relationship between father education level and overweight children (p < 0.05)
- A significant relationship between mother education level and both children overweight (p < 0.05) and obesity (p < 0.05)
Author
Date Purpose Design Sample Measures Setting Results
Al-Hussein et al., 2014
Cross-sectional design
- To estimate the prevalence of the
metabolic syndrome - To compare the usefulness of clinical morphometric measurements in assessing cardio-metabolic risk in children and adolescents
Residential areas for the Saudi National
Guard employees schools (Public) in Riyadh, Saudi Arabia.
- Gender: Male and Female
- Grade: 1st - 12th - Age: 6 - 17 years - n= 2149
Measures
Questionnaire, not specified
Prevalence
1- Center for Disease Control (CDC) - Overweight: 13.8%
- Obesity: 14.8% Risk Factors 1- Physical activity:
Daily sports activity significantly predicted a lower prevalence of obesity (OR = 0.5, p < 0.05), but not of overweight
2- Breakfast:
Obesity decreased in a linear fashion with increasing weekly frequency of taking breakfast (p < 0.05)
Al-Isa et al., 2010
Cross-sectional design
- To identify factors
associated with overweight and that of obesity among Kuwaiti elementary male school children aged 6−10 years
Not specified type of schools in Kuwait City, Kuwait
- Gender: Male - Grade: 1st - 5th - Age: 6 - 10 years - n= 662
Measures 1- Designed questionnaire to fulfill the study aim: not pilot tested
Prevalence
1- Cole et al., 2000 (International Obesity Task Force [IOTF])
- Overweight: 20.2% male - Obesity: 16.8% male Risk Factors
1- Age
Risk of overweight significantly higher among age eight (OR = 1.9, p < 0.05) and ten (OR = 2.1, p < 0.05) compared to six years
2- School level
Risk of overweight increased significantly among the fifth (OR = 2.8, p < 0.05) level compared to the first level
3-Chronic disease
The risk of overweight increased significantly among those with chronic disease (OR = 1.8, p < 0.05) compared to who had none
4- Brother’s weight status
Author
Date Purpose Design Sample Measures Setting Results
Risk of overweight (OR = 2.0, p < 0.05) and obesity (OR = 2.3, p < 0.05) increased significantly when father was not working compared to the group with a working father 6- Number of persons living at home Risk of overweight (OR = 2.6, p < 0.05) and obesity (OR = 2.1, p < 0.05) increased significantly with a high (≥ 11) number of persons living at home compared to the group with a low (1 - 6) number
6- Dental status
The risk of overweight (OR = 0.6, p < 0.05) and obesity (OR = 0.4, p < 0.05) decreased significantly among those with a history of dental caries and fillings compared to the group with healthy teeth
7- Dieting
Risk of overweight (OR = 0.4, p < 0.05) and obesity (OR = 0.5, p < 0.05) decreased among those who did not diet compared to the group who did
8- Number of times dieted and needing special nutritional program
The risk of overweight and obesity decreased significantly among those who dieted once compared to the group who did not need to diet and decreased among those who did not know they needed special diet program compared to the group who did
Al-Junaibi et al.,
2013
Cross-sectional design
- To estimate the prevalence and determinants of obesity in childhood and adolescence and their association with blood pressure (BP)
Public schools in Abu Dhabi, United Arab Emirates. - Gender: Male and Female
- Grade: 1st - 12th - Age: 6 - 19 years - n= 1035
Measures 1- IOTF questionnaire (dietary and eating
Prevalence 1- CDC
- Overweight: 11.6% male, 16.7% female, mean 14.2%
- Obesity: 21.4% male, 18.1% female, mean 19.8%
Risk Factors 1- Gender:
The proportion of overweight was significantly higher among females (p < 0.05) but not obesity (more in males)
Author
Date Purpose Design Sample Measures Setting Results
activities in the past seven days): culturally adapted but not re-tested 2- adapted
questions from the short version of the International Physical Activity
Questionnaire: A pilot study was conducted to establish the inter-rater reliability
Mean BMI percentiles significantly increased with age (p < 0.05)
3- Dairy:
Additional daily dairy consumption is associated with a reduction in BMI by 2.52 percentile points (p < 0.05)
4- Parental BMI:
Significant correlations between children’s BMI percentiles and their mother’s and father’s BMIs (p < 0.05)
5- Fruits (daily):
Significantly less in overweight/obesity female children compared to underweight/normal weight female children (p < 0.05)
6- Vegetables (daily):
Significantly less in overweight/obesity male and female children compared to
underweight/normal weight male and female children (p < 0.05)
7-Energy dense food:
Fast food significantly less in overweight /obesity male children compared to
underweight/normal weight male children (p < 0.05)
8- Screen time:
TV/computer (min) significantly less in overweight/ obesity female children compared to underweight/ normal weight female children (p < 0.05) but significantly more in overweight / obesity male children compared to
underweight/normal weight male children (p < 0.05)
9- Physical activity, family income: - No significant difference between
Author
Date Purpose Design Sample Measures Setting Results
Al-Muhaimeed et al., 2015
Cross-sectional design
- To determine the prevalence of overweight and compare it with the corresponding estimates from earlier
published data - To examine the association between children’s overweight status and parental and child characteristics
Public schools in Al-Qassim province, Saudi Arabia.
- Gender: Male and Female
- Grade: 1st – 4th - Age: 6-10 years - n= 874
Measures Designed questionnaire filled by parents: Pilot tested Prevalence
1- Cole et al., 2000 (IOTF)
- Overweight (Referred to both overweight and obesity): 11.7% male, 29.7% female
Risk Factors 1- Gender:
Overweight was significantly higher in girls than boys (p < 0.05)
2- Age:
A monotonic increase in the prevalence of overweight and obesity by age in boys but not in girls
3- Mother’s age:
Significantly associated with children’s overweight status (p < 0.05). Higher age higher risk, 41 - 50 years compared to younger (127 missing age data)
4- Mother’s education, mother’s employment, socioeconomic status:
Not significantly associated with children’s overweight status
5- Have breakfast at home, eat between meals, the number of meals/day, television watching (daily), walk daily:
Not significantly associated with children’s overweight status
6- Restaurant eating
Children with high-frequency intake (two or more times a week) are significantly at higher risk compared to zero frequency (OR = 2.41, p < 0.05)
7- Engagement in sports
Author
Date Purpose Design Sample Measures Setting Results
Al-Refaee et al., 2013
Cross-sectional design
- To screen for overweight using the BMI percentiles
Pediatric Outpatient Department at Adan Hospital, Al-Ahmadi
Governorate, Kuwait.
- Gender: Male and Female
- Grade: Not reported
- Age: 2-10 years - n= 361
Measures Not applicable
Prevalence 1- CDC
- Overweight (determined as risk for overweight equal to 85 - 94th percentile): 14.41%
- Obesity (determined as overweight equal or more than 95th percentile): 21.33%
Risk Factors 1- Gender:
Not significant overweight difference between the two genders (p < 0.05)
2- Age:
54 overweight children (70.13%) were above six years of age, while 23 overweight children (29.87%) where below six years of age, no significance testing
Jackson et al., 2010
Cross-sectional design
- To develop smoothed waist circumference percentiles - To examine the percentages of children, at each age, who had waist circumference that exceeded the 90th percentile -To examine the correlation between overall obesity and abdominal obesity
Not specified type of schools in Kuwait.
- Gender: Male and Female
- Grade: 1st - 12th - Age: 5 - 18.9 years
- n= 9593 Measures Not applicable
Risk Factors 1- Age:
BMI values (not mean) increased with age for both male and female children, no significance testing. The BMI means for ages eight, nine and ten years are higher than at other ages 2- Gender:
- Mean BMI values of male children are higher at most ages, no significance testing.
- Mean waist circumference of male
Author
Date Purpose Design Sample Measures Setting Results
Ng et al., 2011b
Cross-sectional design
- To estimate the prevalence of overweight, obesity, dietary, and activity patterns for adult females, children, and adolescents - To explore how some underlying factors are associated with the shift from a presumably healthier lifestyle to one linked with an advanced stage of the nutrition transition
Urban and rural households in United Arab Emirates.
- Gender: Male and Female
- Grade: Not reported
- Age: 6 - 18 years - n= 731
Measures
1- Physical activity with International Physical Activity Questionnaire: Pilot tested 2- Dietary intake with 24-hour dietary recall: Pilot tested
Prevalence
Cole et al., 2000 (IOTF) - Overweight:
6 - 10 years: 9.1% male, 23.6% female 11 - 18 years: 16.2% male, 20.5% female - Obesity
6 - 10 years: 15.9% male, 17.1% female 11 - 18 years: 11.7% male, 19.7% female Risk Factors
1- Family income:
- The wealthiest households had the highest caloric intake, whereas households with the 40th to 60th percentile of wealth had the lowest average caloric intake
- Inactivity measured by time spent sitting increases with wealth until the 4th wealth quintile
Results Childhood Obesity Prevalence
obesity among Saudi, Emirati, and Kuwaiti children age 6-to-10 years was 14.2% among male children and 25% among female children (Al-Isa et al., 2010; Al-Muhaimeed et al., 2015; Ng et al., 2011b). These rates suggest a higher incidence of overweight and obesity among female children compared to male children. Table 2.2 provides more detailed data about the prevalence of overweight and obesity among children age 6-to-10 years in Saudi Arabia, Emirates, and Kuwait.
Table 2.2. Prevalence of Overweight and Obesity among Children Ages 6-to-10 Years Old in Some GCC Countries
Study Author, Year (Country) Overweight Obesity Al-Isa et al., 2010 (Kuwait) - 20.2% Male - 16.8% Male Al-Muhaimeed et al., 2015 (Saudi Arabia) - 11.7% Male
- 29.7% Female Ng et al., 2011b (Emirates) - 9.1% Male
- 23.6% Female
- 15.9% Male - 17.1% Female
Children Risk Factors for Obesity
Three categories of risk factors for developing childhood obesity were retrieved from this review. These included risk factors related to individual characteristics, familial characteristics and lifestyle behaviors.
Individual characteristics. A significant relationship between obesity and individual characteristics including age, gender, and health status were reported for children of the GCC countries (Al Alwan et al., 2013; Al-Isa et al., 2010; Al Junaibi et al., 2013; Al-Muhaimeed et al., 2015; Al-Refaee et al., 2013; Jackson et al., 2011).
Body mass index (BMI) correlated significantly with age; as age increased, BMI
et al. (2013) found that 12-years old children from Saudi Arabia (n = 1,212) were at higher risk of developing overweight compared to six years old children (Odd Ratio [OR] = 3.53, p < .05). Al-Junaibi and colleagues (2013) found that in Emirati children age 6-to-19 years (n = 1,035) of age; the mean BMI percentiles significantly increased with age (p < .05). Furthermore, Al-Isa et al. (2010) examined 662 Kuwaiti male children and found that the risk of overweight was
significantly higher among children aged eight years (OR = 1.9, p < .05) and ten years (OR = 2.1, p < .05) compared to children six years of age. Al-Muhaimeed et al. (2015), Al-Refaee et al. (2013) and Jackson et al. (2010), reported findings related to the relationship between age and childhood obesity, however, they did not report a level of significance. Al-Refaee et al. (2013) reported that among participants who were overweight or obese (n = 52), 70% of them were between six and ten years of age and 30% of them were between two and six years of age. Al-Muhaimeed et al. (2015) documented an increase in overweight and obesity prevalence as age increased among male children age six to ten years old. Among the 9,593 Kuwaiti children age 5-to-19 years, BMI increased with age as well. However, the BMI means for ages eight, nine and ten years were higher than other ages (Jackson et al., 2010).
found that the prevalence of overweight and obesity was significantly higher among female participants age 6-to 10 years old (p < .05) compared to male participants age 6-to-10 years. Al- Junaibi and colleagues (2013) found that the prevalence of overweight was significantly higher among female participants (p < .05), but the prevalence of obesity was higher in male
participants compared to female participants. However, Al-Refaee et al. (2013) reported no significant relationship between gender and childhood obesity (p < .05).
In addition to age and gender, some health-related conditions were found to have a significant relationship with childhood obesity (Al-Isa et al., 2010). Al-Isa et al. (2010)
documented that children with a history of chronic disease were at a significantly higher risk of overweight (OR = 1.8, p < .05) compared to those with no history of chronic disease (Al-Isa et al., 2010). Interestingly, Al-Isa et al. (2010) also reported that children with a history of dental fillings for dental caries were at a significantly lower risk of overweight and obesity, (OR = 0.6, p < .05) and (OR = 0.4, p < .05) respectively, compared to children with healthy teeth who did not had a history of dental caries and fillings (Al-Isa et al., 2010).
Familial characteristics. Familial risk factors related to childhood obesity include parental BMI, brother’s weight status, family size, mother’s age, household income, parental level of education, and father’s working status (Al Alwan et al., 2013; Al-Isa et al., 2010; Al Junaibi et al., 2013; Al-Muhaimeed et al., 2015). A positive significant correlation between parental BMI (both maternal and paternal) and children’s age 6-to-19 years old and BMI
increased the risk of childhood overweight and obesity compared to having a smaller family size (i.e., 1 - 6) (Al-Isa et al., 2010). In the GCC region, the average family size in 2012 ranged between five and eight (Nakono, n.d.). Therefore, it is not uncommon for a family to have 11 or more members compared to societies such as in the United States or Europe.
The older the mother (i.e., 41 - 50 years) was also found to be a significant risk factor for developing childhood overweight (p < .05) compared to younger mothers (Al-Muhaimeed et al., 2015). It is important to note that a large amount of data (n = 127 out of n = 878) in the Al-Muhaimeed study (2015) reported the mother’s age was missing.
Family income was another significant risk factor for childhood obesity in the region. Children in high-income families were at three times higher risk of becoming overweight (OR = 3.38, p < .05) compared to low-income families (Al Alwan et al., 2013). This relationship has been clarified by Ng et al. (2011) who reported that the wealthiest households had the highest caloric intake and physical inactivity levels compared to less wealthy households, which may provide an explanation why these children were at a higher risk of becoming overweight. However, two other manuscripts reported that there was no significant association between family socioeconomic status and childhood obesity (Al Junaibi et al., 2013; Al-Muhaimeed et al., 2015).
Interestingly, high parental level of education was identified as a significant risk factor for the development of childhood overweight in the GCC region (Al Alwan et al., 2013). Al-Alwan et al. (2013) reported that children of mothers with a university degree were at three times higher risk of becoming obese (OR = 3.7, p < .05) compared to children of illiterate mothers (i.e., never been educated in a school system) (Al-Alwan et al., 2013). However, the risk of