Heterogeneous antiretroviral drug distribution and
HIV/SHIV detection in the gut of three species
Corbin G. Thompson1, Elias P. Rosen1, Heather M. A. Prince2, Nicole White1, Craig Sykes1, Gabriela de la Cruz3, Michelle Mathews3, Claire Deleage4, Jacob D. Estes4,5, Paige Charlins6, Leila R. Mulder6, Martina Kovarova3, Lourdes Adamson7, Shifali Arora2, Evan S. Dellon2,
Anne F. Peery2, Nicholas J. Shaheen2, Cynthia Gay2, David C. Muddiman8, Ramesh Akkina6,
J.Victor Garcia3, Paul Luciw7, Angela D. M. Kashuba1*
HIV replication within tissues may increase in response to a reduced exposure to antiretroviral drugs. Traditional approaches to measuring drug concentrations in tissues are unable to characterize a heterogeneous drug distri-bution. Here, we used mass spectrometry imaging (MSI) to visualize the distribution of six HIV antiretroviral drugs in gut tissue sections from three species (two strains of humanized mice, macaques, and humans). We measured drug concentrations in proximity to CD3+ T cells that are targeted by HIV, as well as expression of HIV or SHIV RNA
and expression of the MDR1 drug efflux transporter in gut tissue from HIV-infected humanized mice, SHIV-infected macaques, and HIV-infected humans treated with combination antiretroviral drug therapy. Serial 10-m sections of snap-frozen ileal and rectal tissue were analyzed by MSI for CD3+ T cells and MDR1 efflux transporter expression
by immunofluorescence and immunohistochemistry, respectively. The tissue slices were analyzed for HIV/SHIV RNA expression by in situ hybridization and for antiretroviral drug concentrations by liquid chromatography– mass spectrometry. The gastrointestinal tissue distribution of the six drugs was heterogeneous. Fifty percent to 60% of CD3+ T cells did not colocalize with detectable drug concentrations in the gut tissue. In all three species,
up to 90% of HIV/SHIV RNA was found to be expressed in gut tissue with no exposure to drug. These data suggest that there may be gut regions with little to no exposure to antiretroviral drugs, which may result in low-level HIV replication contributing to HIV persistence.
INTRODUCTION
The persistence of HIV despite treatment with combination anti retroviral therapy is the major obstacle to eradication of this disease, necessitating lifelong therapy in HIVinfected individuals. Rebound plasma viremia after treatment cessation is thought to be secondary to reactivation of latently infected memory T cell populations (1–4). However, it has been hypothesized that residual HIV replication from productively infected T cells within tissue reservoirs may also contribute to viral rebound upon treatment interruption (5).
The evidence for continued production of replicationcompetent virions within certain anatomical sites has been extensively reviewed (6, 7). Several tissue compartments, such as the central nervous system (8), male and female genital tracts (9, 10), peripheral lymph nodes (11), and gutassociated lymphoid tissue (GALT) (10), have been implicated as potential tissue reservoirs and have recently been characterized in nonhuman primate (NHP) models (12). The conse quences of persistent active HIV replication in GALT, such as prolonged immune dysregulation and incomplete CD4+ T cell reconstitution
during combination antiretroviral therapy, are different from the consequences in other anatomical compartments (13). The mechanisms underlying HIV persistence in tissue reservoirs like GALT are unclear, but suboptimal antiretroviral drug penetration into tissues has been suggested as one potential cause (14). Inadequate tissue ex posure to antiretroviral drugs may explain the persistence of HIV replication.
Traditional methods for measuring the penetration of small molecules into tissues are limited in their capacity to measure hetero geneity of drug distribution within tissues. Liquid chromatography– mass spectrometry (LCMS) analysis of tissue homogenates has been the gold standard for antiretroviral drug tissue analysis but provides only an aggregate concentration of drug over the entire tissue. If HIV replication occurs focally, for example, in a single lymphoid follicle, LCMS analysis may not accurately represent antiretroviral drug concentrations at the site of action. Some groups have isolated mononuclear cell populations from tissues before performing LCMS (14). Although this method is an improvement over analysis of tissue homogenates, it does not fully account for drug lost during mononuclear cell isolation (15) and cannot distinguish between mononuclear cell populations from different sites within the tissue.
Mass spectrometry imaging (MSI) can be used to quantitate small molecules at discrete tissue sample locations while maintaining spatial information across the entirety of a sectioned tissue sample, which allows the analyte distribution within a sample to be visualized (16, 17). An advantage of MSI is the ability of this method to spatially correlate antiretroviral drug distribution with sites of potential HIV replication in serial tissue sections. Focal HIV RNA expression in tissue areas with low antiretroviral drug concentrations could indi cate areas where there is active viral replication.
1Division of Pharmacotherapy and Experimental Therapeutics, University of North Carolina at Chapel Hill, Chapel Hill, NC, USA. 2School of Medicine, University of North Carolina at Chapel Hill, Chapel Hill, NC, USA. 3Division of Infectious Diseases, Center for AIDS Research, University of North Carolina at Chapel Hill, Chapel Hill, NC, USA. 4AIDS and Cancer Virus Program, Frederick National Laboratory for Cancer Research, Leidos Biomedical Research Inc., Frederick, MD, USA. 5Vaccine and Gene Therapy Institute, Oregon Health & Science University, Beaverton, OR, USA. 6Department of Microbiology, Immunology and Pathology, Colorado State University, Fort Collins, CO, USA. 7Department of Pathology, Microbiology and Immunology, School of Veterinary Medicine, University of California, Davis, Davis, CA, USA. 8W.M. Keck FTMS Laboratory for Human Health Research, Department of Chemistry, North Carolina State University, Raleigh, NC, USA.
In addition to advancing our understanding of how antiretroviral drugs become distributed in tissues, MSI can provide information about whether antiretroviral drug distribution in tissues differs among preclinical animal models and between animals and humans. Although the development of any new therapeutic agent requires testing in animal models, efficacy end points may differ if the within
tissue drug distribution is different be tween the animal models and humans.
Here, we used MSI to visualize the distribution of antiretroviral drugs from several therapeutic classes in gastro intestinal tissues from HIVinfected humanized mice, SHIV (simian/human immunodeficiency virus)–infected ma caques, and HIVinfected human sub jects. We assessed the colocalization of antiretroviral drugs with HIV target cells and viral RNA expression. Then, we determined the extent to which antiretroviral drug distribution was associated with potential sites of viral replication. We also evaluated antiret roviral drug distribution in the context of drug efflux transporter expression by gut epithelial cells.
RESULTS
Demographics of patients in clinical study
Between April 2016 and August 2017, a total of five HIVinfected women taking some combination of tenofovir disoproxil fumarate/emtricitabine, efavirenz, ataza navir, raltegravir, and maraviroc com pleted the clinical study (NCT02641444; summary demographics are shown in table S1). Participants had a median age of 53 years and a median body mass index (BMI) of 39.1; four of five women were African American. Menopause sta tus was evenly distributed with two women premenopause and three women post menopause. All five participants had been HIV positive for >5 years (median, 18 years) and had been on their current combina tion antiretroviral drug therapy regimen for a median of 8 years. Participants had wellcontrolled HIV infection as evi denced by undetectable (<50 copies/ml) plasma viremia and high CD4 T cell counts (median, 753 cells/mm3). A single
adverse event (grade 1 headache) was observed.
Antiretroviral drug penetration in ileal and rectal tissue
Plasma and tissue combination antiret roviral therapy concentrations measured by LCMS in this study and our previous study (18) were used to generate tissue penetration ratios for each drug in ileum and rec tum biopsies obtained by colonoscopy from five HIVinfected par ticipants (table S2). In human ileum tissue, penetration of tenofovir was >10 times higher compared to ileum tissue in mice or NHPs (P = 0.007; table S2) (18). Penetration of tenofovir, efavirenz, atazanavir,
Cholesterol
Cholesterol Cholesterol Tenofovir
Tenofovir
Mouse Human
Tenofovir Emtricitabine
Emtricitabine Atazanavir Efavirenz Raltegravir
C D E
G
F H I J
K L
M N
O P Q R
S
CD3 CD3
T U V
A B
Macaque
3 mm
3 mm 3 mm
Lumen
CD3 Mucosa
raltegravir, and maraviroc into human ileum was two to sevenfold higher compared to the ileum of mice (P < 0.05) and was similar to penetration of the ileum of NHPs (table S2) (18). Penetration of tenofovir into the human rectum was >10 times greater compared to the rectum of mice (P = 0.003). Penetration of efavirenz, atazanavir, raltegravir, and maraviroc was 2 to 10fold higher in human rectum compared to mouse rectum (P < 0.05) and was similar to the penetra tion into the rectum of NHPs (table S2) (18).
Heterogeneous antiretroviral drug distribution in gut tissue from three species
Heterogeneous distribution of antiretroviral drugs was observed in 10m gut tissue sections from two strains of humanized mice,
12 macaques (6 uninfected and 6 SHIVinfected) and 5 HIVinfected humans. Representative images of antiretroviral drug distribution in the three species are shown in Fig. 1. Images of endogenous choles terol were included to delineate tissue orientation (Fig. 1A). In un infected macaques, tenofovir (Fig. 1B) and emtricitabine (Fig. 1C) showed disparate drug distribution patterns, with tenofovir having the highest signal in the lumen of the ileum, and low but consistent penetration into the mucosa and outer muscle layer of the ileum. In contrast, emtricitabine concentrations were below the detection limit of our MSI technique. Consistent with our previously published data (19), the distribution of efavirenz was heterogeneous through out the ileum and rectum of uninfected macaques and was localized primarily to the mucosal layer (Fig. 1D). Conversely, raltegravir was localized to the lumen of the ileum and rectum of uninfected macaques with less penetration into the mucosal layer (Fig. 1E). We next investigated the localization of CD3+ T cells in the ileum and rectum of uninfected macaques (Fig. 1, G to J). Fourteen percent to 29% of all cells in the macaque ileum were calculated to be CD3+ T cells (Fig. 1F). Differences between the distribution of antiretroviral drugs and the localization of CD3+ T cells were observed in the un infected macaque ileum and rectum.
Representative images of the gut tissue distribution of tenofovir in an HIVinfected humanized mouse are shown in Fig. 1 (K to N). Compared to uninfected macaque gut tissues, antiretroviral drug distribution was more heterogeneous in the gut tissue of two humanized mouse strains: the huHSCRag (n = 36) and bone marrow– liver–thymus (BLT) (n = 13) humanized mouse models. Raltegravir
and emtricitabine could not be detected by infrared matrixassisted laser desorption electrospray ionization (IRMALDESI) in any gut tissue slices from either strain of humanized mouse, despite detection of drug concentrations in mouse plasma and tissue by LCMS. We observed fewer detectable human CD3+ T cells in the HIVinfected humanized mouse gut tissue samples (1 to 3% of cells were CD3+ T cells;
Fig. 1M) due to the limited reconstitution of human T cells into this compartment, particularly in the case of the huHSCRag mice (20). Figure 1N shows the overlay of tenofovir with CD3+ T cells, reveal ing that the low tenofovir signal had limited colocalization with the signal for CD3+ T cells.
Representative images for antiretroviral drug distribution in gut biopsies from HIVinfected individuals are shown in Fig. 1 (O to V). There were detectable concentrations of tenofovir and emtricitabine in the plasma (tenofovir, 36 to 236 ng/ml; emtricitabine, 63 to 612 ng/ml) and gut tissue biopsies (tenofovir, 1596 to 17,820 ng/g; emtricitabine, 146 to 2762 ng/g) measured by LCMS. However, concentrations of these two drugs could only be detected sporadi cally in the gut biopsy samples by MSI, even before correcting for potential blood contamination using heme. In contrast, efavirenz, raltegravir, atazanavir, and maraviroc were detected in all human ileal and rectal biopsy samples with a broad distribution throughout the mucosa and submucosa.
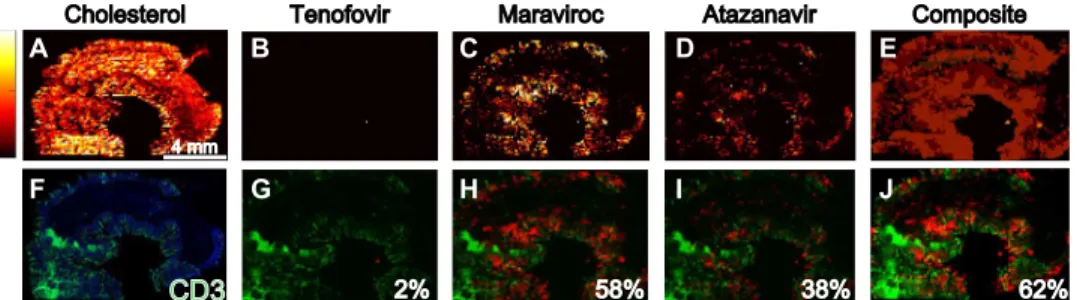
Given that these drugs are given in combination for maximal antiviral efficacy, we combined discrete maps of antiretroviral drug distribution to visualize overall drug concentrations in macaque gut tissue and then inspected the overlap with the localization of CD3+ T cells (Fig. 2). Figure 2 shows representative MSI images
assessing the extent to which antiretroviral drug combinations colocalized with CD3+ T cell expression measured in adjacent tissue
sections of a single SHIVinfected macaque ileum. MSI images for each anti retroviral drug in the same tissue slice are shown in Fig. 2 (A to D), with a composite image representing total drug distribu tion in Fig. 2E. The proportion of CD3+ T cells that colocalized
with each drug is shown in Fig. 2 (G to I), and the proportion of CD3+ T cells colocalizing with any of the antiretroviral drugs is
shown in Fig. 2J. In this tissue slice, about 60% of CD3+ T cells co localized with the distribution of either maraviroc or atazanavir, leaving 40% of the cell population unexposed to drug or exposed to drug concentrations below the limit of detection (LOD) (estimated MSI LODs: 708 fg per voxel for maraviroc and 1428 fg per voxel for atazanavir). The proportion of CD3+ T cells colocal ized with each antiretroviral drug in il eal and rectal biopsies from humanized mice, macaques, and humans is shown in table S3. In both the ileum and rec tum, tenofovir and emtricitabine distri bution overlapped the least with CD3+ T cell localization compared to the other antiretroviral drugs, but the variability was large for all species (0 to 80% cover age). These data were confounded by the lower sensitivity of MSI regarding detection of tenofovir and emtricitabine (estimated MSI LOD: 3372 fg per voxel for tenofovir and 5026 fg per voxel for emtricitabine) and did not account for intracellular phosphorylation of these
Cholesterol Tenofovir Maraviroc Atazanavir Composite
2%
4 mm
58% 38% 62%
CD3
H I J
B C D E
A
F G
Fig. 2. Incomplete antiretroviral drug and CD3+ T cell colocalization in macaque ileum. Representative images
drugs to their active metabolites (tenofovir diphosphate and emtric itabine triphosphate).
Table 1 summarizes the proportion of CD3+ T cells that were not exposed to any antiretroviral drug for the two humanized mouse strains, macaques, and humans. No differences were observed be tween infected and uninfected mice and macaques, and so, these data were combined for analysis. In both the ileum and rectum, ma caque and human showed the broadest CD3+ T cell coverage with me
dian proportions of T cells colocalized to an antiretroviral drug of 0.5 to 0.6 (Table 1). CD3+ T cells in the ileum and rectum of huHSC
Rag mice, which represented 80% of all T cells, colocalized with maraviroc and atazanavir but not the other drugs (table S2). Human, macaque, and BLT humanized mice all had a higher proportion of CD3+ T cells colocalizing with each antiretroviral drug in the ileum
and rectum than did huHSCRag mice (P < 0.01). No differences were seen in the distribution of CD3+ T cells between the ileum
and rectum for any species (P > 0.05).
Correlation of viral RNA expression with antiretroviral drug distribution
Next, we determined whether the incomplete overlap of CD3+
T cells with antiretroviral drug distribution in ileum and rectum was associated with HIV or SHIV RNA expression in these tissues. MSI images of CD3+ T cell and drug distribution were coregistered
with viral RNA images obtained from in situ hybridization (ISH) at matching image resolution. HIV or SHIV RNA expression was localized into discrete clusters within the submucosa of the ileum and rectum of all three species (fig. S1A, inset). Figure 3 shows rep resentative MSI overlay images of antiretroviral drug distribution and viral RNA expression in SHIVinfected macaque ileum. The MSI images showed areas of viral RNA expression (Fig. 3, G to J) that did not overlap with drug distribution (Fig. 3, B to E). How ever, this effect was not seen consistently with all antiretroviral drugs. Emtricitabine and tenofovir were found primarily where no viral RNA was located (Fig. 3, G and H), whereas maraviroc and atazanavir were found where a large proportion of viral RNA was expressed (Fig. 3, I and J; proportion of viral RNA colocalized to drug, 0.9 and 0.7, respectively).
Penetration of antiretroviral drugs into the macaque ileum as a function of the in vitro IC90 (90% maximal inhibitory concentration)
values for each drug is shown in Fig. 3 (K to N). Emtricitabine and tenofovir were present at concentrations below their respective IC90 values (Fig. 3, K and L, respectively, red); very few tissue
regions had antiretroviral drugs above this threshold (green). Given that the MSI LODs for emtricitabine and tenofovir were lower than the IC90 values, all areas of a tissue section where these drugs were
not measured were assumed to have concentrations below the IC90.
Conversely, maraviroc, efavirenz, and atazanavir concentrations were primarily above their IC90 values. The distribution of individual drugs
localized to regions of viral RNA expression is shown in Fig. 3 (O to R). Many of the tissue regions where emtricitabine and tenofovir were
colocalized with viral RNA expression were at concentrations below the IC90 values for these drugs; maraviroc and atazanavir concen
trations remained above this threshold in most cases. There were, however, several tissue regions where maraviroc and viral RNA expression was colocalized at subIC90 concentrations of drug
(Fig. 3Q).
Table 2 shows the extent of anti retroviral drug distribution com pared to viral RNA expression for HIVinfected humanized mice, SHIVinfected macaques, and HIVinfected human patients. Unlike our results for CD3+ T cell distribution, the localization of viral RNA
expression with drug distribution was high (median values, 10 to 100%), with the ileum and rectum of some mice demonstrating complete overlap for one or more anti retroviral drugs (after correction for potential blood contamination based on the heme b signal; Table 2). However, observed variability was also high, with overlap ranging from 0 to 100%, depending on the species (Table 2). For huHSC Rag humanized mice, viral RNA expression and drug distribution overlap were lower than for BLT humanized mice and macaques (0% versus 50 to 90%; P < 0.01; Table 2). Results in the ileum and rectum were similar for all species.
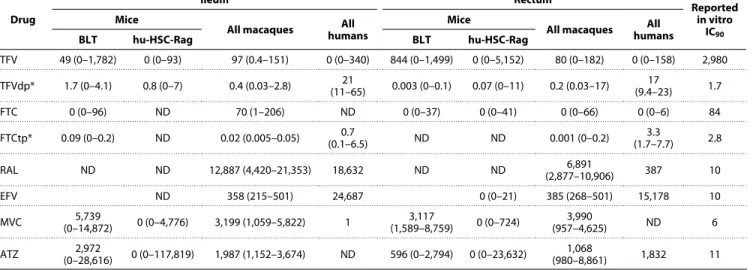
Table 3 summarizes the calculated concentrations for each anti retroviral drug closest to the region of peak viral RNA expression
measured by MSI. These concentrations surpassed in vitro IC90
values for most of the drugs except for tenofovir and emtricitabine, which were not detected in many samples. The lack of detection of emtrici tabine and tenofovir, which was consistent across species and between ileum and rectum, may reflect the limitations of MSI because these drugs achieved high tissue concentrations when mea sured with LCMS (21, 22). Tenofovir and emtricitabine concentra tions in serial tissue slices were more frequently detected by LCMS than by MSI but were still below their respective IC90 values. Tenofovir
diphosphate and emtricitabine triphosphate measured by LCMS showed different detection rates in ileum and rectum, with tenofovir diphosphate being readily detected and emtricitabine triphosphate being infrequently detected in the three species. Efavirenz and raltegravir were only sporadically detected in the humanized mice (efavirenz, 12%; raltegravir, 35%) despite being readily detectable in macaques and humans (100%) at concentrations that greatly exceeded reported IC90 values. Maraviroc and atazanavir were detected
Table 1. Percent CD3+ T cells not colocalizing with any antiretroviral drug. Data are median and range.
BLT (n = 13) hu-HSC-Rag (n = 36) Macaque (n = 12) Human (n = 5) P
Ileum 50 (10–100) 100 (20–100) 40 (10–90) 40 (30–50) <0.01
Rectum 40 (10–100) 100 (20–100) 50 (20–80) 40 (20–70) <0.01
Table 2. Percent viral RNA expression colocalizing with antiretroviral drug. Data are median and range.
BLT (n = 7) hu-HSC-Rag (n = 18) Macaque (n = 6) Human (n = 5)* P
Ileum 10 (0–100) 0 (0–100) (40–90)80 90 (80–90) <0.01
Rectum 50 (20–100) 0 (0–100) (20–80)60 (100–100) <0.01100
with the greatest frequency across species (>80%), with the highest con centrations detected in the ileum and rectum of mice and macaques.
Drug efflux transporter expression and antiretroviral drug distribution
Because drug efflux transporters are known to play a role in the tissue distribution of antiretroviral drugs and have been previously quantified in mouse and macaque tissues (18), we next assessed the potential impact of these efflux transporters by evaluating their distribution compared to the distribution of antiretroviral drugs as quantified by Pearson correlations. Figure 4 shows representative images of the overlap in antiretroviral drug distribution and multi drug resist ance protein 1 (MDR1) efflux transporter expression in mouse, macaque, and human ileum. Figure 4 (B to E) shows heme corrected MSI images for four different drugs, each showing a distinct distribution pattern in uninfected macaque ileum. When assessed in vitro in a previous study, raltegravir, atazanavir, and maraviroc showed affinity for MDR1 efflux transporter proteins (23). In this study, efavirenz distribution did not appear to be affected by the expression or localization of MDR1 efflux transporters in macaque ileum, because the two variables were not colocalized (r = 0.02; Fig. 4I); efavirenz appeared to have crossed the gut mucosa and accumulated in adipose tissue. Conversely, raltegravir accumulated on the luminal surface of the macaque ileum mucosa with limited
penetration into the submucosa (Fig. 4E) and colocalized moderately with MDR1 efflux transporters (r = 0.3; Fig. 4J). Similarly, tenofovir (Fig. 4B) showed colo calization with MDR1 efflux transporters (Fig. 4G) in macaque ileum despite a lack of evidence supporting tenofovir as a substrate for these proteins.
Representative images of ileum tissue slices from HIVinfected mice and HIV infected humans are shown in Fig. 4 (K to N and O to V, respectively). MDR1 efflux transporter expression was detected extensively along the luminal surface of mouse gut epithelial cells with lowto moderate colocalization with antiretro viral drugs (r range, −0.1 to 0.5).
DISCUSSION
Here, we assessed the distribution of antiretroviral drugs in gut tissues across three species and measured the distribu tion relative to CD3+ T cells and ex
pression of HIV or SHIV RNA. Despite dosing with combination drug therapy to a pharmacokinetic steady state, 40 to 60% of CD3+ T cells remained unexposed
to antiretroviral drugs in gut samples from all three species. The limitations of using conventional methods for small molecule quantitation in tissue (e.g., LCMS analysis of whole tissue homo genates) have been acknowledged pre viously (15, 24), and different models of heterogeneous antiretroviral drug distribution in tissue have been proposed (5). Our data highlight the advantages of using MSI for characterizing tissue pharmacology. We have shown here that antiretroviral drug exposure in some areas where HIV target cells reside may be very small. This is particularly relevant when drawing inferences about target concentrations for antiretroviral drug effi cacy, because any proposed drug concentration would need to be achieved in every HIVinfected cell or HIV target cell.
Our use of CD3+ T cells to assess antiretroviral drug exposure in
the entire T cell population versus a more targeted evaluation of CD4+ T cells is a major limitation of our study. Our approach over
estimated the number of actual HIVinfected cells or HIV target T cells. Our attempts to identify the smaller CD4+ T cell subset were
complicated by a high background signal that made discrete cellular identification impossible. However, given that about 50% of the CD3+ T cell population did not appear to be exposed to antiretroviral drug and CD4+ T cells represent about 50% of the total T cell popu
lation in the gut mucosa (25, 26), we predict that some of these unexposed T cells were also CD4+ T cells. This assumption is supported
by our data showing that viral RNA expression occurred in discrete clusters spread throughout lymphoid aggregates within the ileum and rectum of all three species. Our finding of viral gene expression in the gut during antiretroviral drug therapy is consistent with pre vious publications (27, 28) and is not surprising given the relatively
Cholesterol
Viral RNA Drug/viral RNA overlay
Complete drug distribution
Drug colocalized to viral RNA only
Emtricitabine Tenofovir Maraviroc Atazanavir A
F G
K
O P Q R
L M N
H I J
B C D E
0% 0% 90% 70%
4 mm
short duration of drug treatment administered to the mice and macaques in our study. However, our study design was such that we could identify all potential areas of viral replication early during drug treatment in the animals and could determine overlap with drug concentrations. Future work will need to evaluate the relationship between drug exposure and viral gene expression in gut tissues after longterm suppression of plasma HIV RNA by antiretroviral drug therapy. We attempted to address this limitation by examining gut samples from HIVinfected women who had been on combined anti retroviral drug therapy for at least 5 years and who showed suppres sion of viral loads for more than 1 year. Viral RNA was detected in two of five rectum samples, where 100% of viral RNA was colocalized with at least one drug. We found that antiretroviral drugs, when detectable, were well above reported in vitro IC90 values, suggesting
that the drug concentrations may have been sufficient to inhibit HIV/SHIV replication. However, because the drug distributions were not homogeneous and T cells moved within tissues, viral replication could still have occurred.
The lack of virus detection in plasma or development of drug resistance during prolonged combined antiretroviral drug therapy in many HIVinfected patients does not support the local tissue viral replication hypothesis (29). It is possible that ongoing viral replication occurs in small pockets of gut tissue and is held in check by high antiretroviral drug concentrations in other tissue regions or in plasma. This is supported by several studies demonstrating the detection of replicationcompetent HIV DNA in a wide array of tissues collected from HIVinfected patients on combined antiretroviral drug therapy with a suppressed plasma viral load (30, 31). Whereas HIV DNA is a more relevant marker of the latent HIV reservoir, it cannot be ruled out that some proportion of this DNA is undergoing tran scription to RNA and eventually is being translated into viral proteins. Given the widespread detection of HIV DNA in tissues, if even a small proportion (<1%) of total HIV DNA led to production of replication competent virions, then our hypothesis that viral replication occurred
in isolated pockets of gut tissue surrounded by efficacious concen trations of antiretroviral drugs would be reasonable.
With our MSI approach, we only captured a static point in time, which did not reflect the dynamic movement of T cells within GALTs. These T cells might be exposed to adequate drug concentrations as they migrate through GALTs, but as they move from areas of high to low drug concentrations, they may end up exposed to much lower intracellular drug concentrations. A future goal of our work is to use MSI to capture intracellular concentrations of antiretroviral drugs in individual T cells.
Although our detection of efavirenz, atazanavir, maraviroc, and raltegravir in gut tissues from three species was robust, we were un able to adequately determine the distribution of tenofovir and emtricitabine, which did not exceed their respective IC90 values in
most gut samples that we examined. Given that the sensitivity of our MSI method was lower for tenofovir and emtricitabine than the other antiretroviral drugs we tested, these data must be interpreted with caution. In addition, the active intracellular metabolites of these compounds (tenofovir diphosphate and emtricitabine triphosphate) could not be quantified by MSI because preparing tissue slices re sulted in their degradation. Therefore, although we quantified these drug metabolites by LCMS, we did not know the spatial resolution of these drug metabolites in the gut tissue samples. Possibly, these drug metabolites were present in greater abundance and in different distribution patterns than their parent compounds. This may be the case as in a previous study tenofovir diphosphate and emtricitabine triphosphate gut concentrations were high enough after daily oral administration to prevent rectal sexual transmission of HIV (32). Because MSI technology continues to evolve, we anticipate that our detection limits for these drugs will improve, as will our ability to measure stable drug metabolite concentrations in tissues without compromising their distribution.
Our work also shows the potential contribution of drug efflux transporter protein expression in the gut to differences in antiretroviral
Table 3. Drug concentrations proximate to viral RNA. Data are median and range. Conversion from ng/ml to ng/g was performed using an assumed tissue density of 1.06 g/ml. IC90 values for each drug are reported from the following references: tenofovir (55), tenofovir diphosphate (56), emtricitabine (57), emtricitabine triphosphate (58), efavirenz (59), maraviroc (60), atazanavir (61), raltegravir (62). ND, analyte not detected in any tissue; TFV, tenofovir; TFVdp, tenofovir diphosphate; FTC, emtricitabine; FTCtp, emtricitabine triphosphate; RAL, raltegravir; EFV, efavirenz; MVC, maraviroc; ATZ, atazanavir.
Drug
Ileum Rectum Reported
in vitro IC90
Mice
All macaques humansAll Mice All macaques humansAll
BLT hu-HSC-Rag BLT hu-HSC-Rag
TFV 49 (0–1,782) 0 (0–93) 97 (0.4–151) 0 (0–340) 844 (0–1,499) 0 (0–5,152) 80 (0–182) 0 (0–158) 2,980 TFVdp* 1.7 (0–4.1) 0.8 (0–7) 0.4 (0.03–2.8) (11–65)21 0.003 (0–0.1) 0.07 (0–11) 0.2 (0.03–17) (9.4–23)17 1.7
FTC 0 (0–96) ND 70 (1–206) ND 0 (0–37) 0 (0–41) 0 (0–66) 0 (0–6) 84
FTCtp* 0.09 (0–0.2) ND 0.02 (0.005–0.05) (0.1–6.5)0.7 ND ND 0.001 (0–0.2) (1.7–7.7)3.3 2.8
RAL ND ND 12,887 (4,420–21,353) 18,632 ND ND (2,877–10,906)6,891 387 10
EFV ND 358 (215–501) 24,687 0 (0–21) 385 (268–501) 15,178 10
MVC (0–14,872)5,739 0 (0–4,776) 3,199 (1,059–5,822) 1 (1,589–8,759)3,117 0 (0–724) (957–4,625)3,990 ND 6
ATZ (0–28,616)2,972 0 (0–117,819) 1,987 (1,152–3,674) ND 596 (0–2,794) 0 (0–23,632) (980–8,861)1,068 1,832 11
drug distribution. There were different degrees of colocalization of MDR1 efflux transporter protein expression with the different an tiretroviral drugs (Fig. 4). For example, the higher colocalization of MDR1 with raltegravir suggested that the MDR1 transporter may have acted as a barrier to raltegravir distribution into the gut mucosa from the gut lumen (33, 34). The MDR1 efflux transporter appeared to be less important for efavirenz distribution as indicated by the lower colocalization and lower concentration of efavirenz in the gut
submucosa. Raltegravir, but not efavirenz, is a known substrate for the MDR1 efflux transporter (35). With the small number of mice and macaques investigated in this study and the large interanimal variability in MDR1 transporter expression, the colocalization data were often not statistically significant (P > 0.05).
Previous work has shown that HIV infection can alter expression of drug transporters by as much as threefold (36) and that HIV infection can alter several pharmacokinetic variables such as intestinal
Cholesterol Tenofovir Emtricitabine Efavirenz Raltegravir Macaque
Cholesterol Maraviroc Mouse
Cholesterol
Human
Tenofovir Emtricitabine Efavirenz A
3 mm
F
K
M N S T U V
L O P Q R
G H I J
B C D E
r = 0.19
r = 0.24 r = 0.01 r = 0.01 r = 0.02
r = 0.12 r = 0.02 r = 0.30
3 mm 3 mm
absorption and drug metabolism that may affect antiretroviral drug distribution in tissues (37). Although the antiretroviral drugs exam ined here are known to use several of the drug efflux transporters that are altered during infection (e.g., raltegravir by MDR1), HIV/ SHIV infection did not contribute substantially to drug distribution in ileal or rectal tissues in our study. It is possible that our animals were not infected for long enough for these changes to become apparent (36), but our data do suggest that uninfected animals can be used to assess antiretroviral drug distribution.
Our study has a number of limitations including the technological limitations of MSI and the need for markers of antiretroviral drug efficacy. We generated data from 10m tissue slices. The lack of antiretroviral drug detection in some of these tissue slices despite detection with traditional LCMS methods can be explained by the decreased sensitivity of the IRMALDESI instrumentation that we used. The relationship between sensitivity and image spatial resolu tion when using MSI has been noted (24). Compared to LCMS, the LODs for IRMALDESI for antiretroviral drugs in tissues are up to 10fold higher, resulting in decreased sensitivity for detection of some antiretroviral drugs. The inherent decrease in sensitivity with MSI can be explained, in part, by the small tissue area ablated with each laser pulse. Given that each laser pulse ablates a 100m area at 10m thickness, the tissue volume per analysis is up to 100fold
less than that analyzed by LCMS using tissue homogenates. In addition, although we demonstrated that tissue architecture could be identified in each tissue slice, our limited sampling of gut tissue may have led to some drug distribution being overlooked. We collected tissues at the end of the drug dosing interval, but tissue penetration of antiretroviral drugs may have been higher or more homogeneous at other pharmacokinetic time points. However, we minimized any sampling confounding by dosing mice and monkeys with drug to plasma steadystate conditions. Total tissue drug concentrations under steadystate conditions are less variable across the dosing interval compared to plasma and so are less likely to differ based on the time of tissue collection (38, 39).
At sampling locations where potential blood contamination was present, we used MSI detection of the blood marker heme b to correct our measurements. This may have resulted in an overcorrection particularly in mouse and human tissues. We attempted to correct this by applying this blood contamination correction to MSI, immuno histochemistry (IHC), and ISH images. The potential contribution from remnant blood to antiretroviral concentrations measured in tissue homogenates further illustrates the limitation of using LCMS to measure drug concentrations, because there is no capacity to assess proportional antiretroviral drug concentrations in blood by this method.
Although the RNAscope ISH method used here has improved specificity compared to traditional ISH for detecting HIV/SHIV specific gene expression (40) and the frequency of viral RNApositive cells may be in good agreement with fluorescence detection of virusproducing cells (41), the aggregate viral RNA detection we obtained may overestimate viral replication by capturing virions trapped on follicular dendritic cells in B cell follicles. Further, the association between cellassociated RNA measured before drug treatment interruption and timing of viral rebound has been demon strated in other studies (41), but we were not able to discriminate between cellassociated RNA and free virions in our study. By cor relating antiretroviral drug distribution to gut regions where active virions could be produced, our results may represent a worstcase
scenario. We attempted to overcome this limitation by staining all virusinfected tissues for the viral protein markers p27 (macaque tissue) or p24 (humanized mice and human tissue); however, we were un able to detect these two viral proteins with enough signal to perform a robust analysis with our drug concentration data. Currently, we are investigating measurements of downstream components of the HIV life cycle by ISH and IRMALDESI MSI.
We compared antiretroviral drug concentrations to their indi vidual IC90 values without consideration for the synergistic effects
of antiretroviral drugs in combination (Table 3). The antiretroviral drugs evaluated here may have exceeded efficacious concentrations due to the presence of other active drugs at the same gut tissue loca tions, but we were unable to make those comparisons. This has direct relevance for measuring the proportion of CD3+ T cells
exposed to at least one antiretroviral drug (Fig. 2 and table S2). Our analysis makes a distinction between CD3+ T cells that are not ex
posed to drug and those that are exposed to at least one drug, but assessments of the whole drug combination regimen could not be performed. Future work will use the MSI signal from endogenous metabolites and lipids to segment and categorize histological features in each tissue (42–45) to allow for crossexperiment comparisons between the whole drug regimens.
The antiretroviral drug concentrations measured in this study rep resent total rather than unbound drug, whereas drug efficacy is driven by free drug concentrations at the site of action (46). The extent of protein binding and thus free drug concentrations can differ between plasma and tissues for antiinfective agents (46, 47). In some cases, estimates of the free drug in tissues can be accurately extrapolated from plasma drug concentrations (48, 49), but direct measurement of unbound tissue concentrations of drug provides the most useful data for efficacy. Strategies such as ultrafiltration or microdialysis have been used by others to measure unbound drug concentrations in tissues directly (50).
We did find some viral RNAexpressing cells in gut tissue that were not located close to measurable amounts of drug, despite adequate (>IC90) exposure elsewhere in the tissue. This does not prove
a causal relationship between suboptimal antiretroviral drug expo sure and ongoing viral replication given that we likely overestimated both of these variables, but it does suggest the feasibility of applying MSI to elucidate HIV persistence in gut tissue and potentially other tissues.
MATERIALS AND METHODS Study design
9 of 13
subjects were selected on the basis of the regimen they were currently taking. No element of this study was blinded.
Animal models
We used three animal models from two species: the huHSCRag (n = 36) and BLT (n = 13) humanized mouse models and a rhesus macaque NHP model (n = 12). Detailed descriptions of the animals used for this study, including infection and dosing information, as well as plasma concentrations, have been reported elsewhere (18). Briefly, female humanized mice from both models were dosed orally for 6 to 10 days with one of several antiretroviral regimens (table S4). In addition, male rhesus macaques (Macaca mulatta) were dosed for 10 days with tenofovir and emtricitabine (both subcutaneously) and orally with either maraviroc + atazanavir or efavirenz + ralte gravir. Antiretroviral doses, routes of administration, and duration of therapy were chosen to mimic commonly used treatment doses in these models and achieve pharmacokinetic steadystate conditions for all agents.
About onehalf the animals in each dosing cohort were infected with HIV (humanized mice) or SHIV (macaques) to assess the rela tionship between antiretroviral tissue disposition and potential ongoing HIV infection using HIVBal D7 (huHSCRag mice), HIVJRcsf
(BLT mice), or RTSHIVmac239 (macaques) as previously described
in detail (18). Animals were euthanized and underwent necropsy about 24 hours after the final antiretroviral dose. Plasma was collected, and tissues were removed from the body, cut into two about equal sized pieces, and snapfrozen on dry ice. All animal experiments were performed in accordance with locally approved institutional animal care and use committee (IACUC) protocols.
Clinical trial design and subject demographics
This study enrolled five HIVpositive women between 18 and 65 years of age (inclusive) with intact gastrointestinal and genital tracts, who had undetectable plasma HIV RNA (<50 copies/ml) within 3 months preceding the study. Participants were recruited from the Infectious Diseases Clinic at University of North Carolina (UNC) Chapel Hill on the basis of receiving one of the study regimens (tenofovir diso proxil fumarate/emtricitabine as a fixed dose combination plus either efavirenz, raltegravir, maraviroc, or atazanavir) as part of their ongoing clinical care.
Subjects could not have a history of gastrointestinal disease (e.g., Crohn’s disease, irritable bowel syndrome, ulcerative colitis, diver ticulitis, and colon cancer) or have a history of gastrointestinal surgery. All subjects had a negative serum pregnancy test at screening and negative urine pregnancy tests on days of sampling and used at least one of the following methods of contraception from the screening visit through 72 hours before inpatient admission (at which time the women were asked to remain abstinent until after their followup visit): systemic hormonal contraceptive (oral, depot, transdermal, or implant), intrauterine device (IUD) placed at least 1 month be fore study enrollment, bilateral tubal ligation (sterilization), vasec tomized male partners, or condom with spermicide.
Additional inclusion criteria included BMI of about 18 to 37 kg/m2, a total body weight of >45 kg (99 lbs), and evidence of a personally signed and dated informed consent document indicating that the subject has been informed of all pertinent aspects of the trial and was willing and able to comply with scheduled visits, treatment plan, laboratory tests, and other trial procedures. Further, women could not be receiving any known CYP3A4 inducers (rifampin, carbamazepine, and
St. John’s wort) or inhibitors [ketoconazole, non–dihydropyridine (DHP) calcium channel blockers, and macrolide antibiotics] other than those contained in their HIV regimen for at least 6 months before enrollment. Subjects had to be willing to abstain from sexual intercourse, douching, and all intrarectal objects and products for at least 72 hours before enrollment until study completion; have a negative hepatitis B surface antigen test as documented on screening laboratories; could not be actively involved in the conception process; were able to swallow pills; and have no allergies to any component of the study products (i.e., bowel preparation regimen).
Participants were excluded if they had any clinically relevant abnormal screening evaluations or relevant comorbidities, untreated sexually transmitted infections (rectal chlamydia or gonorrhea, syphilis, and trichomonas), were pregnant or lactating, or tested positive for any drugs of abuse that would increase study risks. Additional ex clusion criteria included receiving CYP3A4 inducers or inhibitors (other than those contained in their HIV regimens) in the previous 6 months, receiving any investigational drug in the last 4 months, history of inflammatory bowel conditions (Crohn’s disease), or not using an approved method of contraception (systemic hormonal contraception, IUD, bilateral tubal ligation, vasectomized male partner, condom plus spermicide, femaleonly sex partners, or 3 months of abstinence before enrollment).
Further, subjects were excluded if they had a history of febrile illness within 5 days before enrollment, active hepatitis B infection as determined by positive hepatitis B surface antigen (HBsAg), any laboratory chemistry or hematology result grade 3 or greater according to the Division of AIDS (DAIDS) Laboratory Grading Tables, history of regular alcohol consumption exceeding 14 drinks [1 drink = 5 ounces (150 ml) of wine or 12 ounces (360 ml) of beer or 1.5 ounces (45 ml) of spirits] per week, participation in a clinical trial involving rectal biopsies within 6 months preceding enrollment, blood donation of about 1 pint (500 ml) within 56 days before dosing, history of sensitiv ity to heparin or heparininduced thrombocytopenia, or allergy to latex or was unwilling or unable to comply with the dietary and concomitant drug restrictions in regard to study drug administra tion as outlined in the study procedures and prohibited medication sections. All study activities were approved by the UNC Biomedical Institutional Review Board, and all activities were conducted in accordance with all International Council for Harmonisation of Technical Requirements for Pharmaceuticals for Human Use (ICH) and Good Clinical Practice (GCP) industry standards. All partici pants provided written informed consent before study procedures were performed.
Before the procedure, a single 3ml paired blood sample was taken and processed for plasma. During the procedure, 10 biopsies each were taken from the terminal ileum and rectum. Subjects were monitored for 6 hours after the procedure, before discharge, with followup visits within 14 days of discharge. An analysis of previous studies from our group in subjects receiving raltegravir or darunavir who underwent similar procedures showed an about 30% decrease in both gut tissue and plasma concentrations (as measured by tradi tional LCMS) versus subjects who had not received a complete bowel preparation.
Safety assessments were conducted on each day of the inpatient visit and during followup. Adverse events were evaluated using a standard questionnaire, with grading according to the DAIDS ad verse events grading table version 2.0. Women of childbearing po tential were screened for pregnancy at each visit.
Human tissue collection
Ileal and rectal biopsies were collected during colonoscopy with Radial Jaw 4 large capacity biopsy forceps (Boston Scientific, Boston, MA). All tissues were immediately snapfrozen on dry ice, then placed in aluminum foil pouches, and stored at −80°C until analysis. Whole blood was collected in 3ml EDTA tubes and centrifuged at 3000 rpm for 10 min at 4°C. Plasma was aliquoted into a 2ml cryovial and stored at −80°C until analysis.
Tissue slices
To generate serial sections for multimodal analysis, tissues were sliced frozen at 10m thickness using a cryostat (Leica Biosystems, Wetzlar, Germany) and thawmounted onto glass microscope slides in the following order: 8 slices for IHC, 2 slices for MSI (1 for analysis and 1 backup), 2 slices for LCMS, and 15 to 20 slices for ISH. Macaque tissues were mounted on optimal cutting temperature (OCT) compound and sliced individually; however, the small size of the mouse tissues and human biopsies (2 to 5mm cross sections) precluded this method. Instead, tissues were grouped by dosing cohort and mounted within a 2:1 gelatin carboxymethylcellulose gel block, which was snapfrozen and stored at −80°C. Dosing groups for mice each contained n = 6, and six tissues were included in a single gelatin block (e.g., six ileums from the atazanavironly dosing group in a single block and six rectums from the atazanavir only dosing group in a single gelatin block). For the human samples, ileum and rectum from all five women were included in single blocks (one block for ileum and one block for rectum). Each frozen gel block was mounted on OCT, sliced, and thawmounted, allowing for mounting and analysis of up to six mouse tissues simultaneously (51). Analysis of embedded and nonembedded tissues suggests that the gel embedding process does not alter antiretroviral distribution within tissues (fig. S1).
MSI and quantification
The glass microscope slide containing the thawmounted tissue was placed into the IRMALDESI MSI source chamber and maintained at −10°C. Relative humidity inside the chamber was reduced to <6% to allow for sample cooling without condensation of water vapor, and then humidity was increased to deposit a layer of ice across the entire stage. Tissues were ablated with two pulses of a midIR laser (IROpolette 2371, Opotek, Carlsbad, CA) with a 100m spotto
spot distance. Ablated molecules were ionized by orthogonal electro spray using 0.2% formic acid in 50:50 methanol water as an electrospray
solvent and sampled into a Thermo Fisher Scientific Q Exactive mass spectrometer (Bremen, Germany) for analysis in positive ion mode. Because the detection of certain analytes (e.g., tenofovir and efavirenz) was found to be increased in humans by probing for neg ative ions, polarity switching was used during these experiments using 5 mM ammonium acetate in 50:50 methanol water as the electrospray solvent. Raw data from each voxel were converted to the mzML format with MSConvert (ProteoWizard) and then to the imzML format for interrogation using MSiReader, which allows for generation of images of antiretroviral distribution across the tissue slice (52, 53).
Absolute quantitation of antiretroviral concentration was achieved by spotting a series of calibration standards (of known antiretroviral concentration) onto a nondosed “blank” tissue slice from identical tissue matrices from each species (ileum or rectum; Bioreclama tionIVT, Baltimore, MD). Each calibration standard (100 nl) was spotted onto the tissue, allowed to air dry, then placed inside the source chamber, and analyzed in an identical manner to the samples. A new calibration tissue was analyzed every day that sample analysis occurred to account for interday variability in run conditions (electro spray stability, relative humidity, thickness of ice layer, etc.). Calibration tissues were analyzed in MSiReader, where the summed voxel inten sity over each calibration spot was plotted against the known anti retroviral concentration to generate a calibration curve. The slope and intercept of this curve was applied to the summed voxel intensity value for each antiretroviral over the entire area of the correspond ing sample to generate an absolute concentration (15). To quantify antiretroviral concentration in mouse tissues, a single calibration spot was applied to a blank mouse tissue and analyzed in tandem with macaque calibration tissues. The voxel intensity value for the mouse calibration spot was used to adjust the slope and intercept of the NHP calibration curve (to account for response differences between tissues from different species), and the adjusted calibration curve was applied to mouse samples. Resulting ng/slice concentra tions were converted to g/g using the known area of each tissue slice measured in MSiReader, depth of each tissue (10 m), and an assumed tissue density of 1.06 g/ml.
For the purposes of inclusion in this manuscript, “representative” tissue sections were selected primarily on the basis of morphology, slice quality, and quality of IRMALDESI image. For example, when possible, we include tissue slices that show a complete cross section from gut lumen through the muscularis, with minimal tissue folding or tearing in the IHC or ISH slice. However, our results are based on analysis of all slices analyzed regardless of aesthetics, and we report descriptive statistics (median and range) for all variables. To assess interslice variability, we a priori took multiple consecutive slices from each tissue for IRMALDESI analysis, with the idea that several backup slices would be available in the event of experimental error. Several of these backup slices were analyzed and compared to the original data, with good qualitative correla tion in distribution.
LC-MS analysis and comparison to MSI
was diluted with 50:50 methanol/water. For tissues, 1 ml of icecold 70:30 acetonitrile/water was added to sample tubes containing a serial 10m section from each sample. Samples were sonicated for
10 min with calibration standards and quality control samples. Separa tion for both matrices occurred on a Shimadzu highperformance liquid chromatography system and an AB SCIEX API 5000 mass spectrometer (AB SCIEX, Foster City, CA, USA) equipped with a turbo spray interface. The dynamic range of the plasma assay ranged from 1 to 20,000 ng/ml for tenofovir, atazanavir, and efavirenz; 1 to 8000 ng/ml for maraviroc; and 8 to 20,000 ng/ml for emtricitabine and raltegravir. The dynamic range for tissues is from 0.1 to 50 ng/ml. The precision and accuracy of the calibration standards and QC samples were within the acceptable range of 15%. Tissue concentra tions were reported as ng/slice and converted to g/g using an as sumed tissue density of 1.06 g/ml.
Immunofluorescence and IHC
Drug efflux transporter localization was identified using IHC as described previously (18). Dual immunofluorescence (IF) on frozen humanized mouse and NHP sections was performed on the Bond fully automated slide staining system (Leica Microsystems) using Bond Polymer Refine Detection kit (DS9800). Slides were allowed to sit at room temperature for 30 min and then fixed in 10% formalin for 15 min. They were then placed in Bond wash solution (AR9590). Antigen retrieval was done at 100°C in Bond epitope retrieval solu tion 2 (pH 9.0; AR9640) for 10 min. Staining was performed first using CD4 1F6 antibody (clone BC/1F6, Abcam) at 1:50 dilution for 1 hour with Bond polymer and postprimary reagents and Cy5 fluo rochrome (PerkinElmer) for 15 min. Antigen retrieval was done at again 100°C in Bond epitope retrieval solution 2 (pH 9.0; AR9640) between protocols. Slides were then stained with CD3 (clone LN10, Leica) ReadytoUse antibody for 15 min and Dako Envision mouse secondary for 30 min. Cy3 fluorochrome (PerkinElmer) was applied for 15 min. IF slides were counterstained with Hoechst 33258 (Invitrogen, Carlsbad, CA) and mounted with ProLong Gold antifade reagent (P36934, Life Technologies).
In situ hybridization
Fifteen to 20 serial sections from each tissue were evaluated for HIV/SHIV RNA expression using RNAscope ISH (54). Before beginning the RNAscope procedure, slides were fixed in 4% para formaldehyde at 4°C for 15 min followed by dehydration with graded ethanol washes (50, 70, and 100% ethanol for 5 min each). Detailed methodology for the RNAscope procedure is described elsewhere (54). Briefly, slides were boiled to retrieve epitopes in P2 buffer (Advanced Cell Diagnostics, ACD) for 30 min followed by peroxi dase blocking for 10 min at room temperature, rinsing with double distilled water, dehydrating with 100% ethanol for 5 min, and then airdrying. Slides were then incubated for 10 to 20 min at 40°C with protease digestion solution from ACD (P3). After protease diges tions, slides were rinsed with double distilled water and incubated with HIV clade B or SIVmac239 ACD probes for 2 hours at 40°C. Slides
were then washed in 0.5× ACD wash buffer and incubated in am plification reagents according to the RNAscope 2.5 HD detection protocol (54). All reagents used in the hybridization process were obtained from Advanced Cell Diagnostics (Newark, CA) and used according to the manufacturer’s protocol with some minor adapta tions (54). After counterstaining slides with hematoxylin, slides were mounted in clear mount and coverslipped. Staining was per
formed on all 15 to 20 slides to ensure detection of positive signal. Results were compared across slides, and little variability was found. Thus, colocalization was performed using the tissue slice most adjacent to the slice used for MSI.
Image colocalization
A schematic of the colocalization workflow is shown in fig. S3. For a given sample (fig. S3A), MSiReader was used to export voxel intensity matrices for cholesterol, heme, and each antiretroviral of interest across the entire tissue slice into MATLAB; IF, ISH, and IHC samples were scanned as described above and downsampled to match the resolution of the MSI data (fig. S2). Offtissue re sponse was eliminated by using cholesterol signal to mask anti retroviral response such that only ontissue signal was shown. To eliminate the confounding effect of antiretrovirals contained with in the vasculature, antiretroviral responses were again masked on the basis of heme distribution (fig. S3B) to show only the anti retroviral signal that localized outside the microvasculature. To ensure that MSIderived images and IF/IHC/ISH images were appropriately aligned before colocalization, coregistration was per formed by rigid transformation of the moving cholesterol image using the background 4′,6diamidino2phenylindole (DAPI) stain as a fixed reference (fig. S3C). The resulting transform matrix was then applied to all antiretroviral images so that every antiretroviral image was identically oriented. Last, the hemecorrected trans formed antiretroviral images were overlayed with the variable of interest (CD3, MDR1, etc.) to generate a fused image (fig. S3D) containing both the antiretroviral (in red) and the variable of interest (in green).
To evaluate concentrations proximate to relevant variables, antiretroviral intensity from a given voxel was multiplied by the total slice concentration determined from the quantitative experiments and corrected on the basis of the proportional contribution of that voxel to the total antiretroviral signal detected in the slice. Descriptive statistics (median and range) were generated on the basis of these pervoxel antiretroviral concentrations for areas of colocalization with the variable of interest (CD3, RNA, etc.). Pervoxel concentra tions were then thresholded on the basis of the maximum in vitro IC90 value reported in the package insert for each drug to generate
binary images, showing antiretroviral concentration above and below the IC90 value. Where ranges of IC90 values could be found,
we used the highest value to provide conservatives estimates of adequate antiretroviral exposure.
Statistical analysis
SUPPLEMENTARY MATERIALS
stm.sciencemag.org/cgi/content/full/11/499/eaap8758/DC1 Fig. S1. Effect of gelatin embedding on antiretroviral drug distribution. Fig. S2. Resolution matching of microscopy and MSI data.
Fig. S3. Image colocalization workflow. Table S1. Subject demographics.
Table S2. Human plasma and tissue antiretroviral drug concentrations. Table S3. Proportion of CD3+ T cells exposed to at least one antiretroviral drug. Table S4. Dosing of animals.
Data file S1. Individual-level data for tables.
REFERENCES AND NOTES
1. T. Chun, R. T. Davey Jr., D. Engel, H. C. Lane, A. S. Fauci, Re-emergence of HIV after stopping therapy. Nature 401, 874–875 (1999).
2. J. D. Siliciano, R. F. Siliciano, A long-term latent reservoir for HIV-1: Discovery and clinical implications. J. Antimicrob. Chemother. 54, 6–9 (2004).
3. D. Finzi, M. Hermankova, T. Pierson, L. M. Carruth, C. Buck, R. E. Chaisson, T. C. Quinn, K. Chadwick, J. Margolick, R. Brookmeyer, J. Gallant, M. Markowitz, D. Ho, D. Richman, R. Siliciano, Identification of a reservoir for HIV-1 in patients on highly active antiretroviral therapy. Science 278, 1295–1300 (1997).
4. R. Banga, F. A. Procopio, A. Noto, G. Pollakis, M. Cavassini, K. Ohmiti, J. M. Corpataux, L. de Leval, G. Pantaleo, M. Perreau, PD-1+ and follicular helper T cells are responsible for persistent HIV-1 transcription in treated aviremic individuals. Nat. Med. 22, 754–761 (2016).
5. R. Lorenzo-Redondo, H. R. Fryer, T. Bedford, E.-Y. Kim, J. Archer, S. L. Kosakovsky Pond, Y. S. Chung, S. Penugonda, J. G. Chipman, C. V. Fletcher, T. W. Shacker, M. H. Malim, A. Rambaut, A. T. Haase, A. R. Mclean, S. Wolinsky, Persistent HIV-1 replication maintains the tissue reservoir during therapy. Nature 530, 51–56 (2016).
6. J. K. Wong, S. A. Yukl, Tissue reservoirs of HIV. Curr. Opin. HIV AIDS 11, 362–370 (2016). 7. T. J. Cory, T. W. Schacker, M. Stevenson, C. V. Fletcher, Overcoming pharmacologic
sanctuaries. Curr. Opin. HIV AIDS 8, 190–195 (2013).
8. L. R. Gray, M. Roche, J. K. Flynn, S. L. Wesselingh, P. R. Gorry, M. J. Churchill, Is the central nervous system a reservoir of HIV-1? Curr. Opin. HIV AIDS 9, 552–558 (2014).
9. J. A. Politch, K. H. Mayer, S. L. Welles, W. X. O’Brien, C. Xu, F. P. Bowman, D. J. Anderson, Highly active antiretroviral therapy does not completely suppress HIV in semen of sexually active HIV-infected men who have sex with men. AIDS 26, 1535–1543 (2013). 10. S. Cu-Uvin, A. K. DeLong, K. K. Venkatesh, J. W. Hogan, J. Ingersoll, J. Kurpewski,
M. de Pasquale, R. D’Aquila, A. M. Caliendo, Genital tract HIV-1 RNA shedding among women with below detectable plasma viral load. AIDS 24, 2489–2497 (2010). 11. M. Popovic, K. Tenner-Racz, C. Pelser, H. J. Stellbrink, J. van Lunzen, G. Lewis, V. S. Kalyanaraman, R. C. R. P. Gallo, Persistence of HIV-1 structural proteins and glycoproteins in lymph nodes of patients under highly active antiretroviral therapy.
Proc. Natl. Acad. Sci. U.S.A. 102, 14807–14812 (2005).
12. J. D. Estes, C. Kityo, F. Ssali, L. Swainson, K. N. Makamdop, G. Q. Del Prete, S. G. Deeks, P. A. Luciw, J. G. Chipman, G. J. Beilman, T. Hoskuldsson, A. Khoruts, J. Anderson, C. Deleage, J. Jasurda, T. E. Schmidt, M. Hafertepe, S. P. Callisto, H. Pearson, T. Reimann, J. Schuster, J. Schoephoerster, P. Southern, K. Perkey, L. Shang, S. W. Wietgrefe, C. V. Fletcher, J. D. Lifson, D. C. Douek, J. M. McCune, A. T. Haase, T. W. Schacker, Defining total-body AIDS-virus burden with implications for curative strategies.
Nat. Med. 23, 1271–1276 (2017).
13. C. G. Thompson, C. Gay, A. D. M. Kashuba, HIV persistence in gut-associated lymphoid tissues: Pharmacological challenges and opportunities. AIDS Res. Hum. Retroviruses 33, 513–523 (2017).
14. C. V. Fletcher, K. Staskus, S. W. Wietgrefe, M. Rothenberger, C. Reilly, J. G. Chipman, G. J. Beilman, A. Khoruts, A. Thorkelson, T. E. Schmidt, J. Anderson, K. Perkey, M. Stevenson, A. Perelson, D. Douek, A. T. Haase, T. W. Schacker, Persistent HIV-1 replication is associated with lower antiretroviral drug concentrations in lymphatic tissues. Proc. Natl. Acad. Sci. U.S.A. 111, 2307–2312 (2014).
15. T. J. Cory, L. C. Winchester, B. L. Robbins, C. V. Fletcher, A rapid spin through oil results in higher cell-associated concentrations of antiretrovirals compared with conventional cell washing. Bioanalysis 7, 1447–1455 (2015).
16. J. A. Barry, G. Robichaud, M. T. Bokhart, C. Thompson, C. Sykes, A. D. M. Kashuba, D. C. Muddiman, Mapping antiretroviral drugs in tissue by IR-MALDESI MSI coupled to the Q Exactive and comparison with LC-MS/MS SRM assay. J. Am. Soc. Mass Spectrom. 25, 2038–2047 (2014).
17. M. T. Bokhart, E. Rosen, C. Thompson, C. Sykes, A. D. M. Kashuba, D. C. Muddiman, Quantitative mass spectrometry imaging of emtricitabine in cervical tissue model using infrared matrix-assisted laser desorption electrospray ionization. Anal. Bioanal. Chem. 407, 2073–2084 (2015).
18. C. G. Thompson, J. K. Fallon, M. Mathews, P. Charlins, M. Mulder, L. Kovarova, N. Adamson, A. Srinivas, C. Schauer, P. Sykes, J. V. Luciw, R. Garcia, P. C. Akkina, A. D. M. K. Smith,
Multimodal analysis of drug transporter expression in gastrointestinal tissue. AIDS 31, 1669–1678 (2017).
19. C. G. Thompson, M. T. Bokhart, C. Sykes, L. Adamson, Y. Fedoriw, P. A. Luciw, D. C. Muddiman, A. D. M. Kashuba, E. P. Rosen, Mass spectrometry imaging reveals heterogeneous efavirenz distribution within putative HIV reservoirs. Antimicrob. Agents
Chemother. 59, 2944–2948 (2015).
20. R. Akkina, New generation humanized mice for virus research: Comparative aspects and future prospects. Virology 435, 14–28 (2013).
21. K. B. Patterson, H. A. Prince, E. Kraft, A. J. Jenkins, J. Nicholas, J. F. Rooney, M. S. Cohen, A. D. Kashuba, Penetration of tenofovir and emtricitabine in mucosal tissues: Implications for prevention of HIV-1 transmission. Sci. Transl. Med. 3, 112re4 (2011).
22. P. L. Anderson, V. Glidden, D. A. Liu, S. Buchbinder, J. R. Lama, J. V. Guanira, V. McMahan, L. R. Bushman, M. Casapia, O. Montoya-Herrara, V. G. Veloso, K. H. Mayer, S. Chariyalertsak, M. Schechter, G. Bekker, E. G. Kallas, R. M. Grant; iPrEx Study Team, Emtricitabine-tenofovir concentrations and pre-exposure prophylaxis efficacy in men who have sex with men. Sci. Transl. Med. 4, 151ra125 (2012).
23. O. Kis, K. Robillard, G. N. Chan, R. Bendayan, The complexities of antiretroviral drug-drug interactions: Role of ABC and SLC transporters. Trends Pharmacol. Sci. 31, 22–35 (2010). 24. S. Castellino, M. R. Groseclose, MALDI imaging mass spectrometry: Bridging biology and
chemistry in drug development. Bioanalysis 3, 2427–2441 (2011).
25. M. Mowata, J. L. Viney, The anatomical basis of intestinal immunity. Immunol. Rev. 156, 145–166 (1997).
26. S. A. Yukl, A. K. Shergill, V. Girling, Q. Li, M. Killian, L. Epling, P. Li, P. Kaiser, A. Haase, D. V. Havlir, K. McQuaid, E. Sinclair, J. K. Wong, Site-specific differences in T cell frequencies and phenotypes in the blood and gut of HIV-uninfected and ART-treated HIV + adults. PLOS ONE 10, e0121290 (2015).
27. T.-W. Chun, D. C. Nickle, J. S. Justement, J. H. Meyers, G. Roby, C. W. Hallahan, S. Kottilil, S. Moir, J. M. Mican, J. I. Mullins, D. J. Ward, J. A. Kovacs, P. J. Mannon, A. S. Fauci, Persistence of HIV in gut-associated lymphoid tissue despite long-term antiretroviral therapy. J. Infect. Dis. 197, 714–720 (2008).
28. C. F. Kelley, R. E. Haaland, P. Patel, T. Evans-Strickfaden, C. Farshy, D. Hanson, K. Mayer, J. L. Lennox, J. T. Brooks, C. E. Hart, HIV-1 RNA rectal shedding is reduced in men with low plasma HIV-1 RNA viral loads and is not enhanced by sexually transmitted bacterial infections of the rectum. J. Infect. Dis. 204, 761–767 (2011).
29. L. Shen, R. F. Siliciano, Viral reservoirs, residual viremia, and the potential of highly active antiretroviral therapy to eradicate HIV infection. J. Allergy Clin. Immunol. 122, 22–28 (2008). 30. S. L. Lamers, R. Rose, E. Maidji, M. Agsalda-Garcia, D. J. Nolan, G. B. Fogel, M. Salemi,
D. L. Garcia, P. Bracci, W. Yong, D. Commins, J. Said, N. Khanlou, C. H. Hinkin, M. V. Sueiras, G. Mathisen, S. Donovan, B. Shiramizu, C. A. Stoddart, M. S. McGrath, E. J. Singer, HIV DNA is frequently present within pathologic tissues evaluated at autopsy from combined antiretroviral therapy-treated patients with undetectable viral loads. J. Virol. 90, 8968–8983 (2016).
31. R. Rose, S. L. Lamers, D. J. Nolan, E. Maidji, N. R. Faria, O. G. Pybus, J. J. Dollar, S. A. Maruniak, A. C. McAvoy, M. Salemi, C. A. Stoddart, E. J. Singer, M. S. McGrath, HIV maintains an evolving and dispersed population in multiple tissues during suppressive combined antiretroviral therapy in individuals with cancer. J. Virol. 90, 8984–8993 (2016). 32. R. M. Grant, J. R. Lama, P. L. Anderson, V. McMahan, J. R. Lama, P. L. Anderson,
V. McMahan, A. Y. Liu, L. Vargas, P. Goicochea, M. Casapía, J. V. Guanira-Carranza, M. E. Ramirez-Cardich, O. Montoya-Herrera, T. Fernández, V. G. Veloso, S. P. Buchbinder, S. Chariyalertsak, M. Schechter, L. G. Bekker, K. H. Mayer, E. G. Kallás, K. R. Amico, K. Mulligan, L. R. Bushman, R. J. Hance, C. Ganoza, P. Defechereux, B. Postle, F. Wang, J. J. McConnell, J. H. Zheng, J. Lee, J. F. Rooney, H. S. Jaffe, A. I. Martinez, D. N. Burns, D. V. Glidden; iPrEx Study Team, Preexposure chemoprophylaxis for HIV prevention in men who have sex with men. N. Engl. J. Med. 363, 2587–2599 (2011).
33. K. Kassahun, I. Mcintosh, D. Cui, D. Hreniuk, S. Merschman, K. Lasseter, N. Azrolan, M. Iwamoto, J. A. Wagner, L. A. Wenning, Metabolism and disposition in humans of raltegravir (MK-0518), an anti-AIDS drug targeting the human immunodeficiency virus 1 integrase enzyme. Drug Metab. Dispos. 35, 1657–1663 (2007).
34. Y. Hashiguchi, A. Hamada, T. Shinohara, K. Tsuchiya, H. Jono, H. Saito, Role of P-glycoprotein in the efflux of raltegravir from human intestinal cells and CD4+ T-cells as an interaction target for anti-HIV agents. Biochem. Biophys. Res. Commun. 439, 221–227 (2013). 35. K. Kassahun, I. Mcintosh, D. Cui, D. Hreniuk, S. Merschman, N. Azrolan, M. Iwamoto,
J. A. Wagner, L. A. Wenning, Metabolism and disposition in humans of raltegravir (MK-0518). Pharmacology 35, 1657–1663 (2007).
36. O. Kis, S. Sankaran-Walters, M. T. Hoque, S. L. Walmsley, S. Dandekar, R. Bendayan, HIV-1 alters intestinal expression of drug transporters and metabolic enzymes: Implications for antiretroviral drug disposition. Antimicrob. Agents Chemother. 60, 2771–2781 (2016).