RTS,S MALARIA VACCINE EFFICACY NOT FOUND TO BE MODIFIED BY SPATIAL LOCATION OR ECOLOGICAL FACTORS DURING A PHASE III RANDOMIZED, CONTROLLED TRIAL IN LILONGWE, MALAWI
Griffin Bell1, Matthew Loop1, Michael Emch1, Jonathan Juliano1, Innocent Mofolo1,2, Portia Kamthunzi1,2, Gerald Tegha2, Marc Lievens3, Irving Hoffman1,2
(1) University of North Carolina at Chapel Hill, (2) UNC-Project Malawi, (3) GlaxoSmithKline
ABSTRACT Background
RTS,S was the first vaccine for Malaria approved for use by the European Medicines Agency and it is set to be administered to 360,000 children in Malawi, Ghana, and Kenya as part of a pilot implementation program in fall 2018. The efficacy of RTS,S was variable, possibly due to differences in transmission intensity, between the 11 sites and 7 countries participating in the 2009-2014 phase III trials. However, a within-site analysis examining environmental factors related to transmission intensity has yet to be conducted.
Methods
We used data from the phase III trial of RTS,S, which enrolled 1,578 infants (6-12 weeks) and children (5-17 months) living in the Lilongwe District in Central Malawi and followed them for up to 4 years. A global positioning system survey and an ecological questionnaire were used to collect household locations and characteristics in order to investigate whether spatial location or household ecological factors were associated with the efficacy of RTS,S. We used negative binomial regression models to assess the effect of the vaccine on number of malaria episodes. Results
Using data from 1189 (75.3%) of the phase III participants, we found that the location-specific malaria incidence varied over the study region from .072 to 2.11 estimated episodes per year. We found no evidence supporting the hypothesis that the efficacy of the RTS,S vaccine varied over the Lilongwe study region. We also found that malaria incidence was associated with grass roofs, certain window types, proximity to a waterway and low population density. However, we found no evidence supporting the hypothesis that these ecological variables impacted the efficacy of RTS,S.
Discussion
INTRODUCTION Background
Malaria draws its name from the miasma paradigm of the Middle Ages: ‘mal aria’ literally translates to ‘bad air.’ Of course, now we know that Malaria is a vector-borne eukaryotic parasite transmitted by the Anopholes mosquito. Being vector-borne, the parasite is tethered to regions which can support the mosquito. In 2016, malaria caused an estimated 216 million clinical episodes and 445,000 deaths, with an estimated 91% of these deaths occurring in Africa [1]. Not only does Malaria impact health, it impacts the economic development of endemic countries as well. According to renowned Columbia Economist Jeffrey Sachs, a 10% reduction in malaria from 1965 to 1990 corresponded to a 0.3% increase in annual economic growth, taking into account initial poverty, economic policy, tropical location and other factors [2].
Due to control efforts, the number of deaths due to malaria has been cut in half since the turn of the century [3]. In addition to current control efforts, public health practitioners now have a working vaccine; RTS,S, which is currently the only vaccine against malaria which has been approved for use by the European Medicines Agency [4]. RTS,S is given in three doses,
administered in one month intervals with an additional booster dose recommended to maximize efficacy. RTS,S is set to be administered to 360,000 children in Malawi, Ghana, and Kenya as part of a pilot implementation program in the fall of 2018. Children are primarily being targeted for vaccination as malaria tends to be more severe in children under 5, who account for around 70% of malaria deaths in Africa and worldwide [5].
RTS,S was shown to be 36.3% effective , in terms of relative risk reduction, against clinical malaria over a 24 month period in children aged 5-17 months receiving the 4 dose regimen during a phase III trial, which was conducted in 11 sites across 7 countries from 2009 to 2014 [6]. Despite its lower-than-expected efficacy, this vaccine could have an important public health impact when used in conjunction with other malaria prevention methods. RTS,S is a cost-effective control measure. Using mathematical modeling, one group estimated that a four dose schedule would avert one clinical case of malaria per every $25 spent [7].
intensity. We used spatial location and ecological variables as proxies for transmission intensity and examined whether there was variation of vaccine efficacy within the Lilongwe site. This study asked the following two questions: (1) Was there significant spatial variation in the total number of malaria episodes seen in the phase III trial in Lilongwe, Malawi? (2) Did the efficacy of the RTS,S malaria vaccine depend upon the location of the subject or certain ecological factors related to malaria incidence? We hypothesized that there would be spatial variation in malaria episodes and in vaccine efficacy and that certain ecological factors would modify the effect of the treatment.
METHODS
The study population included infants aged 6-12 weeks and children aged 5-17 months enrolled in the 2009-2014 phase III trial of RTS,S in Lilongwe, Malawi (n = 1578).
The phase III trial was double blind, observer blind, and individually randomized-controlled. Lilongwe was one site out of 11 in 7 countries. Participants were split based on age group, infant (6-12 weeks) or child (5-17 months), and then randomized into control (C3C), vaccine (R3C), and vaccine + booster (R3R) groups. All participants received 3 doses of the RTS,S vaccine or a control vaccine on months 0, 1, and 2 of follow up. They then received a booster or control vaccine on month 22 of follow up, 20 months after receiving the third dose of the base vaccine. Participants were tested for malaria every 6 months during follow up. Additionally, participants were able to come in for testing whenever they desired. If the participant was found to have malaria, they received treatment [6].
The outcome, an episode of clinical malaria, was defined as illness accompanied by an axillary temperature of at least 37.5°C and P. falciparum asexual parasitaemia (>5000 parasites per mm³), as seen by microscopy [6].
The key exposures of interest in this analysis were spatial location and ecological factors. The aspects of ecology taken into account were roof type, window type, population density, and distance to nearest river or stream.
each pair was worse, we removed the better window type to essentially create a ‘worst window type’ variable.
A raster of population density values from 2010 that were estimated over 100m by 100m (1 hectare) squares was obtained from WorldPop. Underlying raster values were extracted to subject household locations using QGIS. A waterway layer was extracted from OpenStreetMap using Overpass Turbo and the criteria waterway=stream or waterway=river. In order to calculate distance to nearest river values, point locations and a waterway layer were projected to WGS84 UTM36S in R and distances were calculated using rgeos::gDistance.
Potential Confounders
Age group was included since participant location and susceptibility to malaria were likely influenced by age.
Statistical Analysis
First, we calculated summary statistics in order to describe the sample. Next we determined if malaria incidence varied geographically over our study area. A negative binomial regression model was used in order to model the log of expected malaria count, ln(𝐸[𝑌]), over the trial period. An offset representing follow-up time, ln(𝑡𝑖𝑚𝑒𝑖), was used. This is equivalent to
modeling incidence, ln(𝐸[𝑌/𝑡𝑖𝑚𝑒𝑖]), with no offset. A spatial smoother, 𝑆, was included and is
analogous to a random intercept depending on geographic location. 1) ln(𝐸[𝑌𝑖]) = 𝛽0+ 𝑆𝑖+ ln(𝑡𝑖𝑚𝑒𝑖)
2) ln(𝐸[𝑌𝑖]) = 𝛽0+ 𝛽1𝑎𝑔𝑒𝑖+ 𝑆𝑖+ ln(𝑡𝑖𝑚𝑒𝑖)
Next, we determined if vaccine efficacy was associated with geographic location. We used a similar regression model, but we added in treatment effect as well as an interaction with treatment group and the spatial smoother.
3) ln(𝐸[𝑌𝑖]) = 𝛽0+ 𝛽1𝑎𝑔𝑒𝑖+𝛽2𝑡𝑟𝑡𝑖+𝑆𝑖 + 𝛽3𝑡𝑟𝑡𝑖 ∗ 𝑆𝑖+ ln(𝑡𝑖𝑚𝑒𝑖)
Next, we determined if our ecological variables were related to malaria incidence. This model included each of our ecological variables, a spatial random effect, and an interaction between age group and treatment group which was found to be significant by the RTS,S Clinical Trials
Partnership [6]. 4) ln(𝐸[𝑌𝑖]) =
𝛽0+ 𝛽1𝑎𝑔𝑒𝑖 +𝛽2𝑡𝑟𝑡𝑖+𝛽3𝑎𝑔𝑒𝑖 ∗ 𝑡𝑟𝑡𝑖 + 𝛽4𝑟𝑜𝑜𝑓𝑖 + 𝛽5𝑤𝑖𝑛𝑑𝑖+𝛽6𝑑𝑖𝑠𝑡𝑖+𝛽7𝑑𝑒𝑛𝑠𝑖+ 𝑆𝑖+ln(𝑡𝑖𝑚𝑒𝑖)
5) ln(𝐸[𝑌𝑖]) = 𝛽0+ 𝛽1𝑎𝑔𝑒𝑖+𝛽2𝑡𝑟𝑡𝑖+𝛽3𝑟𝑜𝑜𝑓𝑖+𝛽4𝑡𝑟𝑡𝑖∗ 𝑟𝑜𝑜𝑓𝑖 + ln(𝑡𝑖𝑚𝑒𝑖)
6) ln(𝐸[𝑌𝑖]) = 𝛽0+ 𝛽1𝑎𝑔𝑒𝑖+𝛽2𝑡𝑟𝑡𝑖+𝛽3𝑤𝑖𝑛𝑑𝑖+𝛽4𝑡𝑟𝑡𝑖∗ 𝑤𝑖𝑛𝑑𝑖+ ln(𝑡𝑖𝑚𝑒𝑖)
7) ln(𝐸[𝑌𝑖]) = 𝛽0+ 𝛽1𝑎𝑔𝑒𝑖+𝛽2𝑡𝑟𝑡𝑖+𝛽3𝑑𝑖𝑠𝑡𝑖+𝛽4𝑡𝑟𝑡𝑖 ∗ 𝑑𝑖𝑠𝑡𝑖 + ln(𝑡𝑖𝑚𝑒𝑖)
8) ln(𝐸[𝑌𝑖]) = 𝛽0+ 𝛽1𝑎𝑔𝑒𝑖+𝛽2𝑡𝑟𝑡𝑖+𝛽3𝑑𝑒𝑛𝑠𝑖+ 𝛽4𝑡𝑟𝑡𝑖∗ 𝑑𝑒𝑛𝑠𝑖+ ln(𝑡𝑖𝑚𝑒𝑖)
The parameters of each model described here were not estimated using traditional multivariable regression. Due to the complexity of the spatial term, the parameters were estimated using a thin plate regression spline, implemented in the ‘mgcv’ package in R. A spline is a method of
modeling outcomes as non-linear functions of location. It does this by minimizing the residuals of the fitted model with an additional penalty on the squared second derivative of the spatial surface. This effectively reduces the ‘wigglyness’ of the fitted model, reducing the impact that random noise might have on the model fit. For the fitting of a spatial random effect surface, this is helpful in attempting to recover the true underlying spatial process. The equation that the thin plate regression spline minimizes is of the form: 𝑔(𝑦, 𝑥, 𝑠) = (𝑦 − 𝑋𝛽)2+ 𝜆 ∫ (𝑓′′(𝑠))2 𝑑𝑠
𝑆
[8].
RESULTS
Study Participants
Participants were enrolled into either the control group (C3C), the vaccine group (R3C), or the vaccine and booster group (R3R). Thirty-seven participants were immediately lost to follow-up upon enrollment and one participant did not have geographic information (n=1540, 97.6% of the original sample). Twenty-four participants were geocoded to be outside the district of Lilongwe and were not considered in this analysis (n = 1516, 96.1%).
The analysis of the ecological survey data was done using only participants who completed a month 6 survey. Three hundred twenty-seven out of the remaining 1516 did not meet this
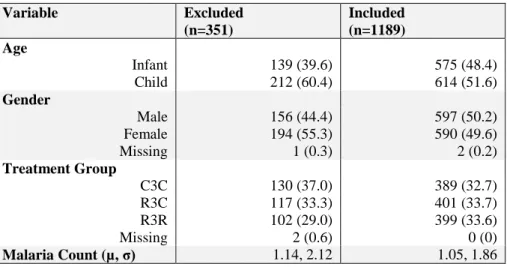
Table 1 – Excluded Population and Included Population
Variable Excluded
(n=351)
Included (n=1189) Age
Infant 139 (39.6) 575 (48.4)
Child 212 (60.4) 614 (51.6)
Gender
Male 156 (44.4) 597 (50.2)
Female 194 (55.3) 590 (49.6)
Missing 1 (0.3) 2 (0.2)
Treatment Group
C3C 130 (37.0) 389 (32.7)
R3C 117 (33.3) 401 (33.7)
R3R 102 (29.0) 399 (33.6)
Missing 2 (0.6) 0 (0)
Malaria Count (µ, σ) 1.14, 2.12 1.05, 1.86
Summary Statistics
A description of the final 1189 participants is displayed in Table 2. Note that distance to nearest waterway and population density are numeric variables and the values displayed are means rounded to the nearest hundredth. The other variables are categorical and the values displayed are counts and column percentages.
Table 2: Summary of Participants by Treatment Group
Variable C3C (n=389) R3C (n=401) R3R (n=399) All (n=1189) Age
Infant 193 (49.6) 188 (46.9) 194 (48.6) 575 (48.4)
Child 196 (50.4) 213 (53.1) 205 (51.4) 614 (51.6)
Gender
Male 193 (49.6) 196 (48.9) 201 (49.9) 597 (50.2)
Female 195 (50.1) 205 (51.1) 201 (49.9) 590 (49.6)
Missing 1 (0.3) 0 (0) 1 (0.3) 2 (0.2)
Roof Type
Metal sheet 263 (67.6) 270 (67.3) 280 (70.2) 813 (68.4)
Grass 126 (32.4) 131 (32.7) 119 (29.8) 376 (31.6)
Glass 178 (45.8) 183 (45.6) 205 (51.4) 566 (47.6)
Screen 30 (7.7) 44 (11.0) 28 (7.0) 102 (8.6)
Open 47 (12.1) 43 (10.7) 40 (10.0) 130 (10.9)
Plastic/paper/carton 56 (14.4) 65 (16.2) 51 (12.8) 172 (14.5)
Planks 44 (11.3) 28 (7.0) 24 (6.0) 96 (8.1)
No window 34 (8.7) 38 (9.5) 51 (12.8) 123 (10.3)
Distance to Nearest Waterway (km) 0.80 0.80 0.86 0.82
Population Density (per hectare) 49.69 49.57 45.93 48.39
Household locations for the participants within Lilongwe district are displayed in Figure 1a,b. The region in the blue box in Figure 1a corresponds to the region displayed in Figure 1b. From Figures 1a and 1b, we can see most observations fall within the city of Lilongwe; therefore, maps used for display will be of the area indicated in Figure 1b, although we will use all observations in Lilongwe district for modeling.
Figure 1a: Households in Lilongwe District Figure 1b: Households in Lilongwe City
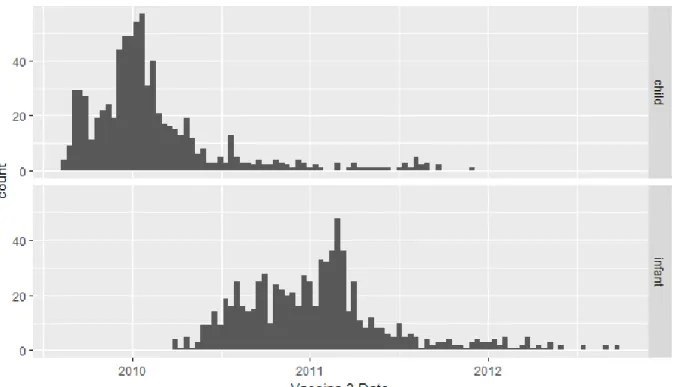
Figure 2a: Vaccine 3 Date by Age Group
Figure 3: Probability of Age = Infant
Spatial Location as a Proxy for Transmission Intensity
Figure 4a: Malaria Incidence Estimates
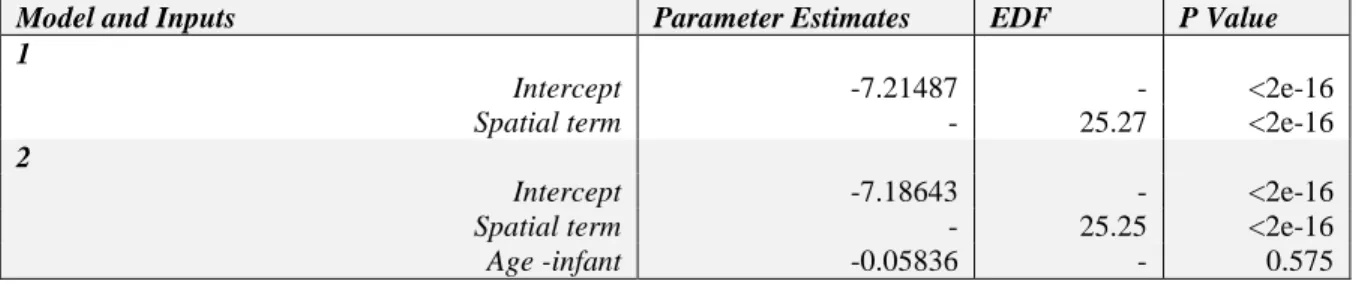
Table 3: Results of Models 1 and 2
Model and Inputs Parameter Estimates EDF P Value
1
Intercept -7.21487 - <2e-16
Spatial term - 25.27 <2e-16
2
Intercept -7.18643 - <2e-16
Spatial term - 25.25 <2e-16
Age -infant -0.05836 - 0.575
EDF stands for estimated degrees of a freedom. A higher EDF for our spatial term corresponds to a more complex modeled surface, suggesting that the spatial term is important to our analysis. Conversely, an EDF close to 0 suggests that the outcome varies very little by location. Thus, spatial location seems to be important in modeling malaria incidence.
The EDF value is the trace, or the sum of diagonal, of what is essentially the hat matrix for the spatial effect. The trace of a hat matrix is equivalent to its rank, which is the number of linearly independent columns of the hat matrix, thus, it can be thought of as the level of complexity needed to map the observed values to the fitted models. The higher the EDF, the more complex the fitted surface. The surface in Table 3 had an EDF of about 25, so it was fairly complex.
Spatial Location and Vaccine Efficacy
Figure 5a: Malaria Incidence by Treatment Group
Figure 5b: Follow-up by Treatment Group
This method is not optimal for a variety of reasons, the primary reason being that the scale of aggregation chosen is always subjective. This can lead to the ‘ecological fallacy,’ which is the assumption that because relationship holds at one spatial scale, it will hold at others as well. Instead, we can use a spatial random effect to predict malaria incidence. Figure 6 shows the malaria incidence estimates by treatment group in Lilongwe city using this method, controlling for age group.
Figure 6: Smooth Malaria Incidence by Treatment Group, Controlling for Age Group
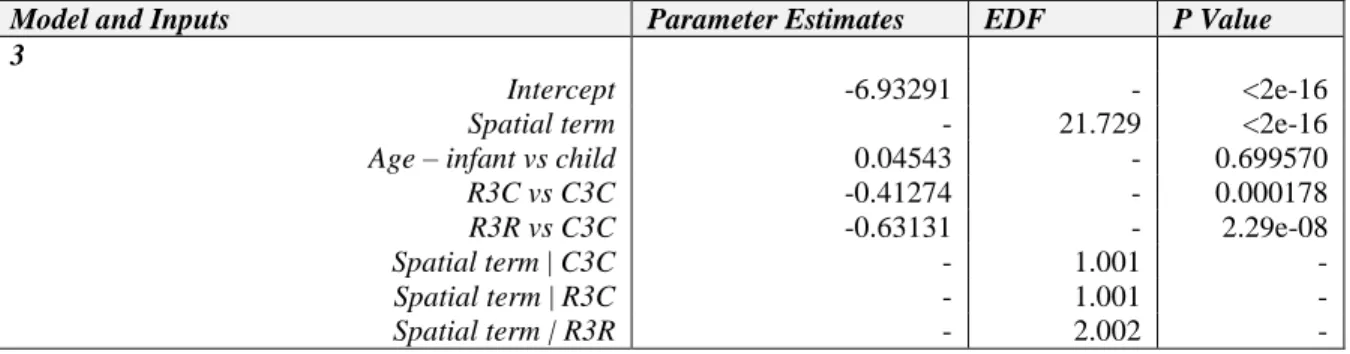
We can see here that the patterns of malaria incidence are extremely similar between treatment groups. These findings are supported by the results of model 3, shown in Table 4, which
Table 4: Results from Model 3
Model and Inputs Parameter Estimates EDF P Value
3
Intercept -6.93291 - <2e-16
Spatial term - 21.729 <2e-16
Age – infant vs child 0.04543 - 0.699570
R3C vs C3C -0.41274 - 0.000178
R3R vs C3C -0.63131 - 2.29e-08
Spatial term | C3C - 1.001 -
Spatial term | R3C - 1.001 -
Spatial term | R3R - 2.002 -
Ecological Variables as Proxies for Transmission Intensity
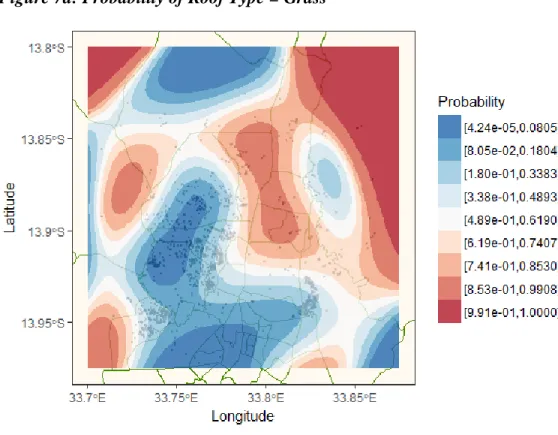
It is possible that using household characteristics better predict the risk of clinical malaria than spatial location within our study site, since they are specific to the individual participant’s immediate living environment. First we will describe the spatial distribution of roof type and window type. Figure 7a shows the estimations of roof type, generated using 𝐸[𝑟𝑜𝑜𝑓𝑖] = 𝑆𝑖 , assuming that roof type follows a binomial distribution. Figure 7b shows the estimations of window type, which are generated in the same matter, except window type is assumed to follow a multinomial distribution. Note that PPC is an abbreviation for plastic, paper, or carton.
Figure 7a: Probability of Roof Type = Grass
Figure 8a: Rivers in Lilongwe District Figure 8b: Rivers in Lilongwe City
Figure 9a: Population in Lilongwe District Figure 9b: Population in Lilongwe City
Table 5: Results from Model 4
Model and Inputs Parameter Estimates EDF P Value
4
Intercept -6.645567 - < 2e-16
Spatial term - 17.78 2.17e-10
Age – infant vs child -0.246525 - 0.114801
R3C vs C3C -0.488320 - 0.000945
R3R vs C3C -0.888004 - 1.47e-08
R3C | Age – infant 0.094420 - 0.647576
R3R | Age – infant 0.447045 - 0.038234
Roof type – grass vs metal 0.457757 - 1.05e-05
Window type – screen vs glass 0.259368 - 0.116373
Window type – open vs glass 0.304165 - 0.039550
Window type- plastic/paper/carton vs glass 0.364639 - 0.005849
Window type – planks vs glass 0.044985 - 0.791485
Window type – none vs glass 0.562385 - 0.000118
Distance to water -0.226521 - 0.006292
Population density -0.006664 - 2.00e-07
Having a grass roof instead of a metal roof was associated with higher malaria incidence. Having a missing, an open, or a plastic/paper/carton window instead of a glass window was also
associated with higher malaria incidence. Living closer to a river or stream and in less densely populated areas was associated with higher malaria incidence. We were partially able to replicate the results from the main analysis of the phase III trial, finding a significant interaction between the vaccine/booster group and age group, but not between the three dose vaccine group and age group. This could be due to the fact that we used a smaller sample size for our analysis.
Ecological Interactions with Vaccine Efficacy
Next we examined whether vaccine efficacy varied base on any of our ecological variables. Table 6 shows the group-added last test for each interaction term between treatment group and each ecological variable, while Table 7 shows the results from models 5 through 8.
Table 6: Group Added Last Tests for Interaction Terms
Treatment Group: P Value
Roof type 0.571019
Window type 0.986428
Distance to water 0.369
Table 7: Results from Models 5-8
Model and Inputs Parameter Estimates EDF P Value
5
Intercept -7.23834 - < 2e-16
Age – infant vs child 0.34486 - 0.000387
R3C vs C3C -0.46871 - 0.001546
R3R vs C3C -0.58627 - 8.34e-05
Roof type – grass vs metal 0.85294 - 1.22e-07
R3C |Roof type – grass 0.24118 - 0.297221
R3R |Roof type - grass 0.07527 - 0.751946
6
Intercept -7.32305 - < 2e-16
Age – infant vs child 0.52573 - 1.03e-07
R3C vs C3C -0.43068 - 0.01827
R3R vs C3C -0.74966 - 5.12e-05
Window type – screen vs glass 0.41330 - 0.17275
Window type – open vs glass 0.38642 - 0.12731
Window type- plastic/paper/carton vs glass 0.68505 - 0.00322
Window type – planks vs glass 0.39345 - 0.13597
Window type – none vs glass 0.89304 - 0.00107
R3C | Window type – screen -0.21127 - 0.62063
R3R | Window type – screen 0.22234 - 0.63116
R3C | Window type – open -0.04638 - 0.90470
R3R | Window type – open 0.19643 - 0.61901
R3C | Window type- ppc 0.26054 - 0.42589
R3R | Window type- ppc 0.20325 - 0.56386
R3C | Window type – planks 0.23130 - 0.58048
R3R | Window type – planks 0.22903 - 0.62026
R3C | Window type – none 0.19760 - 0.61004
R3R | Window type – none 0.33347 - 0.36862
7
Intercept -7.11961 - < 2e-16
Age – infant vs child 0.63700 - 1.48e-10
R3C vs C3C -0.22729 - 0.1961
R3R vs C3C -0.37136 - 0.0476
Distance to water 0.10534 - 0.3161
R3C |Distance to water -0.11514 - 0.4715
R3R |Distance to water -0.24446 - 0.1612
8
Intercept -6.421410 - < 2e-16
Age – infant vs child 0.350284 - 0.000264
R3C vs C3C -0.339444 - 0.034417
R3R vs C3C -0.673350 - 4.40e-05
Population density -0.012170 - 1.81e-09
R3C | Population density -0.000164 - 0.956412
R3R | Population density 0.001764 - 0.575152
DISCUSSION
Based on the data from the phase III trial, RTS,S was not equally effective in every trial site. One possible explanation for this result was that variable transmission rates created variability in the effect of the treatment. Lilongwe, Malawi is a peri-urban city, meaning that transmission intensity is likely variable throughout the site. Additionally, neighborhoods differ by quality of infrastructure, population density, and nearness to mosquito breeding grounds. Using household locations and characteristics as proxies for point-specific transmission intensity, we were able to conduct a fairly in-depth examination of whether the vaccine’s efficacy varied based on these attributes.
First, we mapped malaria incidence, finding that it was indeed spatially distributed. This result was expected based on our previous knowledge of the study area. Next, we attempted to uncover whether vaccine efficacy was spatially distributed. Although our analysis was not based on a formal hypothesis test, due to the complexity of the modeling strategy for our spatial effect (i.e., thin plate regression splines), the estimated degrees of freedom (EDF) for the interaction terms between spatial location and treatment group helped provide insight. When EDF is low, we suspect that the term in question does not contribute much to the model. Our interaction terms had very low EDF’s, leading us to conclude that spatial location within Lilongwe, Malawi did not influence the efficacy of RTS,S during the phase III trial. Examining the spatial pattern of malaria incidence, split by treatment group, confirmed this assessment.
After finding that our ecological variables were related to malaria incidence and distributed non-uniformly over space, we examined whether the efficacy of RTS,S varied based on roof type, window type, distance to nearest river or stream, or population density. We found no evidence that the efficacy of the vaccine varied based on any of these variables individually within the Lilongwe site.
Strengths and Limitations
The major strength of our study was access to household point locations and characteristics. Using point locations allowed us to avoid introducing potential biases due to subjective aggregation decisions. Another strength of our study was the variation in ecological variables and transmission intensity within our study area.
Related Studies and Future Research
One study using the same phase III data in this study, along with precipitation data, found that there was no association between rainfall and the efficacy of RTS,S in Lilongwe, Malawi [9]. With the added knowledge provided by this study, we can be more confident in claiming that transmission intensity does not affect the efficacy of RTS,S, at least in Lilongwe. This analysis must be replicated in other sites to generalize this result.
There are other theories as to why the efficacy of RTS,S varied between sites in the 2009-2014 phase III trial. One theory is that the vaccine elicits a stronger response from the host immune system if the host has a certain human leukocyte antigen (HLA) genotype. The HLA complex encodes the proteins present on white blood cells which bind to and present foreign molecules to trigger the body’s adaptive immune system. One study found that in 222 RTS,S-vaccinated subjects, with 40 different HLA genotypes, HLA genotype did influence immunogenicity and efficacy of the RTS,S vaccine [10]. An important follow up will be to survey the HLA types of those living in previous trial sites, in order to see if the results match what we would expect. Another theory is that the vaccine elicits stronger protection against certain strains of malaria than it does against others. One study of 4577 RTS,S -vaccinated participants and 2335 control-vaccinated participants, who were 5 to 17 months of age and followed for one year, found that differences within the circumsporozoite (CSP) protein, the protein targeted by RTS,S, had a significant effect on vaccine efficacy [11].
Policy Recommendation
After the phase III trials, there was some discussion that RTS,S should only be offered in high transmission intensity areas because the efficacy appeared to be higher under those conditions. However, our analysis showed that the vaccine performed uniformly across the city of Lilongwe, despite spatial differences in incidence and despite varying household characteristics. If this result holds over other sites, this would mean that RTS,S should be offered in a wider range of areas.
DISCLOSURE STATEMENT
REFERENCES
[1] World Health Organization. World Malaria Report 2017. (WHO, Geneva, 2017)
[2] Gallup J, Sachs J. The economic burden of malaria. The American Journal of Tropical Medicine and Hygiene. 2001;64(1_suppl):85-96. doi:10.4269/ajtmh.2001.64.85.
[3] Number of malaria deaths. World Health Organization.
http://www.who.int/gho/malaria/epidemic/deaths/en/. Accessed March 12, 2018.
[4] First malaria vaccine receives positive scientific opinion from EMA. European Medicines Agency. July 2015.
http://www.ema.europa.eu/ema/index.jsp?curl=pages/news_and_events/news/2015/07/ne ws_detail_002376.jsp&mid=WC0b01ac058004d5c1. Accessed March 12, 2018.
[5] Malaria in children under five. World Health Organization.
http://www.who.int/malaria/areas/high_risk_groups/children/en/. Published January 26, 2018. Accessed March 12, 2018.
[6] RTS,S Clinical Trials Partnership. Efficacy and safety of RTS,S/AS01 malaria vaccine with or without a booster dose in infants and children in Africa: final results of a phase 3, individually randomised, controlled trial. The Lancet. 2015;386(9988):31-45.
doi:10.1016/s0140-6736(15)60721-8.
[7] Penny MA, Verity R, Bever CA, et al. Public health impact and cost-effectiveness of the RTS,S/AS01 malaria vaccine: a systematic comparison of predictions from four
mathematical models. The Lancet. 2016;387(10016):367-375. doi:10.1016/s0140-6736(15)00725-4.
[8] Wood SN. Thin plate regression splines. Journal of the Royal Statistical Society: Series B (Statistical Methodology). 2003;65(1):95-114. doi:10.1111/1467-9868.00374.
[9] Han L, Hudgens MG, Emch ME, et al. RTS,S/AS01 Malaria Vaccine Efficacy is Not
Modified by Seasonal Precipitation: Results from a Phase 3 Randomized Controlled Trial in Malawi. Scientific Reports. 2017;7(1). doi:10.1038/s41598-017-07533-w.
[10] Nielsen C, Vekemans J, Lievens M, Kester K, Regules J, Ockenhouse C. RTS,S malaria
vaccine efficacy and immunogenicity during Plasmodium falciparum challenge is associated with HLA genotype. Vaccine. 2018;36(12):1637-1642.
doi:10.1016/j.vaccine.2018.01.069.
[11] Neafsey, D. E. et al. Genetic Diversity and Protective Efficacy of the RTS,S/AS01