#
ABSTRACT
BOBBY R. TEMPLIN. Effect of Operating Conditions on
Pressure Drop in a Pulse-Jet Cleaned Fabric Filter (Under
the direction of DR. DAVID H. LEITH)
A predictive model for pressure drop in a pulse-jet
cleaned fabric filter and the effect of on-line vs. off-line
pulse-jet cleaning on pressure drop were examined. Data
were collected in experiments with untreated polyester
fabric and PTFE-laminated fabric. Twenty-four experimental
conditions were studied in which each fabric repeatedly
filtered limestone dust or flyash for 30, 120, or 480 s and
was then cleaned either on-line or off-line. Each condition
was replicated, resulting in a total of 48 experiments.
Dust inlet concentration and superficial filtration velocity
-3 -1
were maintained at 1.69 g m and 0.075 m s respectively.
Based on conditions studied: 1) dust removal results from a
complex interaction of the pulse pressure, pressure drop
prior to pulsing, and dust areal density, w; 2) dust removal
efficiency of a cleaning pulse,e , increases as w increases,
3) the rate of increase in e with w diminishes as w becomes
larger; 4) the predictive model examined should be applied
only if the dust areal density added during one filtration
is small; 5) under some conditions off-line cleaning does
not reduce pressure drop below that achieved by on-line
cleaning; and 6) pressure drop depends primarily on fabric
type and w .
TABLE OF CONTENTS
Page
ACKNOWLEDGEMENTS... V
I. Introduction... 1
II. Effect of Operating Conditions on Pressure Drop in a Pulse-Jet Cleaned Fabric-Filter ... 4
A. Nomenclature ... 5
B. Abstract ... 6
C. Introduction 1. Pressure Drop Models ... 7
2. Off-line Cleaning ... 10
D. Experiments ... 12
E. Theory ... 14
F. Results and Discussion 1. Ap... 15
2. K2fK2/K3, K^ and e ... 15
3. Predictive Model ... 19
4. On-line vs. Off-line Cleaning ... 23
5. Differences between Replicates ... 25
G. Conclusions ... 26
H. References ... 28
III. Suggested Research... 30
IV. Appendix A - Observed and Calculated Data ... A-1
V. Appendix B - Particle Analysis ... B-1
VI. Appendix C - Statistical Analysis... C-1 VII. Appendix D - Leith and Ellenbecker/Koehler and
ACKNOWLEDGEMENTS
I wish to sincerely thank Dr. David H. Leith for making the data contained in this study available and for his
guidance and assistance during my research. I appreciate
the efforts of Dr. Donald Fox and Dr. Louis Hovis and their
participation on my committee. I am grateful to Dr. Gary D. Koch, and Grey Carr for their help in the statistical
analysis. The interests, concern, and assistance of Alan Sheaffer, Donna lozia. Dr. Harvey E, Jeffries, Dr. Parker C, Reist, and other Environmental Sciences and Engineering students and faculty are greatly appreciated.
A special thanks must go to my wife Susan for her understanding and aid in proof-reading and editing this
INTRODUCTION
Particulates are one of the seven pollutants for which
the US Environmental Protection Agency has promulgated
primary National Ambient Air Quality Standards to protect
human health and the environment. Composed of such elements
as arsenic, cadmium, lead, mercury and vanadium, atmospheric
particles produced by fuel combustion and industrial
activity are a direct hazard to human health (Stern, Boubel,
Turner and Fox, 1984). They also constitute an indirect
hazard by transporting adsorbed toxic compounds to the lower
lung. Particles also affect atmospheric visibility, soiling
of surfaces, and are a factor in acid deposition
(Williamson, 1973).
Limiting the anthropogenic particle contribution depends
on efficient collection at the point of generation. Fabric
filters (baghouses) are commonly employed for this purpose.
Pulse-jet cleaned fabric filters are widely used for small
scale applications e.g. industrial processes and for some
large scale processes (linoya and Orr, 1977). Reynolds,
Kreidweis and Theodore (1983) reported that pulse-jet cleaned fabric filters comprise 41% of the fabric filters
used by industry and 14% of those used by utilities for
The following paper, prepared for publication, details a study of pulse-jet filter data collected at Harvard School of Public Health. The study examines the effect of
operational conditions on pressure drop, a current theory
for predicting the operating pressure drop and an
REFERENCES
linoya K. and Orr C. Jr. (1977) Filtration, Air Pollution Vol. IV; Engineering Control of Air Pollution, 3rd ed., Ed. Arthur Stern, Academic Press, New York, NY.
Reynolds J., Kreidenweis S. and Theodore L. (1983) Results of a baghouse operation and maintenance survey on industrial
and utility coal-fired boilers, J. Air Poll. Control Assoc, 33, 352-358.
Stern A. C, Boubel R. W., Turner D. B. and Fox D. L.
(1984) Fundamentals of Air Pollution, 2nd ed.. Academic Press, Orlando, FL.
Effect of Operating Conditions on Pressure
Drop in a Pulse-Jet Cleaned Fabric Filter
B. R. Tempiin
D. Leith
Department of Environmental Sciences and Engineering
School of Public Health
University of North Carolina at Chapel Hill
Chapel Hill, NC 27514
NOMENCXATURE
2 A fabric area, m
c. dust inlet concentration, kg m
Fg force acting to separate dust deposit from fabric, N
K, fabric resistance. Pa s m
K, specific resistance of dust deposit, s
K^ factor expressing effectiveness of a cleaning pulse in
removing dust. Pa
K. constant expressing the effect of reverse fabric motion
on cleaning, dimensionless
-2 2
K venturi nozzle resistance. Pa m s
p significance probability associated with the F
statistic, dimensionless
P pulse pressure, kPa
Pg maximum static pressure developed inside bag as a
result of cleaning pulse. Pa
t time between cleaning pulses, s
V superficial filtration velocity, m s
-2
w areal density of dust deposit, kg m
Wjj areal density of dust remaining on or in the fabric
after cleaning, kg m
Wq dust areal density added during one filtration cycle,
kg m~^
Ap pressure drop across fabric and dust deposit. Pa
Ap^ average or operating total pressure drop, Ap + Ap , Pa
Ap pressure drop across venturi. Pa
e fraction of dust removed by a cleaning pulse,
«
Abstract - A predictive model for pressure drop in apulse-jet cleaned fabric filter and the effect of on-line vs. off¬ line pulse-jet cleaning on pressure drop were examined.
Data were collected in experiments with untreated polyester fabric and PTFE-laminated fabric. Twenty-four experimental conditions were studied in which each fabric repeatedly filtered limestone dust or flyash for 30, 120, or 480 s and
was then cleaned either on-line or off-line. Each condition
was replicated, resulting in a total of 48 experiments.
Dust inlet concentration and superficial filtration velocity
-3 -1
were maintained at 1.69 g m and 0.075 m s , respectively.
Based on conditions studied: 1) dust removal results from a
complex interaction of the pulse pressure, pressure drop
prior to pulsing, and the dust areal density, w; 2) dust
removal efficiency of a cleaning pulse, e, increases as w
increases; 3) the rate of increase in e diminishes as w
becomes larger; 4) the predictive model examined should be
applied only if the dust areal density added during one
filtration cycle is unchanged or if the rate of change in e
with w is small; 5) under some conditions off-line cleaning
does not reduce pressure drop below that achieved by on-line
cleaning; and 6) pressure drop depends primarily on fabric
type and w .
«
INTRODUCTION
Pressure drop is of great interest in the operation of a
fabric filter as this parameter is a measure of energy required, and thus cost, to force a gas stream through the system. Numerous investigators have examined the flow of
dust laden gas through the system. Theories and models for
describing and predicting pressure drop remain under
development, however. Operational modifications to reduce
pressure drop also remain under investigation.
This study evaluated the influence of operating
conditions on pressure drop, a predictive model for pressure drop and the effect of off-line versus on-line cleaning on pressure drop over a range of operational conditions.
Pressure Drop Models
The model studied was developed by Leith and Ellenbecker
(1980) to predict pressure drop, Ap, across the fabric and
the dust deposit. Basis for the model was an assumption that fraction of dust removed by a cleaning pulse, e , is
proportional to separation force per unit area, F_/A. This
resulted in
e = K3 (Pg - Ap) - K^ (1)
for a pulse-jet cleaned fabric filter where K is assumed
#
pulse, Pg is the maximum static pressure developed in a bag
from a cleaning pulse, and K- is a constant expressing the
effect of reverse fabric motion on dust removal. K. was
4
later determined to be negligible for most filter
operations.
Pressure drop is related to dust areal density, w, by
A p = K^v + K2 V w (2)
where v is superficial filtration velocity, K, is fabric
resistance, and K2 is dust deposit specific resistance. By
(1), e would be reduced as Ap increases with increasing w.
Stable operation results when a steady state value of w is
reached at which ew = w , where w is the dust areal density
added during one cleaning cycle.
The model developed by Leith and Ellenbecker (1980) was
modified by Koehler and Leith (1983) to predict total system
operating pressure drop, Ap^/ by adding an expression for
pressure drop, Ap , through the venturi commonly placed at
the outlet of each bag to assist the cleaning pulse. The
resulting equation wasP3 + K^v - >/(P3-KiV)2 - 4 w^vK2/K,
^
9
where K^ is constant for a given venturi design. This model
was tested with w maintained constant over a range of
superficial filtration velocities, dusts, and fabric types
and was determined to predict Ap. effectively.
K2/K2 is assumed to be a constant in (3), as it is the
ratio of two presumed constants, K^ and K^. Areal density,
however, includes the dust remaining on and in the fabric
after the cleaning pulse, redeposited dust as shown by
Leith, First and Feldman (1977); and w . Each dust layer
may have its own distinct value of Kj as discussed by Dennis
and Hovis (1984); Dennis, Wilder and Harmon (1981); and
Dennis and Klemm (1980a). Kj in (3) is a composite of the
Kj values for each layer. This value changes as the
thickness of the layers change relative to each other.
Such variations are described by Dennis and Klemm
(1980b) and Dennis and Dirgo (1981). K, generally decreases
as the freshly added dust deposit becomes thicker. Dennis
and Klemm (1980b) and Chao and Chang (1980) have noted,
however, that K2 may increase slightly at higher values of w
for some fabrics due to compression of fibers in these
fabrics.
Other researchers have found that the relationship
between e and F_/A may not be linear as assumed by Koehler
and Leith (1983), and therefore K^ may not be constant,
linoya and Mori (1979) found that e increased with an
#
10
Wallace (1984) in a review of reverse-gas cleaned fabric filters. These findings contradict (1) which states that e should decrease with increasing w and Ap.
Klingel and Loffler (1983) experimented with the effect of fabric and dust permeability on the effectiveness of a cleaning pulse. They determined that P is not a fixed value for a given reservoir pressure, P, but rather it varies with permeability of fabric and dust deposit. As w
increases and permeability diminishes, P rises.s
Amplification of P_ was found to occur at points along thes
bags due to a reflected pressure wave.
Klingel and Loffler (1983) found that this rise in P^
with increasing w has a limit. The dust cake and fabric
cannot support a further buildup of pressure after flow
channels are developed and the dust cake is loosened. They
also noted even with a considerable increase in cleaning
intensity a point is reached at which further reduction in w
cannot be achieved. Similar findings are reported by linoya
and Mori (1979); Morris and Millington (1983); Humphries and Madden (1983); and Leith and Allen (1986).
Off-line Cleaning
The effect of off-line cleaning on the model and Ap was also examined. Bags are normally cleaned on-line as gas flow through surrounding bags continues. Humphries and
off-11
line cleaning, where the bags undergoing cleaning are
isolated from gas flow, reduces Ap. This reduction with
off-line cleaning is credited to an increase in e due to P
snot having to overcome Ap and to a reduced dust loading as a
result of decreased dust redeposition.
Humphries and Madden (1983), however, found no
difference between on-line and off-line cleaning in
experiments with acrylic needlefelt fabrics filtering flyash
_3
at an inlet concentration of 30 g m . Dirgo and Cooper
(1982) in a study of cyclone precleaners for fabric filters
discussed a situation wherein decreased dust loading
increased filter Ap. This was attributed to reduced fabric
cleanability (increased dust bound onto and in the fabric)
and increased Kj due to a relative increase in fine
12
EXPERIMENTS
Experiments were performed using a three-bag pilot scale
filter described by Leith et al. (1977). The method of
conditioning bags, and injecting and analyzing the dusts
used were as described by Koehler and Leith (1983), who also
described the means used for determining P , K^ and K .
S J. VThe fabrics examined were polyester felt with either an
untreated surface or a polytetrafluoroethylene (PTFE) layer
laminated onto the surface. Both fabrics were tested for
twenty-four experimental conditions in which limestone dust
or flyash were repeatedly filtered for 30, 120 or 480 s
prior to cleaning either on-line or off-line. In off-line
cleaning the bags were isolated from the gas stream and
pulsed; then the dust was allowed to settle for two minutes.
Each experimental condition was replicated for a total of 4 8
experiments (see Table 1), each approximately 16 h in
length. Different sets of bags were used for each
experimental condition.
Superficial filtration velocity was maintained at 0.075
-1 -3
m s . Inlet dust concentration was 1.69 g m for all 48
experiments. Each cleaning pulse was 690 kPa (6.9 bar).
Experiments were performed at room temperature and pressure
Table 1
Observed and Calculated Data
Bag Dust t On/ w
APt'
ApK /K3 =
^2 K3Type"""
Type2 (s) Off3(kq m~^)
(P?) (Pa)-1
(Pa s ^)
(s-1)
(P?"-^)
REPLICATE 1
PTFE L 30 On 0.034 996 673 1.49E+10 2.31E+05 1.56E-05
PTFE L 120 On 0.058 1295 972 5.49E+09 2.25E+05 4.09E-05
PTFE L 480 On 0.116 1320 997 1.41E+09 1.37E+05 9.75E-05
PTFE L 30 Off 0.037 959 636 1.51E+10 1.98E+05 1.31E-05
PTFE L 120 Off 0.065 1220 897 5.67E+09 1.80E+05 3.18E-05
PTFE L 480 Off 0.130 1407 1084 1.76E+09 1.30E+05 7.41E-05
PTFE F 30 On 0.057 1282 959 2.17E+10 2.06E+05 9.51E-06
PTFE F 120 on 0.087 1668 1345 7.48E+09 2.06E+05 2.75E-05
PTFE F 480 On 0.198 2490 2167 2.75E+09 1.64E+05 5.95E-05
PTFE F 30 Off 0.040 1195 872 2.20E+10 2.68E+05 1.22E-05
PTFE F 120 Off 0.064 1345 1022 6.58E+09 2.15E+05 3.26E-05
PTFE F 480 Off 0.130 1469 1146 1.87E+09 1.38E+05 7.38E-05
U L 30 On 0.068 448 125 2.04E+09 1.45E+04 7.10E-06
U L 120 On 0.093 461 138 6.01E+08 1.31E+04 2.18E-05
U L 480 On 0.160 747 424 6.37E+08 3.82E+04 6.00E-05
U L 30 Off 0.077 585 262 6.04E+09 3.69E+04 6.11E-06
L 120 Off 0.102 585 262 1.51E+09 2.94E+04 1.95E-05
L 480 Off 0.216 2316 1993 3.52E+09 1.39E+05 3.96E-05
u F 30 On 0.171 548 225 4.83E+09 1.35E+04 2.80E-06
u F 120 On 0.240 585 262 1.46E+09 1.19E+04 8.16E-06
u F 480 On 0.448 1768 1445 2.08E+09 4.45E+04 2.13E-05
u F 30 Off 0.159 548 225 4.97E+09 1.45E+04 2.93E-06
0 F 120 Off 0.219 623 300 1.79E+09 1.55E+04 8.68E-06
u F 480 Off 0.303 996 673 1.12E+09 3.03E+04 2.70E-05 REPLICATE 2
PTFE L 30 On 0.037 1245 922 2.08E+10 3.07E+05 1.48E-05
PTFE L 120 On 0.060 1370 1047 5.91E+09 2.36E+05 4.00E-05
PTFE L 480 On 0.123 1743 1420 1.96E+09 1.88E+05 9.57E-05
PTFE L 30 Off 0.060 1345 1022 2.63E+10 2.07E+05 7.86E-06
PTFE L 120 Off 0.069 1320 997 6.40E+09 1.92E+05 3.01E-05
PTFE li 480 Off 0.131 1643 1320 2.19E+09 1.60E+05 7.33E-05
PTFE F 30 On 0.086 1494 1171 2.63E+10 1.68E+05 6.37E-06
PTFE F 120 On 0.119 1967 1644 8.89E+09 1.82E+05 2.05E-05
PTFE F 480 On 0.254 1917 1594 2.17E+09 8.84E+04 4.08E-05
PTFE F 30 Off 0.056 1494 1171 3.07E+10 2.59E+05 8.46E-06
PTFE F 120 Off 0.081 1693 1370 9.11E+09 2.27E+05 2.49E-05
PTFE F 480 Off 0.160 1718 1395 2.32E+09 1.32E+05 5.67E-05
U L 30 On 0.074 473 150 2.74E+09 1.78E+04 6.51E-06
U L 120 On 0.103 672 349 2.05E+09 4.13E+04 2.01E-05
U I. 480 On 0.198 1121 798 1.22E+09 5.94E+04 4.86E-05
U I. 30 Off 0.082 548 225 4.97E+09 2.85E+04 5.74E-06
U I. 120 Off 0.106 647 324 1.96E+09 3.68E+04 1.87E-05
U L 480 Off 0.212 822 499 8.08E+08 3.27E+04 4.05E-05
U F 30 On 0.184 573 250 5.52E+09 1.44E+04 2.61E-06
U F 120 On 0.243 996 673 4.13E+09 3.50E+04 8.48E-06
U F 480 On 0.505 2664 2341 2.98E+09 6.43E+04 2.16E-05
U F 30 Off 0.243 847 524 1.37E+10 2.61E+04 1.91E-06
U F 120 Off 0.236 921 598 3.95E+09 3.17E+04 8.04E-06
U P 480 Off 0.435 1295 972 1.67E+09 3.03E+04 1.82E-05
PTFE = Polytetrafluoroethylene surface, U = Untreated surface
'F = Flyash, L = Limestone
On-line cleaning. Off = Off-line cleaning
'On
1
Average values over operating period
'calculated using K
57,500 Pa m"^s^;
K, for PTFE laminated fabric = 1530 Pa s m6
and K, for untreated fabric = 712 Pa s m
14
THEORY
During off-line cleaning the compartment being cleaned is isolated from the gas stream and no gas flows through the filter. Pressure drop across fabric and dust is therefore
zero. Equation (1) becomes
^ = ^3^3 - ^4 ^^^
This results in an expression for the total pressure drop at
steady state
^2 ^^o
APt = Ky + K^v + j^ -Y- (5)
3 s15
RESULTS AND DISCUSSION
Pressure Drop
The effects of operating conditions on Ap were analyzed using analysis of variance (ANOVA). We found Ap depended strongly on fabric type (p<0.001) and time between cleaning pulses, t {p<0.002). Dust type was significant, but to a lesser degree (p<0.05). Cleaning mode was not significant
(p>0.10) overall, however a dust-cleaning mode statistical interaction (p<0.10) indicated Ap did decrease for off-line cleaning of PTFE-laminated fabric filtering flyash and for off-line cleaning of untreated polyester filtering flyash at
t = 480 s.
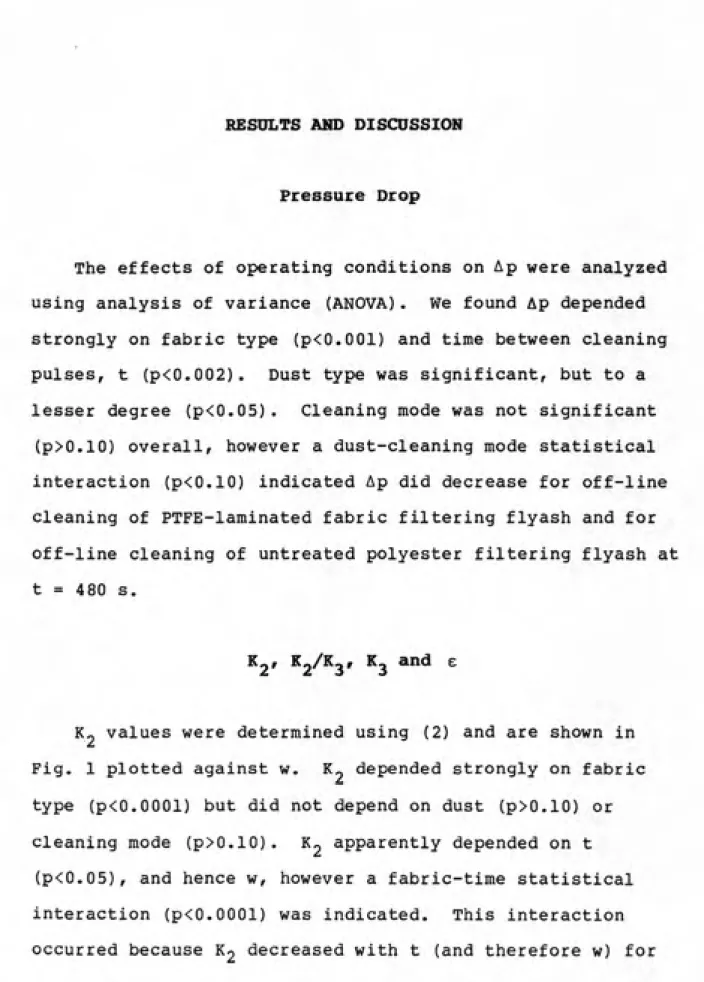
K^t K2'^^3' ^3 *"*^ ^
K^ values were determined using (2) and are shown in
Fig. 1 plotted against w. K_ depended strongly on fabric
type (p<0.0001) but did not depend on dust (p>0.10) or
cleaning mode (p>0.10). K2 apparently depended on t
(p<0.05), and hence w, however a fabric-time statistical interaction (p<0.0001) was indicated. This interaction16
the PTFE-laminated fabric but not for the untreated
polyester as illustrated in Fig. 1.
The differences seen between fabrics arises from the
differences in their surfaces. The PTFE-laminated fabric
had a smooth and relatively impermeable surface which
allowed a less permeable dust-fabric interface to form
quickly. Increased w added a more porous dust cake to this
interface and thus the composite Kj of the layers decreased.
The untreated polyester had a rough and relatively
permeable surface. The dust-fabric interface formed within
the pores and interstices of the fabric creating a slower
forming and more porous structure with lower Kj compared to
the PTFE-laminated fabric. As w increased, the dust-fabric
interface became less permeable and K2 may have risen
somewhat without a true dust cake being formed.
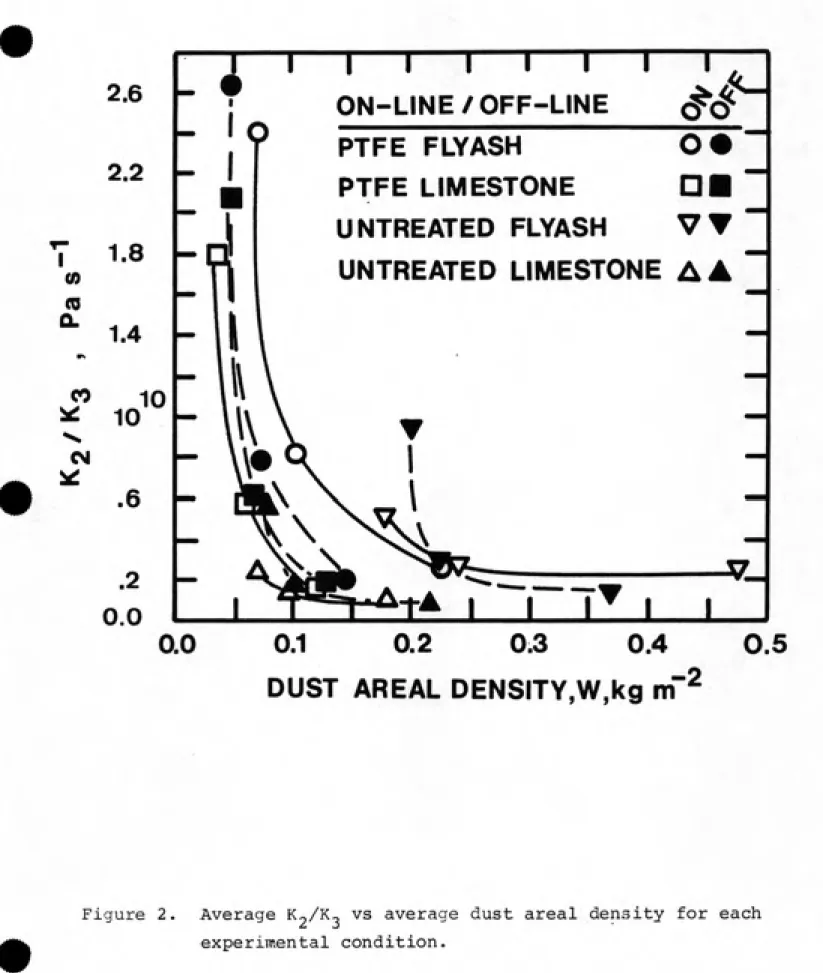
Equations (3) and (5) were solved for Kj/K-. Values of
K^/Ko were not constant but decreased as t, and hence w,
increased (p<0.0001), as shown in Fig. 2. Fabric surface
treatment significantly effected ^2^^Z (P<0«0001) with
PTFE-laminated fabric having the greatest variation in K-ZK^
values. Dust type had a less pronounced effect on K_/K_ but
was also significant (p<0.0005) with K^^^s ^^^^"9 higher for
flyash than limestone. The rate of decline in K-/K- values
appears to diminish as w increases for all fabric-dust
combinations, as illustrated in Fig. 2.
v?^^?^-l^^|^P^-^^-"V
17
U.
07
UJ
o
Z
(0
CO UJ cc
o
u.
«
0. (02.6
2.2
-w 1.8 H
CN
t 1.4
CO
O
CL c
g 10^
.6
0.0
1---1---1---1---1---1---\
ON-LINE/OFF-LINE (^<j^
PTFE FLYASH 0#"
PTFE LIMESTONE Dl
UNTREATED FLYASH VV
UNTREATED LIMESTONEAA
A-DUST AREAL DENSITY,W,kg m
-2'^T^^T'-'^^^""
18
CO
2.6
2.2
1.8
m
Q.
^
1.4
CO ͣ
^
10
^
CM
^
.6
.2
0.0
- lo
. I
10
T—I—I—I—r
ON-LINE/OFF-LINE
1—r
^<?
PTFE FLYASH 0«
PTFE LIMESTONE DB
UNTREATED FLYASH VT
UNTREATED LIMESTONE AA
_J
w
0.0
0.1
0.2
0.3
0.4
0.5
DUST AREAL DENSITY,W,kg m
r2
Figure 2. Average K-Zk^ vs average dust areal density for each
19
Kj and K2/K2 showed similar trends as t increased with a
corresponding increase in w. The variation in K- did not,
however, completely explain the differences in Kj/K^ values.
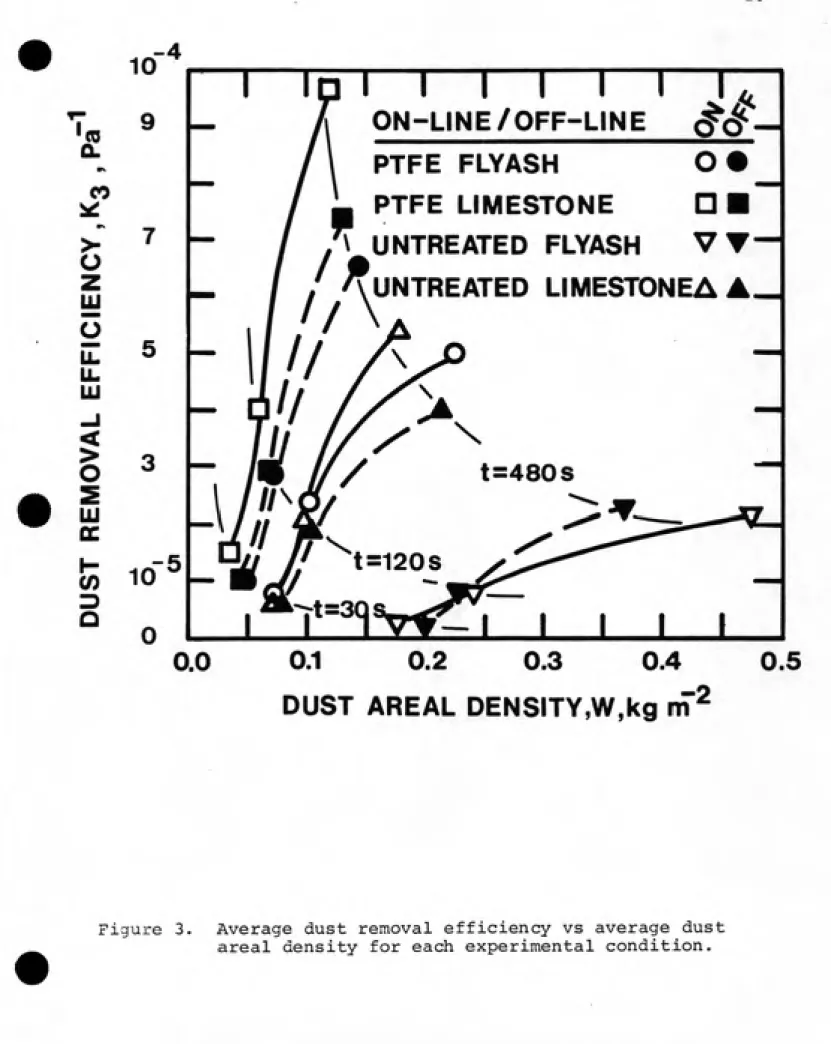
Calculated Kj and K2/K0 values were used to determine
values for K^. Fig. 3 shows that K^ increased with
increasing w for each combination of fabric, dust and
cleaning mode. This is the result of a rise in e
(calculated by dividing w by w) with increasing w as shown
in Fig. 4.
We confirmed by ANOVA that e increased as t, and
therefore w, increased (p<0.0001). Values of e were
significantly higher for the PTFE-laminated fabric
(p<0.0001) compared to the untreated polyester and for the
coarse limestone dust (p<0.0001) compared to the relatively
fine flyash (see Fig. 5). Cleaning mode also influenced e
(p<0.05) but its effect varied with dust and fabric as will
be discussed later.
Predictive Model
The increase in e with w contradicts the assumption on
which (3) is based; i.e. any increase in the dust deposit
would raise Ap and thereby reduce e. The increase of e with
increasing w was likely the result of an enhancement of
cleaning efficiency due to the increased thickness of the
dust layer similar to that reported by Klingel and Loffler
20
10
-4
I
s.
CO
O
Z
UJ
o
iZ
u. ui
O
UJ QC
H CO 3
Q
ON-LINE/OFF-LINE <^(j^
PTFE FLYASH 0#
PTFE LIMESTONE D
ͣ
'\ UNTREATED FLYASH VT
/ A UNTREATED LIMESTONEA A J
//\
//
'/
t=480S
t=120s
0.5
DUST AREAL DENSITY,W,kg m
r2
21
lU X
o
u.
a
m
Vl/
LU CC O
I- CC
CO £
Q If
li.
O
o
<
0.6
0.5
0.4
0.3
0.2
0.1
-0.0
I
> I—^—;;
ON-LINE/OFF-LINE <^cj^
PTFE FLYASH O #.
PTFE LIMESTONE D
ͣ
/^UNTREATED FLYASH VV
' -^UNTREATED
LIMESTONE
t=480s
t=120s
... t=30s.
0,0
0.1
0.2
0.3
0.4
0.5
DUST AREAL DENSITY,W,kgm
-2
Figure 4. Average fraction of dust removed from the fabric
for each cleaning pulse vs average dust areal
22
600
tC 400
UJ I-UJ
K 200
O
a: 100
UJ
UJ
<
5
UJ
-J O H
<
o.
80
60
40 H
20
1 1 1 1 1 1 1 1 1
u
^^
ͣ
^^
/
A
^'
.^ /
L_
A J^
-u
/ J'
-L./ .o
/ .o
/ p
/LIMESTONE y^ FLYASH
1 1 1 1 1 1 1 1 1 1
1
10
5090
99PERCENT SMALLER THAN STATED SIZE
#
Figure 5. Cumulative size distributions by mass for test dusts,
23
The assumption of constant Yi^^/Yi^ in (3) or (5) will
result in either an overestimate of Ap or a possible false
indication of unstable operation. Ko'^^^S ^^^ ^^ considered
constant in (3) or (5) if values vary little for changes in
w as occurred for untreated polyester with high w. Koehler
and Leith (1983) also found K^/Yi^ was roughly constant in
similar experiments, but with w maintained at 3.8 x 10 kg
-2 -1
m while v varied from 0.050 to 0.120 m s .
Figs. 3 and 4 show declining rates of change in K^ and e
as w increases. Dennis and Klemm (1980b) and Dennis andDirgo (1981) have reported that as w increases a point is
reached after which little variation is seen in the value of
K2. This and the findings of Koehler and Leith (1983) imply
Kj/Kn will be approximately constant at values of w higher
than those investigated here, or if w does not change.
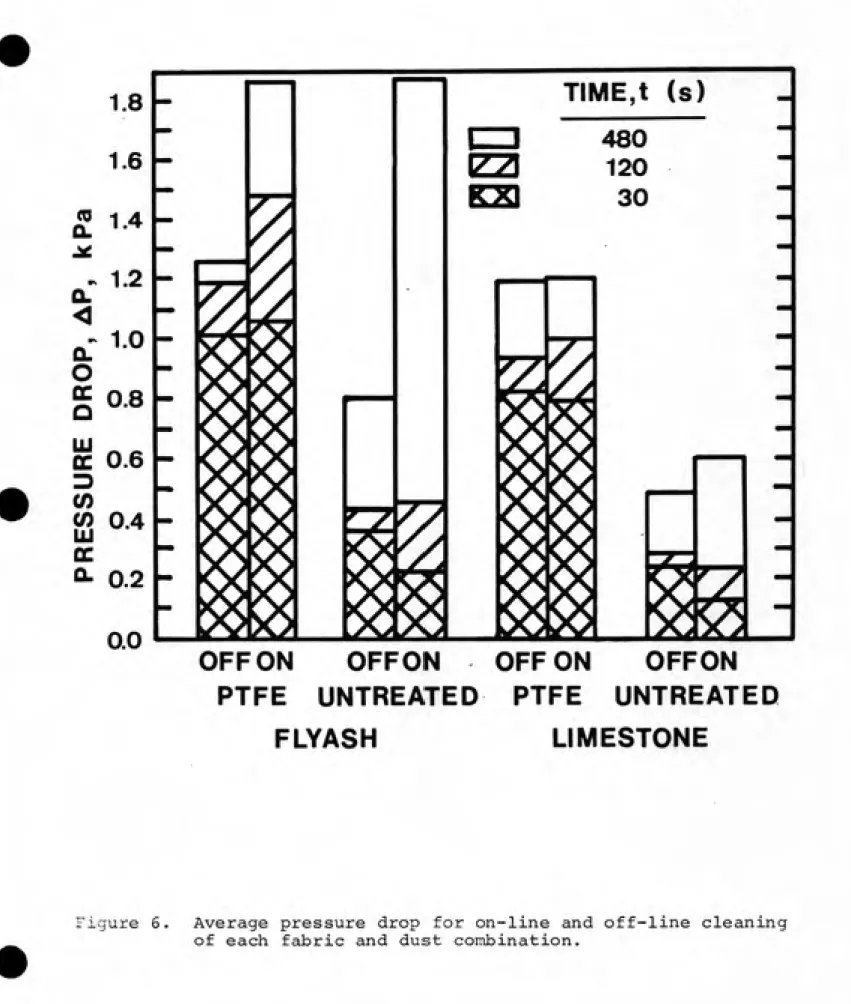
On-Line vs. Off-Line Cleaning
Average values of Ap for each experimental condition are
shown in Fig. 6. PTFE-laminated fabric filtering flyash
always had lower values of Ap for off-line cleaning (p<0.10)
though the effect, if any, was minimal at t = 30 s. The
effect of cleaning mode on Ap for untreated polyester
filtering flyash appeared to vary with ANOVA showing an
influence by off-line cleaning on Ap (p<0.05), overall. Any
24
1.8
1.6
(0
CL 1.4
^
•s
1.2
0.
<
WS
1.0
0.
o
GC
0.8
O
uy
QC
0.6
3
0)
0)
0.4
UJ cr
OL
0.2
0.0
z
TIME,t (s)
480
120
30
z
OFF ON OFFON OFF ON OFFON
PTFE UNTREATED PTFE UNTREATED
FLYASH LIMESTONE
Figure 6. Average pressure drop for on-line and off-line cleaning
25
to off-line cleaning appears probable only for t = 480 s,
however.
The effect of cleaning mode on Ap for both fabrics
filtering limestone dust varies with t and appears minor in
Fig. 6. No significant effect of cleaning mode on Ap
(p>0.10) was found for filtration of limestone dust by
either fabric.
Differences Between Replicates
Differences between the replicate experimental
conditions existed for w (p<0.001), Ko'^^S (P<0*001)f
K-(p<0.005), and e (p<0.001), but not for Ap (p>0.10) and K2
(p>0.10). This occurred as the result of a general increase
in w in Replicate 2 compared to Replicate 1, particularly for
fly ash. Those variables that were significantly affected
were highly sensitive to small variations in w over the
ranges investigated here as illustrated in the preceding
figures. K2f and hence Ap, were not influenced by
differences in w between replicates as w varied little for
the PTFE-laminated fabric for which K^ is most sensitive to
changes in w and as K^ varies little for untreated
polyester, which underwent the greatest changes in w (see
Fig. 1) .
The increase in w occurred although the bags were
conditioned prior to each experiment. This increase may
26
changes in the dust-fabric interface while stored between
replicates, handling of the bags, or a combination of these
factors.
ANOVA was repeated for each replicate separately. The
findings were essentially the same for each replicate
considered separately and for the replicates considered
together.CONCLDSIONS
The fraction of dust removed per cleaning pulse in a
pulse-jet cleaned fabric filter increased with increasing w
in this study. As a consequence ¥.^/K-. is not a constant
value as assumed by Leith and Ellenbecker (1980), and
Koehler and Leith (1983) but decreases as w increases.
Variations in K2/K2 are small and K^/K^ can be assumed
constant to allow an approximation of Ap. using (3) or (5)
when w is not changed or when varies little with
increases in w, i.e. at large values of w. Otherwise, the
assumption of a constant K2/K2 results in an overestimate of
Ap. or a possible erroneous prediction of unstable
operation.
Off-line cleaning reduced pressure drop below that
obtained with on-line cleaning for PTFE-laminated fabric
filtering flyash. Reduction in Ap was achieved by off-line
cleaning of untreated polyester filtering flyash at the
27
Off-line cleaning did not reduce pressure drop for
PTFE-laminated fabric or untreated polyester filtering limestone
dust.
Pressure drop was most strongly influenced by fabric
type and w . Dust type was a factor but did not greatly
REFERENCES
Carr R. and Smith W. (1984) Fabric filter technology for
utility coal-fired power plants, part I: utility
baghouse design and operation. J. Air Poll. Control Assoc. 84, 82-89
Chao C. C. and Chang W. C. (1982) Pressure drop across compressible random-fiber porous medium: a unified filtration theory. World Filtration Congress III, vol. 2, Upland Press, Croydon, England.
Dennis R. and Hovis L. S. (1984) Pulse jet filtration theory - a state-of-the-art assessment. 4th Symposium
on the Transfer and Utilitzation of Particulate Control Technology. EPA Report EPA-600/9-84-025a, NTIS,
Springfield, VA.
Dennis R. and Dirgo J. A. (1981) Comparison of laboratory
and field derived K2 values for dust collected on fabric
filters. Proceedings of the US-Japan Seminar:
Measurement and Control of Particulates Generated from
Human Activities, EPRI CS-2145-SR, EPRI, Palo Alto, CA.
Dennis R. and Klemm H. A. (1980a) Modeling concepts for pulse jet filtration. J. Air Poll. Control Assoc. 30,
38-43.
Dennis R. and Klemm H. A. (1980b) Recent concepts
describing fabric filter system behavior. Proceedings of the US-Japan Seminar: Measurement and Control of
Particulates Generated from Human Activities, EPRI CS-2145-SR, EPRI, Palo Alto, CA.
Dennis R. and Wilder J. (1975) Fabric filter cleaning studies. EPA Report EPA 650/2-75-009, NTIS,
Springfield, VA.
Dennis R., Wilder J. E. and Harmon D. L. (1981) Predicting pressure loss for pulse jet filters. J. Air Poll.
Control Assoc. 31, 987-992.
Dirgo J. and Cooper D. W. (1983) Theoretical investigation of pressure drop in combined cyclone and fabric filter
29
Humphries W. and Madden j. j. (1983) Fabric filtration for
coal-fired boilers: dust dislodgements in pulse jet
filters. Filtr. Sep. 20, 40-44.
linoya K. and Mori Y. (1979) Fundamental experiments of
fabric filters. Symposium on the Transfer and
Utilization of Particulate Control Technology. EPA
Report EPA-60/7-79-044b, NTIS, Springfield, VA.
Klingel R. and Loffler F. (1983) Influence of cleaning
intensity on pressure drop and residual areal density in
a pulse jet fabric filter. Filtech Conference, Uplands
Press, Croydon, England.
Koehler J. L. and Leith D. (1983) Model calibration for
pressure drop in a pulse-jet cleaned fabric filter.
Atmospheric Environment 17, 1909-1913.
Leith D. and Ellenbecker M. J. (1980) Theory for pressure
drop in a pulse-jet cleaned fabric filter. Atmospheric
Environment 14, 845-852.
Leith D., First M. W. and Feldman H. (1977) Performance of
a pulse-jet filter at high filtration velocity. J. Air
Poll. Control Assoc. 27, 636-642.
Leith D. and Allen R.W.K. (1986) Dust filtration by fabric
filters. Progress in Filtration and Separation 4,
Elsevier, Amsterdam,
Morris K. and Millington C. A. (1983) Modelling fabric
filters. Filtech Conference 1983, Uplands Press,
Croydon, England.
Rothwell E. (1984) An apologia for the return of the
compartmented fabric dust collector. Filtr. Sep. 21,
m
30
SUGGESTED RESEARCH
1. Measure Ap and w as w^ is increased to determine the
influence of w on dust removal efficiency at values greater
than those recorded in this study.
2. Investigate the effect of cleaning mode on Ap and dust
removal to confirm the findings of this study and to
determine the reason or reasons for differences betweenlimestone dust and flyash. Specifically, cleaning efficiency
for higher values of w than reported here should be
examined.
3. Measure Wj. and Ap for various dust-fabric combinations
over an extended period of time with constant w to
determine the influence of operating time on Wp and Ap.
4. Analyze particle data to determine: a) any relationship
between upstream and downstream particle size distribution,
and b) any relationship between particle size distributions
and flux or Ap.
5. Examine performance of predictive models for flux
against measured values.6. Examine a possible relationship between Ap and flux.
Initial investigation indicated that flux varies with the
inverse of Ap.7. Assess the applicability of applying structural theory
to dust removal from the fabric bag i.e. view the fabric and
dust layer during cleaning as a composite structure
APPENDIX A
AND CALCULATED DATA.
NO. EXP. FABRlCl DUStZvELOCITT, TINE ON/
NO. TYPE TYPE v BETWEEN
OFF-(m trh PULSES.t LINE
<s> CLEANING nux (kg «-2»-l) MEASURED AREAL DENI STY,Urn <kg ni"2) C0«RECTEd3 CORRECTED* RESIDUAL AREAL DENISTY.Ur (kg m"2) AREAL DENSITY, U (kg (n-2) INLET CONC, Ci (g trh
AVERAGE DUSTSFABRICS Vs'
TOTAL PRESSURE ^^m C^
PRESSURE DROP, A p
DROP, Ap (Pa>
(Pa)
FILTER? SPECIFIC* DUST REMOVALS
DRAG, RESISTANCE EFFECTIVENESS
S OF DUST OF REVERSE
(g cm"2s-l) DEP0S1T,K2 PRESSURE («"1) DROP.K, (P«"l>
DUST AREAL DENSITY^ FRACTION OpU
ADDED DURING ONE DUST REMOVED
FILTRATI ON CYCLE, PER PULSE, 6
Uo (kg m'h REPLICATE 1 111 122 120 IDS 112 109 106 124 121 10 101 11 115 12 116 13 104 14 110 15 114 16 103 17 113 18 102 19 123 20 118 21 119 22 107 23 117 24 105 PTFE PTFE PTFE PTFE PTFE PTFE PTFE PTFE PTFE PTFE PTFE PTFE U U U U U U U U U U U U 0.075 0.075 0.075 0.075 0.075 0.075 0.075 0.07S 0.075 0.075 0.075 0.075 0.075 0.075 0.075 0.075 0.075 0.075 0.075 0.075 0.075 0.075 0.075 0.075 30 120 480 30 120 480 30 120 480 30 120 480 30 120 480 30 120 480 30 120 480 30 120 480 ON ON ON OFF OFF OFF ON ON ON OFF OFF OFF ON ON ON OFF OFF OFF ON ON ON OFF OFF OFF 8.00E-10 2.33E-1D 1.60E-10 2.10E-09 7.10E-10 2.80E-10 5.98E-09 2.07E-09 5.90E-10 7.00E-09 2.12E-09 7.19E-10 4.23E-08 1.64E-08 3.58E-09 3.98E-08 4.79E-09 7.44E-10 2.56E-07 B.80E-08 6.15E-08 8.036-07 1.74E-07 5.S5E-08 0.032 0.048 0.076 0.033 0.050 0.069 0.054 0.077 0.157 0.036 0.049 0.069 0.065 0.083 0.119 0.073 0.087 0.155 0.168 0.230 0.407 0.155 0.204 0.242 0.030 0.043 0.055 0.033 0.050 0.069 0.053 0.072 0.137 0.036 0.049 0.069 0.064 0.078 0.099 0.073 0.087 0.155 0.167 0.225 0.387 0.155 0.204 0.242 0.034 0.058 0.116 0.037 0.065 0.130 0.057 0.087 0.198 0.040 0.064 0.130 0.068 0.093 0.160 0.077 0.102 0.216 0.171 0.240 0.448 0.159 0.219 0.303 1.69E+00 1.69E'>00 1.69Et00 1.69E«00 1.69E'»00 1.6n*oo 1.69E*00 1.69E«00 1.69E+00 1.69E+00 1.69E+00 1.69E+00 1.69E+00 1.69E+00 1.69E«00 1.69E+00 1.69Et00 1.69Ei'00 1.69E+00 1.69E4^00 1.69E+00 1.69E+00 1.69E+00 1.69Et00 996 1295 1320 959 1220 1407 1282 1668 2490 1195 1345 1469 448 461 747 585 585 2316 548 585 1768 548 623 996 673 972 997 636 897 1084 959 1345 2167 872 1022 1146 125 138 424 262 262 1993 225 262 1445 225 300 673 1.49Et10 5.49E*09 1.41E*09 1.51E+10 5.67E+09 1.76E«09 2.17E*10 7.48Et09 2.75E+09 2.20E+10 6.58E*09 1.87E-»09 2.04E«09 6.01E'^a8 6.37E*08 6.04E4'09 1.S1E+09 3.52E+09 4.83E'r09 1.466*09 2.08£'>'09 4.97E+09 1.79E+09 1.12E+09
89.7 2.31E«05 1.56E-0S 129.5 2.2SE*05 4.09E-0S 132.9 1.37Et05 9.75E-05
84.7 1.98Et05 1.31E-05
119.5 1.80Et05 3.18E-0S
144.5 1.30E*05 7.41E-05 127.8 2.06Et05 9.516-06 179.3 2.06E'»0S 2.75E-05 288.9 1.64E'>0S 5.95E-05 116.2 2.68E*0S 1.22E-05 136.2 2.15E*05 3.266-05
152.7 1.38E*05 7.38E-05 16.6 1.45E'M)4 7.10E-06 18.3 1.31Et0* 2.186-05
56.5 3.82E*04 6.00E-05 34.9 3.69Et04 6.116-06
34.9 2.94E*04 1.95E-05
265.7 1.39E*05 3.96E-05 29.9 1.35E«04 2.8aE-06
34.9 1.196*0* 8.16E-06
192.6 4.456*0* 2.13E-05 29.9 1.45E*0* 2.93E-06 39.9 1.S5E*a* 8.686-06
89.7 3.03E*0* 2.706-05
0.0038 0.0152 0.0608 0.0038 0.0152 0.0608 0.0038 0.0152 0.0608 0.0038 0.0152 0.0608 0.0038 0.0152 0.0608 0.0038 0.0152 0.0608 0.0038 0.0152 0.0608 0.0038 0.0152 0.0608 0.11 0.26 0.52 0.10 0.23 0.47 o.or 0.17 0.31 0.10 0.24 0.47 0.06 0.16 0.38 0.05 0.15 0.28 0.02 0.06 0.14 0.02 0.07 0.20 REPLICATE 2 25 144 26 127 27 130 28 142 29 131 30 125 31 129 32 140 33 128 34 136 35 139 36 137 37 141 38 146 39 145 40 126 41 132 42 135 43 138 44 143 45 148 46 147 47 134 48 133 PTFE PTFE PTF6 PTFE PTFE PTFE PTFE PTFE PTFE PTFE PTF6 PTFE U U U U U U U u u u u u 0.075 0.075 0.075 0.075 0.075 0.075 0.075 0.075 0.075 0.075 0.075 0.075 0.075 0.075 0.075 0.075 0.075 0.075 0.075 0.075 0.075 0.075 0.075 0.075 30 120 480 30 120 480 30 120 480 30 120 480 30 120 480 30 120 480 30 120 480 30 120 480 ON ON ON OFF OFF OFF ON ON ON OFF OFF OFF ON ON ON OFF OFF OFF ON ON ON OFF OFF OFF 1.24E-09 4.10E-10 7.00E-11 3.40E-09 4.10E-10 9.40E-11 1.58E-09 2.31E-09 3.40E-10 2.18E-09 7.58E-10 3.15E-10 4.01E-08 1.096-08 2.136-09 1.786-08 4.726-09 1.45E-09 1.846-07 8.786-08 1.506-07 1.976-07 4.106-08 8.136-09 0.034 0.050 0.083 0.057 0.054 0.070 0.083 0.109 0.213 0.052 0.066 0.099 0.071 0.093 0.157 0.078 0.090 0.151 0.181 0.233 0.464 0.239 0.221 0.374 0.033 0.045 0.062 0.057 0.054 0.070 0.082 0.104 0.193 0.052 0.066 0.099 0.070 0.088 0.137 0.078 0.090 0.151 0.180 0.228 0.444 0.239 0.221 0.374 0.037 0.060 0.123 0.060 0.069 0.131 0.086 0.119 0.254 0.056 0.081 0.160 0.074 0.103 0.198 0.082 0.106 0.212 0.184 0.243 0.505 0.243 0.236 0.435 1.696*00 1.696*00 1.696*00 1.69E*00 1.69E*00 1.69E*00 1.696*00 1.696*00 1.69E*00 1.696+00 1.696+00 1.696*00 1.696*00 1.696*00 1.696*00 1.696*00 1.696*00 1.696*00 1.696*00 1.696*00 1.69E*00 1.69E*00 1.69E*00 1.69E*00 1245 1370 1743 1345 1320 1643 1494 1967 1917 1494 1693 1718 473 672 1121 548 647 822 573 996 2664 847 921 1295 922 1047 1*20 1022 997 1320 1171 1644 1594 1171 1370 1395 150 349 798 225 324 499 250 673 2341 524 598 972 2.08E*10 5.91E*09 1.96E*09 2.63E*10 6.406*09 2.19E*09 2.63E*10 8.89E*09 2.176*09 3.076*10 9.11E*09 2.32E*09 2.74E*09 2.056*09 1.226*09 4.976*09 1.966*09 8.086*08 5.526*09 4.136*09 2.986*09 1.37E*10 3.95E*09 1.676*09
122.9 3.076*05 1.48E-05 139.5 2.36E*0S 4.006-05
189.3 1.88E*05 9.57E-05 136.2 2.076*05 7.866-06
132.9 1.926*05 3.016-05
175.9 1.606*05 7.336-05
156.1 1.686*05 6.37E-06 219.1 1.82E*05 2.05E-05
212.5 8.84E*0* *.08E-05 156.1 2.59E*05 8.466-06 182.6 2.27E*05 2.496-05
185.9 1.326*05 5.676-05 19.9 1.78E*0* 6.516-06 46.5 *.136*0* 2.016-OS 106.3 5.94E*0* 4.866-05
29.9 2.856*0* 5.746-06 43.1 3.686*0* 1.876-05 66.5 3.276*0* 4.056-05 J3.3 1.44E*0* 2.616-06 89.7 3.50E*0* 8.*86-06
312.1 6.43E*0* 2.166-05
69.8 2.61E*04 1.916-06
79.7 3.176*0* 8.04E-06 129.5 3.036*0* 1.826-05
•
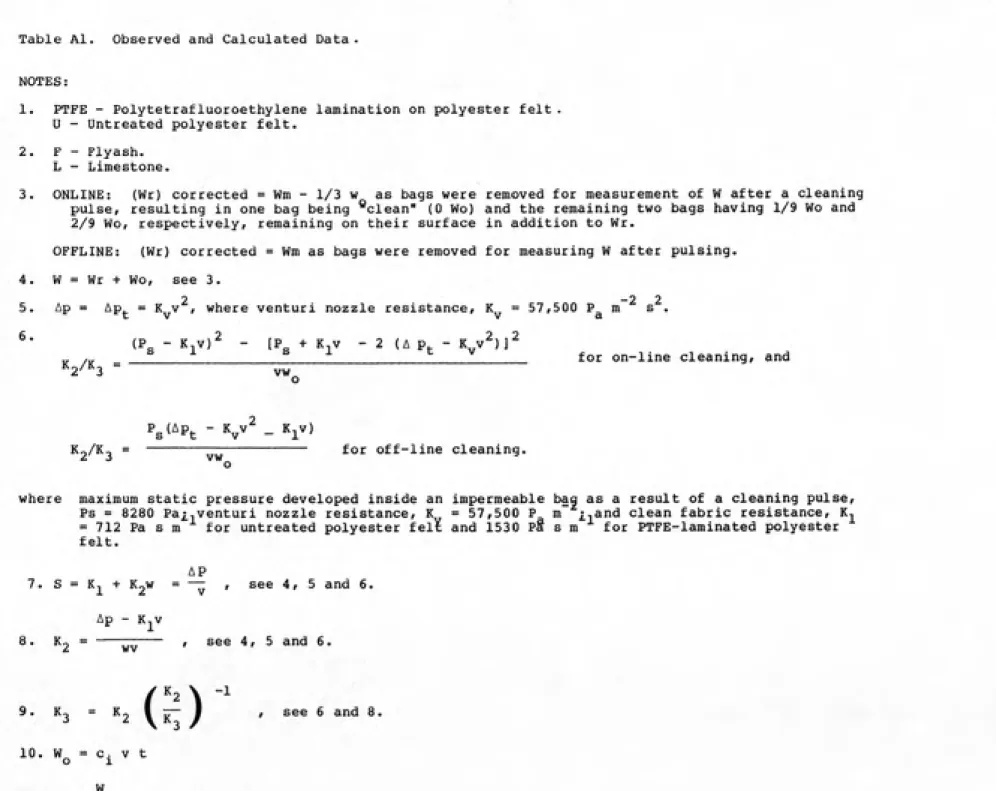
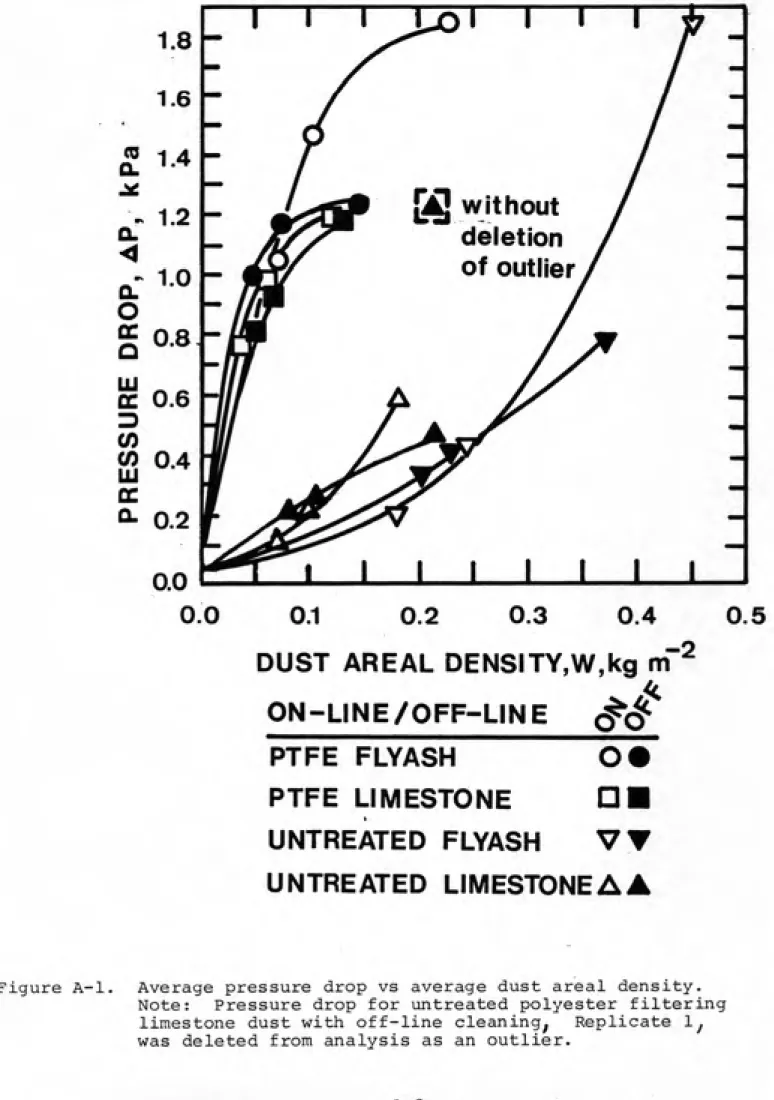
Table Al. Observed and Calculated Data .
NOTES:
1. PTFE - Polytetrafluocoethyiene laaination on polyester felt.
U - Untreated polyester felt.
2. F - Flyash.
L - Limestone.
3. ONLINE: (Wr) corrected = Wra - 1/3 w as bags were removed for measurement of W after a cleaning
pulse, resulting in one bag being ®clean" (0 Wo) and the remaining two bags having 1/9 Wo and
2/9 Wo, respectively, remaining on their surface in addition to Wr.
OFFLINE: (Wr) corrected = Wm as bags were removed for measuring w after pulsing.
4. W = Wr + Wo, see 3.
2 -2 2
5. Ap = Ap. = K„v , where venturi nozzle resistance, K„ = 57,500 P^ ra s .t v v a
^' (P„ - K,v)2 - tP„ + K,v - 2 (A p. - K v^)]^
„ /„ __________ ___________ ______ for on-line cleaning, and
^2/'^3 = vw„
oPgtAPt - V^ - ^l''^
K^/Ko = —ͣ'ͣ*'---—--- for off-line cleaning.
o
where maximum static pressure developed inside an impermeable bag as a result of a cleaning pulse,
Ps = 8280 Pa£,venturi nozzle resistance, K = 57,500 P m~ i,and clean fabric resistance, K,
= 712 Pa s m for untreated polyester felt and 1530 PS s m for PTFE-laminated polyester
felt.
AP
7. S = K, + K2W = —- , see 4, 5 and 6.
Ap - Kj^v
8. K, = ---~--- t see 4, 5 and 6.
9.
^3
= K^ \
10.
^o = C. V t
"0
11. £
~ W '
Q)-'
ͣ
see 6 and 8.see 4 and 10.
•-.j^mmJti^-? 1.4
yQ without
deletion
of outlier
? 0.8
UJ
a, 0.6
tn 0.4
Q- 0.2
0.0
0.1
0.2
0.3
0.4
DUST AREAL DENSITY,W,kg m
ON-LINE/OFF-LINE (^(j^
PTFE FLYASH 0#
PTFE LIMESTONE DB
UNTREATED FLYASH VT
UNTREATED LIMESTONE A A
r2
0.5
Figure A-1.
Average pressure drop vs average dust areal density.
Note: Pressure drop for untreated polyester filtering
limestone dust with off-line cleaning^ Replicate 1^
was deleted from analysis as an outlier.
APPENDIX B
B-1
PARTICLE ANALYSIS
Particle counts were made on filter samples taken
upstream and downstream of the filter systems using the
procedure described by Leith and Ellenbecker (1983).
Particle counts, particle count frequency distributions, and mass frequency distributions from these samples are
contained in Table B1-B6. The average particle size
distributions during Replicate 1 and Replicate 2 for
limestone dust and flyash are shown in Fig. Bl. Tables
B7-B8 contain calculated values of common types of average diameters (Hinds, 1982) for the particle distributions.
Sieve analyses was also made on the bulk dusts used.
The results of these analyses is shown in Fig. B2 which was
extracted from a companion study by Koehler and Leith (1983)
using the same dusts. The sieve analyses were made due to
the observations that: 1) large particles were present in
the feed dust but did not appear on the upstream filter or
settle out in the duct leading to the filter, and 2) large particles tended not to adhere to the filters.
As a consequence of the discrepancy between the results
of the two methods, i.e. the lack of particles above 37.90
urn by particle count and the lack of information on
l^p particles less than approximately 40 um by sieve analysis,
B-2
be based on the assumptions that: 1) particles larger than 37.90 um are totally collected by the filter and 2) the
particle count distributions are representative of particles
in the range of 0 to 37.90 um.
Hinds W. C. (1982) Aerosol Technologyr John Wiley & Sons,
New York.
Koehler J. L. and Leith D. (1983) Model calibration for
pressure drop in a pulse-jet cleaned fabric filter.
Atmospheric Environment 17, 1909-1913.
Leith D. and Ellenbecker. (1983) Dust emissions from a
* • t
TABLE B1. PARTICLE COUNTS BY SIZE RANGE. REPLICATE 1.
SEQ EXP SAMPLE
# # LOCATION AVERAGE PARTICLE DIAMETER IN MICROMETERS
0.10 0.15 0.21 0.30 0.42 0.59 0.84 1.18 1.67 2.37 3.35 4.74 6.70 9.48 13.40 18.95 26.80 37.90
0.00E+00 5.25E+01 4.72E+02 7.87E+02 8.39E+02 1.26E+03 7.87E+02 6.30E+02 9.75E+02 4.89E+02 1.61E+02 4.80E+01 1.30E+01 3.00E+00 1.00E+00 2.00E+00 O.OOE+00 O.OOE+OO
1.05E+02 1.84E+03 4.77E+03 3.67E+03 2.05E+03 1.36E+03 6.82E+02 2.10E+02 2.60E+02 6.70E+01 2.40E+01 1.10E+01 4.00E+00 3.00E+00 2.00E+00 0.00E+O0 O.OOE+00 O.OOE+00
O.OOE+00 8.39E+02 8.39E+02 1.89E+03 2.78E+03 1.84E+03 1.36E+03 1.47E+03 1.09E+03 9.03E+02 3.16E+02 8.40E+01 2.00E+01 4.00E+00 O.OOE+OO 1.00E+00 O.OOE+OO O.OOE+OO
O.OOE+00 2.10E+03 4.56E+03 3.51E+03 1.89E+03 7.87E+02 2.10E+02 1.05E+02 2.08E+02 6.20E+01 1.80E+01 1.00E+01 1.00E+00 4.00E+00 O.OOE+00 O.OOE+00 O.OOE+00 O.OOE+00
5.25E+01 2.10E+02 1.21E+03 1.36E+03 1.47E+03 1.63E+03 1.52E+03 1.10E+03 1.04E+03 8.96E+02 2.88E+02 8.40E+01 1.50E+01 1.00E+00 1.00E+00 O.OOE+00 O.OOE+OO O.OOE+OO
2.62E+02 2.83E+03 1.01E+04 8.97E+03 2.94E+03 1.42E+03 4.20E+02 2.10E+02 3.70E+02 1.02E+02 3.10E+01 9.00E+00 4.00E+00 1.00E+00 O.OOE+00 O.OOE+00 l.OOE+00 O.OOE+00
1.57E+02 3.15E+02 7.34E+02 1,52E+03 1.36E+03 2.15E+03 2.36E+03 1.42E+03 1.16E+03 5.75E+02 2.21E+02 6.00E+01 7.00E+00 2.00E+00 O.OOE+00 O.OOE+00 O.OOE+OO O.OOE+OO
6.30E+02 2.52E+03 2.89E+03 2.10E+03 9.97E+02 6.82E+02 2.62E+02 2.10E+02 1.17E+02 4.50E+01 1.90E+01 5.00E+00 4.00E+00 l.OOE+00 O.OOE+00 O.OOE+00 O.OOE+00 O.OOE+00 5.25E+01 2.10E+02 6.30E+02 7.87E+02 8.92E+02 1.63E+03 1.10E+03 4.72E+02 7.67E+02 3.70E+02 1.58E+02 5.10E+01 1.90E+01 2.00E+00 O.OOE+OO O.OOE+OO O.OOE+OO O.OOE+OO
2.62E+02 8.39E+02 1.31E+03 1.15E+03 6.82E+02 3.15E+02 1.57E+02 5.25E+01 6.80E+01 3.90E+01 2.50E+01 1.10E+01 7.00E+00 1.20E+01 3.00E+00 O.OOE+00 l.OOE+00 O.OOE+00
1.57E+02 3.15E+02 1.10E+03 1.36E+03 1.89E+03 1.15E+03 8.39E+02 7.87E+02 7.26E+02 3.25E+02 9.00E+01 2.10E+01 4.00E+00 l.OOE+00 O.OOE+00 O.OOE+00 O.OOE+00 O.OOE+00
5.46E+03 1.90E+04 2.47E+04 1.26E+04 4.20E+03 1.52E+03 4.72E+02 2.10E+02 3.00E+02 5.90E+01 2.00E+01 1.10E+01 4.00E+00 l.OOE+00 O.OOE+00 O.OOE+00 O.OOE+OO O.OOE+OO
5.77E+02 6.30E+02 1.57E+03 1.26E+03 1.89E+03 1.57E+03 1.47E+03 1.57E+03 6.55E+02 4.27E+02 2.03E+02 7.50E+01 2.90E+01 7.00E+00 5.00E+00 1.00E+01 1.00E+OO O.OOE+00
4.72E+02 6.82E+02 8.39E+02 1.31E+03 1.26E+03 8.39E+02 3.15E+02 2.62E+02 8.30E+01 8.20E+01 4.20E+01 2.10E+01 7.00E+00 3.00E+00 l.OOE+00 O.OOE+OO O.OOE+OO O.OOE+OO
1.05E+02 1.36E+03 2.89E+03 2.52E+03 1.63E+03 1.73E+03 6.82E+02 7.34E+02 5.12E+02 4.38E+02 2.74E+02 1.27E+02 7.30E+01 1.90E+01 4.00E+00 O.OOE+00 O.OOE+00 O.OOE+00
9.44E+02 1.31E+03 2.83E+03 2.94E+03 2.31E+03 3.04E+03 2.20E+03 1.42E+03 1.20E+03 8.78E+02 4.78E+02 2.35E+02 1.23E+02 5.10E+01 9.00E+00 O.OOE+00 O.OOE+00 O.OOE+00 O.OOE+00 4.72E+02 1.63E+03 2.47E+03 2.10E+03 1.84E+03 1.26E+03 7.34E+02 1.03E+03 8.31E+02 3.13E+02 1.18E+02 3.30E+01 1.30E+01 2.00E+00 l.OOE+00 O.OOE+00 O.OOE+00
3.15E+02 2.20E+03 9.23E+03 8.34E+03 4.30E+03 1.15E+03 3.67E+02 2.62E+02 5.24E+02 3.41E+02 1.18E+02 5.10E+01 8.00E+00 8.00E+00 l.OOE+00 O.OOE+00 l.OOE+00 O.OOE+00
1.05E+02 7.34E+02 2.20E+03 1.68E+03 1.15E+03 1.15E+03 1.15E+03 1.05E+03 9.83E+02 6.47E+02 3.02E+02 1.54E+02 6.70E+01 2.30E+01 8.00E+00 O.OOE+00 O.OOE+00 O.OOE+OO
2.10E+02 8.39E+02 1.68E+03 2.52E+03 1.10E+03 5.77E+02 5.77E+02 3.15E+02 3.78E+02 2.32E+02 1.07E+02 2.80E+01 1.80E+01 3.00E+00 2.00E+00 l.OOE+00 O.OOE+OO O.OOE+00
3.67E+02 8.39E+02 1.78E+03 1.99E+03 1.42E+03 1.26E+03 1.15E+03 7.87E+02 8.66E+02 5.84E+02 2.77E+02 1.01E+02 4.10E+01 I^OE+OI,'2.00E+00 O.OOE+00 O.OOE+00 O.OOE+OO
3.10E+03 1.41E+04 1.43E+04 7.50E+03 2.57E+03 1.42E+03 8.92E+02 7.34E+02 5.90E+02 4.54E+02 2.22E+02 8.50E+01 3.80E+01 1.30E+01 5.00E+00 O.OOE+OO O.OOE+00 O.OOE+00
2.10E+02 6.82E+02 2.73E+03 2.62E+03 1.99E+03 1.26E+03 1.10E+03 7.34E+02 8.21E+02 5.62E+02 2.19E+02 9.30E+01 2.40E+01 1.40E+01 O.OOE+00 O.OOE+OO O.OOE+00 O.OOE+00
1.05E+03 2.52E+03 2.89E+03 1.73E+03 7.34E+02 5.25E+02 2.62E+02 2.62E+02 2.37E+02 1.89E+02 7.90E+01 5.10E+01 1.70E+01 5.00E+00 2.00E+00 O.OOE+00 O.OOE+OO O.OOE+00
4.20E+02 5.25E+02 5.77E+02 1.63E+03 2.26E+03 1.78E+03 2.15E+03 1.21E+03 7.46E+02 5.08E+02 2.43E+02 1.10E+02 4.10E+01 1.00E+01 l.OOE+00 O.OOE+OO O.OOE+OO O.OOE+OO
7.34E+02 8.92E+02 2.26E+03 2.73E+03 5.25E+03 4.25E+03 2.10E+03 1.05E+03 3.82E+02 1.54E+02 4.40E+01 1.40E+01 9.00E+00 3.00E+00 2.00E+00 l.OOE+00 l.OOE+00 O.OOE+00
5.25E+01 5.25E+01 2.10E+02 7.87E+02 1.47E+03 9.44E+02 6.30E+02 5.77E+02 6.94E+02 4.11E+02 1.37E+02 5.60E+01 2.00E+01 7.00E+00 l.OOE+00 O.OOE+00 O.OOE+00 O.OOE+00
5.77E+02 2.57E+03 8.97E+03 1.80E+04 1.88E+04 1.30E+04 7.71E+03 2.62E+03 2.75E+03 8.40E+02 1.50E+02 3.60E+01 1.70E+01 4.00E+00 2.00E+00 O.OOE+00 O.OOE+00 O.OOE+OO
5.25E+01 1.57E+02 8.39E+02 2.15E+03 1.73E+03 2.20E+03 1.26E+03 1.10E+03 1.05E+03 5.85E+02 1.66E+02 4.00E+01 1.10E+01 3.00E+00 O.OOE+00 O.OOE+00 O.OOE+00 O.OOE+00
4.20E+02 5.35E+03 2.04E+04 3.25E+04 2.56E+04 1.51E+04 4.88E+03 1.15E+03 2.29E+03 4.59E+02 7.20E+01 1.50E+01 1.10E+01 O.OOE+00 O.OOE+00 O.OOE+00 O.OOE+00 O.OOE+OO
1.57E+02 3.15E+02 9.97E+02 1.63E+03 1.78E+03 1.94E+03 1.68E+03 1.26E+03 2.29E+03 1.37E+03 4.33E+02 1.22E+02 3.70E+01 5.00E+00 3.00E+00 O.OOE+00 O.OOE+00 O.OOE+OO O.OOE+00 8.92E+02 2.62E+03 6.45E+03 7.55E+03 5.40E+03 2.68E+03 1.21E+03 4.17E+03 8.30E+02 8.50E+01 2.30E+01 1.30E+01 5.00E+00 3.00E+00 O.OOE+00 O.OOE+00 O.OOE+OO
5.25E+01 2.10E+02 6.30E+02 1.47E+03 1.05E+03 1.47E+03 1.10E+03 5.77E+02 9.79E+02 4.65E+02 1.54E+02 6.50E+01 1.70E+01 4.00E+00 l.OOE+00 O.OOE+00 O.OOE+OO O.OOE+OO
B-3
1 111 UP
1 111 ON
2 122 UP
2 122 ON
3 120 UP
3 120 ON
4 108 UP
4 108 DN
5 112 UP
5 112 DN
6 109 UP
6 109 DN
7 106 UP
7 106 DN
8 124 UP
8 124 DN
9 121 UP
9 121 DN
10 101 UP
10 101 DN 11 115 UP
11 115 DN
12 116 UP
12 116 DN
13 104 UP
13 104 DN
14 110 UP
14 110 DN
15 114 UP
15 114 DN
16 103 UP 16 103 DN
17 113 UP
TABLE B1. PARTICLE COUNTS BY SIZE RANGE. REPLICATE 1.
SEQ EXP SAMPLE # # LOCATION
17 113 DN
18 102 UP
18 102 DN
19 123 UP ( 19 123 DN
20 118 UP
20 118 DN . 21 119 UP !
21 119 DN
22 107 UP 3 22 107 DN ; 23 117 UP
23 117 DN
24 105 UP i
24 105 DN '.
AVERAGE PARTICLE DIAMETER IN MICROMETERS
0.10 0.15 0.21 0.30 0.42 0.59 0.84 1.18 1.67 2.37 3.35 4.74 6.70 9.48 13.40 18.95 26.80 37.90 4.20E+02 1.78E+03 4.20E+03 7.50E+03 8.24E+03 5.09E+03 2.05E+03 3.67E+02 7.61E+02 1.12E+02 1.50E+01 5.00E+00 2.00E+00 O.OOE+00 1.00E+00 O.OOE+00 1.00E+00 O.DOE+00 O.OOE+00 2.10E+02 4.20E+02 7.34E+02 9.97E+02 7.34E+02 7.34E+02 6.30E+02 7.49E+02 3.46E+02 9.10E+01 1.70E+01 7.00E+00 1.00E+00 1.00E+00 O.OOE+OO O.OOE+00 O.OOE+00 1.05E+02 1.89E+03 7.24E+03 1.08E+04 5.77E+03 1.89E+03 3.15E+02 5.25E+01 4.81E+02 4.40E+01 5.00E+00 6.00E+00 2.00E+00 O.OOE+00 O.OOE+OO O.OOE+OO O.OOE+OO O.OOE+OO O.OOE+00 1.26E+03 4.88E+03 5.67E+03 4.88E+03 2.99E+03 2.62E+03 8.39E+02 9.85E+02 4.29E+02 1.29E+02 4.20E+01 1.10E+01 1.00E+00 1.00E+00 1.00E+00 O.OOE+OO O.OOE+OO 1.05E+02 8.92E+02 1.99E+03 2.20E+03 1.63E+03 1.73E+03 1.31E+03 8.92E+02 9.04E+02 7.47E+02 3.31E+02 1.18E+02 3.40E+01 5.00E+00 4.00E+00 O.OOE+00 O.OOE+OO O.OOE+OO 2.10E+02 6.30E+02 2.36E+03 2.47E+03 1.63E+03 1.36E+03 9.97E+02 1.21E+03 9.61E+02 8.30E+02 3.25E+02 1.43E+02 4.80E+01 1.80E+01 1.00E+00 O.OOE+00 O.OOE+00 O.OOE+OO 2.62E+02 2.62E+03 9.50E+03 9.97E+03 6.82E+03 4.20E+03 1.68E+03 1.05E+03 1.27E+03 5.30E+02 1.35E+02 5.00E+01 1.30E+01 4.00E+00 O.OOE+00 O.OOE+00 O.OOE+00 O.OOE+OO 5.25E+01 8.39E+02 2.20E+03 3.57E+03 2.41E+03 1.52E+03 1.10E+03 1.15E+03 9.07E+02 7.52E+02 3.59E+02 1.38E+02 3.70E+01 1.00E+01 1.00E+00 O.OOE+00 O.OOE+00 O.OOE+00
1.05E+02 9.44E+02 2.31E+03 2.41E+03 1.99E+03 1.63E+03 1.10E+03 1.36E+03 1.03E+03 1.06E+03 5.11E+02 2.26E+02 5.80E+01 2.60E+01 9.00E+00 2.00E+00 1.00E+00 O.OOE+OO
5.67E+02 1.52E+03 2.73E+03 2.62E+03 1.63E+03 1.63E+03 1.63E+03 1.31E+03 9.22E+02 5.94E+02 3.00E+02 1.58E+02 5.10E+01 1.80E+01 5.00E+00 2.00E+00 O.OOE+00 O.OOE+00 2.62E+02 2.62E+03 5.35E+03 5.35E+03 4.20E+03 3.15E+03 1.99E+03 1,63E+03 8.86E+02 6.38E+02 3.25E+02 1.44E+02 7.40E+01 5.20E+01 1.10E+01 8.00E+00 1.00E+00 2.00E+00 1.05E+02 1.57E+03 2.62E+03 2.36E+03 1.84E+03 8.92E+02 9.97E+02 6.82E+02 8.03E+02 5.29E+02 2.52E+02 9.40E+01 2.50E+01 6.00E+00 1.00E+00 O.OOE+OO O.OOE+OO O.OOE+OO 3.67E+02 2.89E+03 8.50E+03 6.98E+03 5.82E+03 2.57E+03 1.63E+03 8.39E+02 1.07E+03 7.81E+02 4.07E+02 2.09E+02 9.50E+01 3.50E+01 1.40E+01 4.00E+00 O.OOE+00 O.OOE+00 4.93E+03 6.82E+03 5.40E+03 4.35E+03 1.94E+03 1.73E+03 7,87E+02 8.92E+02 5.22E+02 3.98E+02 2.71E+02 1.75E+02 9.10E+01 3.80E+01 1.40E+01 1.60E+01 1.00E+00 1.00E+0C 5.77E+02 6.30E+02 2.57E+03 2.94E+03 2.57E+03 2.26E+03 1.84E+03 9.44E+02 8.26E+02 4.32E+02 1.56E+02 5.70E+01 1.70E+01 1.40E+01 1.00E+01 1.80E+01 O.OOE+OO O.OOE+OO
TABLE B2. PARTICLE COUNT FREQUENCY DISTRIBUTION BY SIZE RANGE. REPLICATE 1.
AVERAGE PARTICLE DIAMETER IN MICROMETERS
0.10 0.15 0.21 0.30 0.42 0.59 0.84 1.18 1.67 2.37 3.35 4.74 6.70 9.48 13.40 18.95 26.80 37.90
O.OOE+OO 8.05E-03 7.24E-02 1.21E-01 1.29E-01 1.93E-01 1.21E-01 9.66E-02 1.50E-01 7.50E-02 2.47E-02 7,36E-03 1.99E-03 4.60E-04 1.53E-04 3.07E-04 O.OOE+OO O.OOE+00
6.97E-03 1.22E-01 3.17E-01 2.44E-01 1.36E-01 9.06E-02 4.53E-02 1.39E-02 1.73E-02 4.45E-03 1.59E-03 7.30E-04 2.66E-04 1.99E-04 1,33E-04 O.OOE+OO O.OOE+OO O.OOE+OO
O.OOE+00 6.25E-02 6.25E-02 1.41E-01 2.07E-01 1.37E-01 1.02E-01 1.09E-01 8.10E-02 6.72E-02 2.35E-02 6.25E-03 1.49E-03 2.98E-04 O.OOE+OO 7.44E-05 O.OOE+OO O.OOE+OO
O.OOE+OO 1.56E-01 3.39E-01 2.61E-01 1.40E-01 5.84E-02 1.56E-02 7.79E-03 1.54E-02 4.60E-03 1.34E-03 7.42E-04 7.42E-05 2.97E-04 O.OOE+00 O.OOE+00 O.OOE+00 O.OOE+00
4.83E-03 1.93E-02 1.11E-01 1.25E-01 1.35E-01 1.50E-01 1.40E-01 1.01E-01 9.52E-02 8.24E-02 2.65E-02 7.73E-03 1.38E-03 9.20E-05 9.20E-05 O.OOE+00 O.OOE+00 O.OOE+OO
9.47E-03 1.02E-01 3.66E-01 3.24E-01 1.06E-01 5.11E-02 1.52E-02 7.58E-03 1.34E-02 3.68E-03 1.12E-03 3.25E-04 1.44E-04 3.61E-05 O.OOE+00 O.OOE+00 3.61E-05 O.OOE+00
1.31E-02 2.61E-02 6.10E-02 1.26E-01 1.13E-01 1.79E-01 1.96E-01 1.18E-01 9.64E-02 4.77E-02 1.83E-02 4.98E-03 5.81E-04 1.66E-04 O.OOE+OO O.OOE+OO O.OOE+OO O.OOE+00
6.01E-02 2.40E-01 2.75E-01 2.00E-01 9.52E-02 6.51E-02 2.50E-02 2.00E-02 1.12E-02 4.30E-03 1.81E-03 4.77E-04 3.82E-04 9.55E-05 O.OOE+00 O.OOE+00 O.OOE+OO O.OOE+OO
7.35E-03 2.94E-02 8.82E-02 1.10E-01 1.25E-01 2.28E-01 1.54E-01 6.61E-02 1.07E-01 5.18E-02 2.21E-02 7.15E-03 2.66E-03 2.80E-04 O.OOE+00 O.OOE+00 O.OOE+00 O.OOE+00 5.31E-02 1.70E-01 2.65E-01 2.34E-01 1.38E-01 6.37E-02 3.19E-02 1.06E-02 1.38E-02 7.89E-03 5.06E-03 2.23E-03 1.42E-03 2.43E-03 6.07E-04 O.OOE+00 2.02E-04 O.OOE+00
1.79E-02 3.59E-02 1.26E-01 1.55E-01 2.15E-01 1.32E-01 9.57E-02 8.97E-02 8.27E-02 3.70E-02 1.03E-02 2.39E-03 4.56E-04 1.14E-04 O.OOE+00 O.OOE+00 O.OOE+OO O.OOE+00
7.96E-02 2.77E-01 3.60E-01 1.84E-01 6.12E-02 2.22E-02 6.89E-03 3.06E-03 4.38E-03 8.61E-04 2.92E-04 1.60E-04 5.84E-05 1.46E-05 O.OOE+OO O.OOE+00 O.OOE+OO O.OOE+OO
4.83E-02 5.27E-02 1.32E-01 1.05E-01 1.58E-01 1.32E-01 1.23E-01 1.32E-01 5.48E-02 3.57E-02 1.70E-02 6.27E-03 2.43E-03 5.85E-04 4.18E-04 8.36E-04 8.36E-05 O.OOE+00
7.59E-02 1.10E-01 1.35E-01 2.11E-01 2.02E-01 1.35E-01 5.06E-02 4.22E-02 1.33E-02 1.32E-02 6.75E-03 3.3aE-03 1.13E-03 4.82E-04 1.61E-04 O.OOE+00 O.OOE+OO O.OOE+00
8.01E-03 1.04E-01 2.20E-01 1.92E-01 1.24E-01 1.32E-01 5.21E-02 5.61E-02 3.91E-02 3.35E-02 2.09E-02 9.70E-03 5.58E-03 1.45E-03 3.05E-04 O.OOE+OO O.OOE+OO O.OOE+OO
4.73E-02 6.57E-02 1.42E-01 1.47E-01 1.16E-01 1.52E-01 1.10E-01 7.09E-02 6.01E-02 4.40E-02 2.39E-02 1.18E-02 6.16E-03 2.55E-03 4.51E-04 O.OOE+00 O.OOE+00 O.OOE+00 O.OOE+OO 3.68E-02 1.27E-01 1.92E-01 1.64E-01 1.43E-01 9.81E-02 5.72E-02 8.02E-02 6.48E-02 2.44E-02 9.20E-03 2.57E-03 1.01E-03 1.56E-04 7.79E-05 O.OOE+OO O.OOE+00
1.16E-02 8.09E-02 3.39E-01 3.06E-01 1.58E-01 4.24E-02 1.35E-02 9.63E-03 1.92E-02 1.25E-02 4.33E-03 1.87E-03 2.94E-04 2.94E-04 3.67E-05 O.OOE+OO 3.67E-05 O.OOE+00
9.19E-03 6.43E-02 1.93E-01 1.47E-01 1.01E-01 1.01E-01 1.01E-01 9.19E-02 8.61E-02 5.67E-02 2.65E-02 1.35E-02 5.87E-03 2.01E-03 7.01E-04 O.OOE+00 O.OOE+OO O.OOE+00
2.44E-02 9.78E-02 1.96E-01 2.93E-01 1.28E-01 6.72E-02 6.72E-02 3.67E-02 4.40E-02 2.70E-02 1.25E-02 3.26E-03 2.10E-03 3.49E-04 2.33E-04 1.16E-04 O.OOE+00 O.OOE+00
3.20E-02 7.31E-02 1.55E-01 1.74E-01 1.23E-01 1.10E-01 1.01E-01 6.85E-02 7.54E-02 5.09E-02 2.41E-02 8.80E-03 3.57E-03 1.04E-03 1.74E-04 O.OOE+00 O.OOE+OO O.OOE+OO 6.73E-02 3.07E-01 3.10E-01 1.63E-01 5.59E-02 3.08E-02 1.94E-02 1.60E-02 1.28E-02 9.87E-03 4.83E-03 1.85E-03 8.26E-04 2.83E-04 1.09E-04 O.OOE+00 O.OOE+00 O.OOE+00
1.61E-02 5.22E-02 2.09E-01 2.01E-01 1.53E-01 9.64E-02 8.43E-02 5.62E-02 6.28E-02 4.30E-02 1.68E-02 7.12E-03 1.84E-03 1.07E-03 O.OOE+00 O.OOE+00 O.OOE+OO O.OOE+OO
9.95E-02 2.39E-01 2.74E-01 1.64E-01 6.96E-02 4.97E-02 2.49E-02 2.49E-02 2.25E-02 1.79E-02 7.49E-03 4.84E-03 1.61E-03 4.74E-04 1.90E-04 O.OOE+00 O.OOE+00 O.OOE+00
3.44E-02 4.30E-02 4.73E-02 1.33E-01 1.85E-01 1.46E-01 1.76E-01 9.89E-02 6.11E-02 4.16E-02 1.99E-02 9.01E-03 3.36E-03 8.19E-04 8.19E-05 O.OOE+00 O.OOE+OO O.OOE+OO
3.70E-02 4.49E-02 1.14E-01 1.37E-01 2.64E-01 2.14E-01 1.06E-01 5.28E-02 1.92E-02 7.75E-03 2.22E-03 7.05E-04 4,53E-04 1.51E-04 1.01E-04 5.03E-05 5.03E-05 O.OOE+00
8.67E-03 8.67E-03 3.47E-02 1.30E-01 2.43E-01 1.56E-01 1.04E-01 9.54E-02 1.15E-01 6.80E-02 2.27E-02 9.26E-03 3.31E-03 1.16E-03 1.65E-04 O.OOE+00 O.OOE+00 O.OOE+00
7.58E-03 3.38E-02 1.18E-01 2.36E-01 2.48E-01 1.71E-01 1.01E-01 3.45E-02 3.61E-02 1.10E-02 1.97E-03 4.73E-04 2.23E-04 5.26E-05 2.63E-05 O.OOE+OO O.OOE+00 O.OOE+00
4.62E-03 1.39E-02 7.40E-02 1.90E-01 1.53E-01 1.94E-01 1.11E-01 9.71E-02 9.23E-02 5.16E-02 1.46E-02 3.52E-03 9.69E-04 2.64E-04 O.OOE+00 O.OOE+OO O.OOE+OO O.OOE+00
3.88E-03 4.94E-02 1.88E-01 3.00E-01 2.37E-01 1.40E-01 4.51E-02 1.07E-02 2.11E-02 4.24E-03 6.65E-04 1.39E-04 1.02E-04 O.OOE+OO O.OOE+00 O.OOE+OO O.OOE+OO O.OOE+00
1.12E-02 2.25E-02 7.11E-02 1.16E-01 1.27E-01 1.39E-01 1.20E-01 8.98E-02 1.63E-01 9.75E-02 3.09E-02 8.71E-03 2.64E-03 3.57E-04 2.14E-04 O.OOE+00 O.OOE+00 O.OOE+00 O.OOE+00 2.79E-02 8.21E-02 2.02E-01 2.37E-01 1.69E-01 8.38E-02 3.78E-02 1.31E-01 2.60E-02 2.66E-03 7.20E-04 4.07E-04 1.57E-04 9.39E-05 O.OOE+OO O.OOE+00 O.OOE+00
6.36E-03 2.55E-02 7.64E-02 1.78E-01 1.27E-01 1.78E-01 1.34E-01 7.00E-02 1.19E-01 5.64E-02 1.87E-02 7.89E-03 2.06E-03 4.85E-04 1.21E-04 O.OOE+00 O.OOE+00 O.OOE+00
B-5
SEQ EXP SAMPLE
# § LOCATION
1 111 UP
1 111 DN
2 122 UP
2 122 DN
3 120 UP
3 120 DN 4 108 UP
4 108 DN
5 112 UP
5 112 ON
6 109 UP
6 109 DN
7 106 UP
7 106 DN
8 124 UP 1
8 124 DN r
9 121 UP
9 121 DN
10 101 UP <
10 101 DN : 11 115 UP
11 115 DN <
12 116 UP
12 116 DN < 13 104 UP
13 104 DN 14 110 UP 1 14 110 DN
15 114 UP i
15 114 dn : 16 103 UP
16 103 DN (
TABLE B2. PARTICLE COUNT FREQUENCY DISTRIBUTION BY SIZE RANGE. REPLICATE 1.
AVERAGE PARTICLE DIAMETER IN MICROMETERS
0.10 0.15 0.21 0.30 0.42 0.59 0.84 1.18 1.67 2.37 3.35 4.74 6.70 9.48 13.40 18.95 26.80 37.90 1.37E-02 5.84E-02 1.37E-01 2.46E-01 2.70E-01 1.67E-01 6.70E-02 1.20E-02 2.49E-02 3.67E-03 4.91E-04 1.64E-04 6.55E-05 O.OOE+00 3.27E-05 O.OOE+00 3.27E-05 O.OOE+00 O.OOE+00 3.70E-02 7.40E-02 1.30E-01 1.76E-01 1.30E-01 1.30E-01 1.11E-01 1.32E-01 6.10E-02 1.60E-02 3.00E-03 1.23E-03 1.76E-04 1.76E-04 O.OOE+00 O.OOE+00 O.OOE+00 3.67E-03 6.60E-02 2.53E-01 3.78E-01 2.02E-01 6.60E-02 1.10E-02 1.83E-03 1.68E-02 1.54E-03 1.75E-04 2.10E-04 6.99E-05 O.OOE+00 O.OOE+00 O.OOE+00 O.OOE+00 O.OOE+00 O.OOE+00 5.09E-02 1.97E-01 2.29E-01 1.97E-01 1.21E-01 1.06E-01 3.39E-02 3.98E-02 1.73E-02 5.22E-03 1.70E-03 4.45E-04 4.04E-05 4.04E-05 4.04E-05 O.OOE+00 O.OOE+00 8.14E-03 6.91E-02 1.55E-01 1.71E-01 1.26E-01 1.34E-01 1.02E-01 6.91E-02 7.01E-02 5.79E-02 2.57E-02 9.15E-03 2.64E-03 3.88E-04 3.10E-04 O.OOE+00 O.OOE+00 O.OOE+00 1.59E-02 4.77E-02 1.79E-01 1.87E-01 1.23E-01 1.03E-01 7.56E-02 9.15E-02 7.29E-02 6.29E-02 2.46E-02 1.08E-02 3.64E-03 1.37E-03 7.58E-05 O.OOE+00 O.OOE+00 O.OOE+00 6.89E-03 6.89E-02 2.49E-01 2.62E-01 1.79E-01 1.10E-01 4.41E-02 2.75E-02 3.33E-02 1.39E-02 3.54E-03 1.31E-03 3.41E-04 1.05E-04 O.OOE+00 O.OOE+00 O.OOE+00 O.OOE+00 3.48E-03 5.57E-02 1.46E-01 2.37E-01 1.60E-01 1.01E-01 7.32E-02 7.67E-02 6.02E-02 4.99E-02 2.38E-02 9.17E-03 2.46E-03 6.64E-04 6.64E-05 O.OOE+00 O.OOE+00 O.OOE+00 7.10E-03 6.39E-02 1.56E-01 1.63E-01 1.35E-01 1.10E-01 7.46E-02 9.23E-02 6.95E-02 7.18E-02 3.46E-02 1.53E-02 3.92E-03 1.76E-03 6.09E-04 1.35E-04 6.77E-05 O.OOE+00 2.37E-02 9.83E-02 1.76E-01 1.69E-01 1.05E-01 1.05E-01 1.05E-01 8.47E-02 5.96E-02 3.84E-02 1.94E-02 1.02E-02 3.29E-03 1.16E-03 3.23E-04 1.29E-04 O.OOE+00 O.OOE+00 9.83E-03 9.83E-02 2.00E-01 2.00E-01 1.57E-01 1.18E-01 7.47E-02 6.09E-02 3.32E-02 2.39E-02 1.22E-02 5.39E-03 2.77E-03 1.95E-03 4.12E-04 3.00E-04 3.75E-05 r.49E-05
8.21E-03 1.23E-01 2.05E-01 1.85E-01 1.44E-01 6.98E-02 7.80E-02 5.34E-02 6.28E-02 4.14E-02 1.97E-02 7.36E-03 1.96E-03 4.70E-04 7.83E-05 O.OOE+00 O.OOE+00 O.OOE+00
1.14E-02 8.96E-02 2.64E-01 2.17E-01 1.81E-01 7.98E-02 5.05E-02 2.61E-02 3.33E-02 2.43E-02 1.26E-02 6.49E-03 2.95E-03 1.09E-03 4.35E-04 1.24E-04 O.OOE+00 O.OOE+00
1.74E-01 2.40E-01 1.90E-01 1.53E-01 6.84E-02 6.10E-02 2.77E-02 3.14E-02 1.84E-02 1.40E-02 9.55E-03 6.16E-03 3.21E-03 1.34E-03 4.93E-04 5.64E-04 3.52E-05 3.52E-05
3.64E-02 3.97E-02 1.62E-01 1.85E-01 1.62E-01 1.42E-01 1.16E-01 5.96E-02 5.21E-02 2.73E-02 9.84E-03 3.60E-03 1.07E-03 8.83E-04 6.31E-04 1.14E-03 O.OOE+00 O.OOE+00
SEQ EXP SAMPLE # « LOCATION
17 113 ON
18 102 UP
18 102 DN
19 123 UP
19 123 DN
20 118 UP
20 118 DN
21 119 UP
21 119 DN
22 107 UP
22 107 DN
23 117 UP
23 117 DN
24 105 UP
24 105 DN