ISSN 2307-7743 http://scienceasia.asia
_______________
2010 Mathematics Subject Classification: 62A86
Key words and phrases: Fuzzy time series, Fuzzy logical relationship, Fuzzified rainfalls
© 2013 Science Asia 1 / 10
FORECASTING RAINFALL OF A REGION BY USING FUZZY TIME SERIES
SONAL DANI1,* AND SANJAY SHARMA2
Abstract. The definition of fuzzy time series was proposed by Song and Chissom .They presented the time invariant model and the time variant model for dealing with forecasting problems. In resent year, many method have been proposed to deal with forecasting problems using fuzzy time series .In this paper we present a new method to deal with forecasting problems based on fuzzy time series .The proposed method belongs to the first order and time variant method Last 18 year total monsoon rainfall (in mm) of region Ambikapur, Chhattisgarh are used to illustrate the forecasting process of proposed method.
INTRODUCTION
Forecasting activity play an important role in our daily life. The classical time series method cannot deal with forecasting problem in which values of time series are linguistic terms represented by fuzzy sets .It has the advantage of reducing the calculation time and simplifying the calculation process. Chen et al. used the difference of the enrollment to present a method of forecast the enrollment of Alabama based on fuzzy time series. In [4], Huang extended chen's work presented and used simplify calculations with addition of heuristic rules to forecast the enrollment. In [3] , chen presented a forecasting method based on high -order fuzzy time series for forecasting the enrollments of university of Alabama.In [2], chen and hwang presented a method based on fuzzy time series to forecast the temperature.[1], presented forecasting first order and time variant method for forecasting the enrollment of university of Alabama.
However the forecasting accuracy rates of the existing fuzzy time series method for forecasting enrollment are not good enough. In this paper , we present a method belonging to first order and time variant methods .It can get a higher forecasting accuracy rate for forecasting rainfall of a region Ambikapur in chhattisgarh.
FUZZY TIME SERIES
In this section we briefly review the concept of fuzzy time series .The main difference of fuzzy time series and traditional time series is that the value of fuzzy time series is represented by fuzzy sets rather than real values. Let U be the universe of discourse, where U={u1,u2,u3...un}.A fuzzy sets defined in the universe of discourse U can be represented as follows:
where fA denotes the membership function of the fuzzy set A, fA:U→[0,1], and fA(ui) denotes the degree of membership of ui belonging to the fuzzy sets A and fA(ui) [0,1],and 1≤ i ≤ n
Definition :Let Y(t) (t =...0,1,2,...) be the universe of discourse and be a subset of R. Assume fi (t)(i =1,2,...) are defined on Y(t), and assume that F(t)is collection of f1(t) ,
f2(t) , f3(t) ,..., then F(t) is called fuzzy time series definition Y(t) (t=...0,1,2,...).
Definition: Assume that F(t) is caused by F(t-1)only ,denotes as F(t-1) → F(t) ,then this
relationship can be expressed F(t) = F(t-1) → F(t) R(t,t-1) , where F(t) = F(t-1) → F(t)
R(t,t-1) is called first order model of F(t) , R(t,t-1) is a fuzzy relation between F(t-1)
and F(t) , and is the Max and Min composition operator.
Definition: Let R(t,t-1) be a first order model of F(t) . If for any t, R(t,t-1) = R(t-1,t-2) , F(t) is called time invariant fuzzy time series .Otherwise it is called variant time series.
Definition :Assume that fuzzified rainfall of i th year is Aj and that of (i+1) th Ak , where Aj and Ak are two fuzzy sets defined in the universe of discourse U , then fuzzy logical relationship can be represented by Aj →Ak , where Aj is called the current state of the logical relationship.
Method for forecasting rainfall using fuzzy time series
The proposed method is as follows, it involves following step
Step 1: Define the universe of U and partition it into several even and equal length intervals u1, u2, u3.... and un. For example, assume that the universe of discourse
U=[500,1900] is partitioned into seven even and equal length intervals u1,u2,u3 u4,u5,u6
and u7 where
u1 =[500,700] , u2 =[700,900], u3 =[900,1100] , u4 =[1100,1300] , u5 =[1300,1500] ,
u6 =[1500,1700] , u7 = [1700,1900].
Table 1: Last 18 year total monsoon rain fall(in mm) Data time series region ,
Ambikapur (C.G)
Year Rainfall(in
mm)
1995 1146.7
1996 1619.7
1997 1139.4
1998 1049.3
1999 1229.5
2000 1236
2001 1820.5
2002 1086
2003 1240.6
2004 858.4
2005 952.7
2006 1066.8
2007 1046.8
2008 1358.4
2009 603.2
2010 649.7
2011 1445.5
2012 1181.8
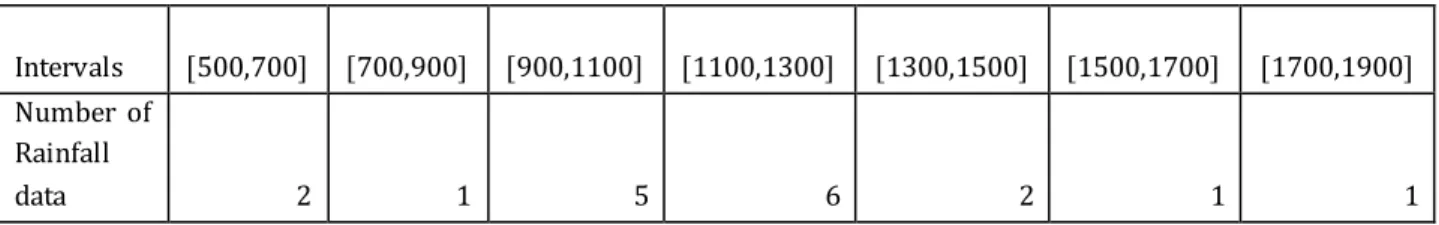
Table 2: The distribution of rainfall data.
Intervals [500,700] [700,900] [900,1100] [1100,1300] [1300,1500] [1500,1700] [1700,1900] Number of
Rainfall
data 2 1 5 6 2 1 1
u1,1 = [500,600] u1,2 =[600,700]
u2 = [700,900]
u3,1 = [900, 966.66]
u3,2=[966.66,1033.26]
u3,3 =
[1033.26,1100]
u4,1 = [1100,1150] u4,2 =[1150 ,1200]
u4,3 = [1200,1250] u4,4 =[1250 ,1300]
u5,1 = [1300,1400] u5,2 =[1400,1500]
u6 =[1500,1700] u7 = [1700,1900]
step3:Define each fuzzy set Ai based on the re-divided interval and fuzzify the rainfall
data shown in Table 1, where fuzzy set Ai denote a linguistic value of rainfall data
represented by a fuzzy set and 1 ≤ i ≤ 14. For example , A1=very very very very few, A2
=very very very few ,A3= very very few, A4 = very few , A6= moderate , A7 = many , A8
= many many , A9 = very many, A10 = too many , A11 = too many many, A12 =too many
many many , A13 =too many many many many , A14 =too many many many many
many ,defined as follows.
A1 =1/ u1,1+ 0.5/ u1,2 + 0/ u2 +0/ u3,1+ 0/ u3,2 + 0/ u3,3 + 0/ u4,1 + 0/ u4,2 +0/ u4,3 + 0/ u4,4
+0/ u5,1 + 0/ u5,2 + 0/ u6 + 0/ u7
A2 =0.5/ u1,1 + 1/ u1,2 + 0.5/ u2 +0/ u3,1+ 0/ u3,2 + 0/ u3,3 + 0/ u4,1 + 0/ u4,2 +0/ u4,3 + 0/ u4,4
+0/ u5,1 + 0/ u5,2 + 0/ u6 + 0/ u7
A3 =0/ u1,1+ 0.5/ u1,2 + 1/ u2 +0.5/ u3,1+ 0/ u3,2 + 0/ u3,3 + 0/ u4,1 + 0/ u4,2 +0/ u4,3 + 0/ u4,4
+0/ u5,1 + 0/ u5,2 + 0/ u6 + 0/ u7
A4 =0/ u1,1+ 0/ u1,2 + 0.5/ u2 +1/ u3,1+ 0/ u3,2 + 0/ u3,3 + 0/ u4,1 + 0/ u4,2 +0/ u4,3 + 0/ u4,4
+0/ u5,1 + 0/ u5,2 + 0/ u6 + 0/ u7
A5 =0/ u1,1+ 0/ u1,2 + 0/ u2 +0.5/ u3,1+ 1/ u3,2 + 0.5/ u3,3 + 0/ u4,1 + 0/ u4,2 +0/ u4,3 + 0/ u4,4
+0/ u5,1 + 0/ u5,2 + 0/ u6 + 0/ u7
+0/ u5,1 + 0/ u5,2 + 0/ u6 + 0/ u7
A7 =0/ u1,1+ 0/ u1,2 + 0/ u2 +0/ u3,1+ 0/ u3,2 + 0.5/ u3,3 + 1/ u4,1 + 0.5/ u4,2 +0/ u4,3 + 0/ u4,4
+0/ u5,1 + 0/ u5,2 + 0/ u6 + 0/ u7
A8 =0/ u1,1+ 0/ u1,2 + 0/ u2 +0/ u3,1+ 0/ u3,2 + 0/ u3,3 + 0.5/ u4,1 + 1/ u4,2 +0.5/ u4,3 + 0/ u4,4
+0/ u5,1 + 0/ u5,2 + 0/ u6 + 0/ u7
A9 =0/ u1,1+ 0/ u1,2 + 0/ u2 +0/ u3,1+ 0/ u3,2 + 0/ u3,3 + 0/ u4,1 + 0.5/ u4,2 +1/ u4,3 + 0.5/ u4,4
+0/ u5,1 + 0/ u5,2 + 0/ u6 + 0/ u7
A10 =0/ u1,1+ 0/ u1,2 + 0/ u2 +0/ u3,1+ 0/ u3,2 + 0/ u3,3 + 0/ u4,1 + 0/ u4,2 +0.5/ u4,3 + 1/ u4,4
+0.5/ u5,1 + 0/ u5,2 + 0/ u6 + 0/ u7
A11 =0/ u1,1+ 0/ u1,2 + 0/ u2 +0/ u3,1+ 0/ u3,2 + 0/ u3,3 + 0/ u4,1 + 0/ u4,2 +0/ u4,3 + 0.5/ u4,4
+1/ u5,1 + 0.5/ u5,2 + 0/ u6 + 0/ u7
A12 =0/ u1,1+ 0/ u1,2 + 0/ u2 +0/ u3,1+ 0/ u3,2 + 0/ u3,3 + 0/ u4,1 + 0/ u4,2 +0/ u4,3 + 0/ u4,4
+0.5/ u5,1 + 1/ u5,2 + 0.5/ u6 + 0/ u7
A13 =0/ u1,1+ 0/ u1,2 + 0/ u2 +0/ u3,1+ 0/ u3,2 + 0/ u3,3 + 0/ u4,1 + 0/ u4,2 +0/ u4,3 + 0/ u4,4
+0/ u5,1 + 0.5/ u5,2 + 1/ u6 + o.5/ u7
A14 =0/ u1,1+ 0/ u1,2 + 0/ u2 +0/ u3,1+ 0/ u3,2 + 0/ u3,3 + 0/ u4,1 + 0/ u4,2 +0/ u4,3 + 0/ u4,4
+0/ u5,1 + 0/ u5,2 + 0.5/ u6 + 1/ u7
For simplicity, the membership value of fuzzy set Ai either 0,0.5 or 1 , where 1 ≤ i ≤ 14 .
then, fuzzify the rainfall data in Table 1 and linguistic value of data A1 , A2 , A3 ,... A14.
The reason for fuzzifying rainfall data into fuzzified data is to translate crisp value into
Step 4: Establish fuzzy logical relationships based on the fuzzified rainfall data:
Aj →Aq,
Aj →Ar
Where the fuzzy logical relationship" Aj →Aq " denotes " if fuzzified rainfall of year n-1 is Aj ,then the fuzzified data of year n is Aq ".For example , based on the fuzzifyrainfall data obtained in step 3, we can get the fuzzy logical relationship as shown in Table 3
Table3 Fuzzy logical relationship
A7 →A13 A13 →A7 A7 →A6
A6 →A9 A9 →A9 A9 →A14
A14 →A6 A6 →A9 A9 →A3
A3 →A4 A4 →A6 A6 →A6
A6 →A11 A11 →A2 A2 →A15
A15 →A8
Step 5: Divide each interval derived in step 2 into four sub interval of equal length, where 0.25 points and 0.75 points of each interval is used as upward and down ward forecasting points of the forecasting. use the following rules to determine whether the trend of forecasting goes up and down and to forecast rainfall. Assume that the fuzzy logical relationship is Ai →Aj where A i denotes fuzzified rainfall of year n-1 and A j denotes fuzzified rainfall of the year n ,then (1) if j > i and the difference of difference of rainfall between years n-1 and n-2 and between n-2 and n-3 is positive , then the trend of forecasting will go up, and we use Rule 2 to fore cast rainfall ; (2) if j > i and the difference of difference of rainfall between years n-1 and n-2 and between n-2 and n-3 is negative , then the trend of forecasting will go down and we use Rule 3 ; (3) if j < i and the difference of difference of rainfall between years n-1 and n-2 and between n-2 and n-3 is positive , then the trend of forecasting will go up, and we use Rule 2 to fore cast rainfall ; (4) if j < i and the difference of difference of rainfall between years 1 and n-2 and between n-n-2 and n-3 is negative , then the trend of forecasting will go down and we use Rule 3 to forecast the rainfall ; (5) if j = i and the difference of difference of rainfall between years n-1 and n-2 and between n-2 and n-3 is positive , then the trend of forecasting will go up, and we use Rule 2 to fore cast rainfall ; (6) if j = i and the difference of difference of rainfall between years n-1 and n-2 and between n-2 and n-3 is negative , then the trend of forecasting will go down and we use Rule 3 to forecast the rainfall
Rule 1: When forecasting the data of year 1997 . there is no data before the rainfall of the year 1994, therefore we are not able to calculate difference of rainfall 1995 and 1994 and the difference of the difference year 1996 and 1995 and between 1995 and 1994. Therefore ,if |(the difference of rainfall between the year1996 and1995)|/2 >half
of the length of interval corresponding to the fuzzified rainfall Aj with membership
value equal to1 ,then trend of forecasting of this interval will go upward , and the forecasting rainfall falls at the 0.75 of this interval ; if |(the difference of the rainfall between the year 1996 and 1995)|/2 = half of the length of interval corresponding to the fuzzified rainfall Aj with membership value equal to1, then the forecasting rainfall falls at the middle value of this interval ; if |(the difference of the rainfall between the year 1996 and 1995)|/2 < half of the length of interval corresponding to the fuzzified rainfall Aj with membership value equal to1 ,then trend of forecasting of this interval will be downward, and the forecasting rainfall falls at 0.25 point of the interval.
Rule 2 : If (|difference of differences between years 1 and 2 and between 2 and n-3|× 2 +the rainfall of year n-1) or (rainfall of the year n-1 -|the difference of differences between yearn-1 and n-2 and n-2 and n-3|× 2) falls in the interval corresponding to the
fuzzified rainfall Aj with membership value equal to1 ,then trend of forecasting of this
interval will go upward , and the forecasting rainfall falls at the 0.75 of this interval
corresponding to the fuzzified rainfall Aj with membership value equal to1, If
(|difference of differences between years n-1 and n-2 and between n-2 and n-3|/ 2 +the rainfall of year n-1) or (rainfall of the year n-1 -|the difference of differences between year n-1 and n-2 and n-2 and n-3|/ 2) falls in the interval corresponding to the
fuzzified rainfall Aj with membership value equal to1 ,then trend of forecasting of this
interval will go downward , and the forecasting rainfall falls at the 0.25 point of this
interval corresponding to the fuzzified rainfall Aj with membership value equal to1 ; if
neigther is the case, than we let the forecasting rainfall be the middle value of the
interval corresponding to the fuzzified rainfall Aj with membership value equal to 1.
Rule 3 : If (|difference of differences between years 1 and 2 and between 2 and n-3|/ 2 +the rainfall of year n-1) or (rainfall of the year n-1 -|the difference of differences between year n-1 and n-2 and n-2 and n-3|/ 2) falls in the interval corresponding to the
fuzzified rainfall Aj with membership value equal to1 ,then trend of forecasting of this
interval will go downward , and the forecasting rainfall falls at the 0.25 point of this
interval corresponding to the fuzzified rainfall Aj with membership value equal to1 ; If
(|difference of differences between years n-1 and n-2 and between n-2 and n-3|× 2 +the rainfall of year n-1) or (rainfall of the year n-1 -|the difference of differences between yearn-1 and n-2 and n-2 and n-3|× 2) falls in the interval corresponding to the
fuzzified rainfall Aj with membership value equal to1 ,then trend of forecasting of this
interval will go upward , and the forecasting rainfall falls at the 0.75 of this interval
corresponding to the fuzzified rainfall Aj with membership value equal to1 if neither is
corresponding to the fuzzified rainfall Aj with membership value equal to 1. Summarizes the forecasting result of proposed method from 1995 to 2012
Table 4, Actual rainfall and forecasting rainfall of Ambikapur (C.G)
Rainfall(in
mm) Trend of forecasting
forecasting rainfall
1995 1146.7
1996 1619.7 middle value 1600
1997 1139.4 upward, 0.75 points 1137.5
1998 1049.3 middle value 1066.62
1999 1229.5 downward, 0.25 point 1212.5
2000 1236 middle value 1225
2001 1820.5 middle value 1800
2002 1086 middle value 1066.62
2003 1240.6 middle value 1225
2004 858.4 middle value 800
2005 952.7 middle value 933.32
2006 1066.8 middle value 1066.58
2007 1046.8 downward, 0.25 point 1049.9
2008 1358.4 upward, 0.75 points 1375
2009 603.2 middle value 650
2010 649.7 middle value 650
2011 1445.5 middle value 1450
2012 1181.8 middle value 1175
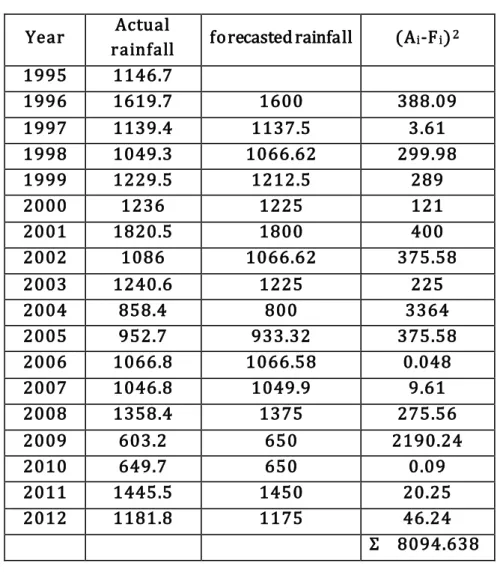
In the following, we use the mean square error (MSE) to compare the forecasting results with different forecasting method, where the mean square error is calculated as follows: MSE = n all ra forecasted all ra Actual n i i i
1 2 ) inf _ inf _ (Table 5: MSE calculation
Year Actual
rainfall forecasted rainfall (Ai-Fi)2
1995 1146.7
1996 1619.7 1600 388.09
1997 1139.4 1137.5 3.61
1998 1049.3 1066.62 299.98
1999 1229.5 1212.5 289
2000 1236 1225 121
2001 1820.5 1800 400
2002 1086 1066.62 375.58
2003 1240.6 1225 225
2004 858.4 800 3364
2005 952.7 933.32 375.58
2006 1066.8 1066.58 0.048
2007 1046.8 1049.9 9.61
2008 1358.4 1375 275.56
2009 603.2 650 2190.24
2010 649.7 650 0.09
2011 1445.5 1450 20.25
2012 1181.8 1175 46.24
Σ 8094.638
MSE = n
n
i
/ Fi) -(Ai
1
2
=8094.638/ 14
=578.188
Conclusion
REFERENCE
[1]chen S.M and chia-ching Hsu 2004.A new method to forecast enrollments using fuzzzy time series.Int.Appl.Sci.Eng,2004.2,3
[2] Chen,S.M and Hwang, J.R.2000.Temperature prediction using fuzzy time series.IEEE Transaction on systems,man,and cybernetics-part B:cybernetics,30:263-275
[3]Chen, S.M 2002.Forecasting enrollment based on high order fuzzy time series. cybernetics and systems :An Proceeding of international journal,,33:1-16.
[4] Huarng, K. 2001. Heuristic models of fuzzy time series for forecasting.Fsets and systems,123:369-386. [5]Hsu,C.C and Chen,S.M 2002.A new method of forecastingenrollment based on fuzzy time series.Proceeding of seventh conference on artificial intelligence and applications,Taichung, Taiwan, Republic of china,17-22
[6] Li, H and Kozma, R 2003.A dynamic neural network method of time series preceeding using the KIII model. Proceeding of international journal of neural network, 1:347-352.
[7]Song, Q.2003.A note on fuzzy time series model selection with sample auto corr ection funtions. cybernetics and systems :An international journal,34:93-107.
[8]Su,S.F and Li, S.H. 2003.Nueral network based fusion of gobal and local information in preceeding time series.Preceeding of 2003 IEEE international joint conference on systems , man and cybernetics ,5 4445-4450
1DEPARTMENT OF APPLIED MATHEMATICS CHHATRAPATI SHIVAJI INSTITUTE OF TECHNOLOGY,
DURG (C.G) INDIA