Project Portfolio Management Planning:
A Method for Prioritizing Projects
Mike Ross r2Estimating, LLC 7755 E. Evening Glow Dr. Scottsdale, AZ 85262-1295
480-488-8366
[email protected] http://www.r2estimating.com
1,2
Abstract— IT departments are caught between a rock and a hard place these days. Budgets are shrinking while the dependence on IT products and services is increasing. The pressure to demonstrate that each new project will either save money, increase sales, or result in enterprise-wide efficiencies is greater than ever. And yet, the majority of Global 1000 companies are still choosing which projects get funding either by the first-come/first served method, the squeaky-wheel gets the grease method, or the most power-ful sponsor method. Deciding which IT projects get funding should be based on more than just subjective judgment; rather, the project should be analyzed objectively, looking at a number of factors – cost of ownership, cycle time, quality, risk, and benefit(s) being just a few. By analyzing projects objectively, they can be more effectively prioritized. CIOs and IT managers can then make wiser and more insightful decisions about which projects should get funding and which should be either postponed or shelved.
T
ABLE OFC
ONTENTS1. INTRODUCTION... 1
2. ATAXONOMY FRAMEWORK FOR PORTFOLIO MANAGEMENT... 2
3. PORTFOLIO PLANNING PROCESS... 2
4. SUMMARY AND CONCLUSION... 7
REFERENCES... 8
BIOGRAPHY... 8
1 © 2007 r2Estimating, LLC. All rights reserved. 2 Initial, January 31, 2007
1.
I
NTRODUCTIONPurpose
The purpose of this paper is to establish some basic taxon-omy for the notion of portfolio management and then to describe a process for performing the portfolio planning part of portfolio management.
Scope
The subject matter in this paper, while primarily geared to large enterprise Information Technology (IT) functions is nonetheless applicable to any enterprise seeking to improve the way it attempts to make decisions about investing in software development projects.
Background
Back during high-growth days of the "go-go '90s," funding for Information Technology (IT) projects wasn't a big deal at many companies. If a project showed interesting potential and/or caught the eye of the right decision maker, it would likely get the thumbs-up.
Times have certainly changed, with competition for re-sources to complete IT projects more intense than ever. To help them prioritize multiple projects, many CIOs and IT managers are applying the principles of investment portfolio management to their portfolios of IT projects. This enables them to evaluate projects based on their contributions to the high-level strategic and financial objectives of the enter-prise.
In other words, they're attempting to manage their project portfolios just like portfolios of investments – continually tracking outlays, returns, potential value and the risk of each project in order to maximize return on investment and ac-complish corporate objectives. Just like an investment port-folio, the goal is to find the proper balance in their project portfolios in order to make the best investments that will maximize returns and minimize risk.
For example, a company might fund a few high-risk projects that have higher potential returns, but would want to balance
this with other low-risk projects that offer more modest returns. Traditionally, this kind of risk-based decision mak-ing has only been applied at the individual project level – the portfolio management concept expands this to collec-tions of projects.
The process of managing Information Technology (IT) projects using a financial investment portfolio metaphor has attracted much interest from CIOs in Fortune 1000 compa-nies. This so-called IT portfolio management process is expected to improve returns on IT investments by ensuring that resources are funneled to those projects that will con-tribute the most to the company’s overall success.
2.
A
T
AXONOMYF
RAMEWORK FORP
ORTFOLIOM
ANAGEMENTThis paper first proposes a definition for Portfolio Manage-ment that closely parallels the essence of Software Project Management as described in the Software Engineering Insti-tute’s (SEI) Capability Maturity Model Integration (CMMI). This essence consists of key processes for Software Project Planning and Software Project Monitoring and Control. Consequently, the paper proposes that portfolio manage-ment be decomposed into analogous key elements: one called portfolio planning and one called portfolio monitor-ing and control. The idea is to zoom out from an individual project view (characteristic of Level 2 organizations) to one that encompasses a collection of projects associated with a particular business enterprise (characteristic of Level 3 and higher organizations).
Portfolio Planning
This paper proposes that portfolio planning is a key element of portfolio management and is analogous to the CMMI Key Process called Software Project Planning. This paper further proposes that, conceptually, portfolio planning as it relates to IT projects means making IT project investment (go – no go) decisions as some function of potential ( esti-mated) Return on Investment (ROI). Historically this has sometimes been referred to as doing a cost-benefit analysis or a trade study.
Portfolio Monitoring and Control
Completing the analogy in the previous paragraph, this pa-per proposes that portfolio monitoring and control is a key element of portfolio management and is analogous to the CMMI Key Process called Software Project Monitoring and Control. This paper further proposes that, conceptually, portfolio monitoring and control as it relates to IT projects means using the artifacts produced by the portfolio planning process as the basis for effectively and efficiently scheduling
on the market today that have specialized in performing this process at the project level and are now offering enhance-ments that make this possible at the portfolio level as well.
3.
P
ORTFOLIOP
LANNINGP
ROCESSThis paper suggests that what’s been missing from most of the discussion about the portfolio planning part of portfolio management is some clear notion of quantification; without which, objective fact-based decisions are virtually impossi-ble to make.
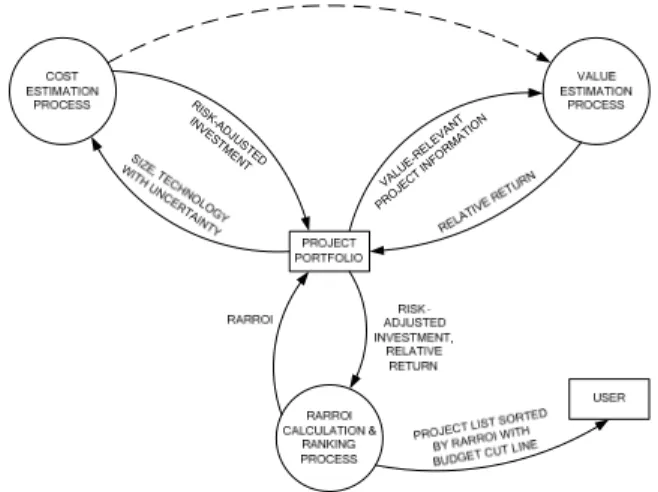
This paper proposes an approach (summarized in Figure 1) that prioritizes (rank-orders) the projects in a given portfolio by a calculated value called Risk-Adjusted Relative Return on Investment (RARROI). Calculation of RARROI requires knowledge of two key estimated quantities, the project's worth to the enterprise (relative return) and the project's cost of ownership (risk-adjusted investment). Knowing these two estimated quantities allows the IT manager to make business decisions the same way a fund manager makes buy, sell, and hold decisions.
RIS K-A
D JUS
TED INV
ES TM
ENT
VALU E-R
ELE VAN
T
PR OJE
CT IN FOR
MA TIO
N
Figure 1: Portfolio Planning Process Data Flow Diagram
Quantifying the Risk-Adjusted Investment
The risk-adjusted investment part of RARROI can be esti-mated as a function of size and efficiency using a structured process that is based on accepted statistical methods and real performance data. Structured estimating methods and tools, such as r2Estimating’s r2Estimator, employ well-established solutions for this part of the problem.
Structured estimating begins by hierarchically decomposing the proposed software product into manageable pieces and then describing each piece in terms of its expected effective
and/or a set of detailed environment parameters), and the associated uncertainties about each.
Expected effective size with uncertainty and expected spe-cific efficiency with uncertainty are mathematically com-bined to yield calculated estimates for duration, effort, cost, staffing, and delivered defects, as well as the confi-dence probability distributions associated with each. It is possible, therefore, to determine a project solution where the cost of ownership (risk-adjusted investment) value has, say, an 80% confidence probability; i.e., there is an 80% prob-ability that the actual outcome cost will not exceed this determined value. Note that 80% is merely an example; each individual enterprise must determine its own risk tolerance. Typical reasonable confidence probability values range from about 70% to 90%.
Quantifying the Return and its Associated Confidence The return, of course, will vary tremendously from project to project as a function of the business environment. Return is very difficult to quantify in terms of some absolute units like dollars since it tends to be influenced by multiple fac-tors such as value to the marketplace, influence on customer satisfaction, influence on enterprise productivity / quality, etc. It is much more tractable to treat return as a normalized relative value. This relative return value can be estimated straight away or it can perhaps be a weighted average of several return parameters.
Regardless of whether return is estimated in aggregate or parametrically, since relationships and influences vary from organization to organization, trying to develop specific algebraic estimation relationships (regressions) may not be the best approach. Instead, this paper proposes establishing normalized relative return values using the Analytic Hierar-chy Process (AHP) [4].
AHP Step 1—The first step in the AHP elicits a hierarchical representation of the decision criteria. The root node of the hierarchy represents the overall objective. The leaf nodes represent the set of decision alternatives. Intermediate levels in the hierarchy represent a decomposition of the relevant attributes of the decision process; i.e., selection criteria. AHP Step 2—The second step in the AHP elicits relational data for comparing the alternatives. This is done via a series of pairwise comparisons between each of the criteria at a given level in the hierarchy with respect to a criterion at the parent level (one level up). The value of a comparison
w
between the
i
th criterion (A
) in levelq
and thej
th crite-rion (B
) in levelq
with respect to a levelq
−
1
(parent) criterionU
is assigned as follows:1
i
j
w
w
=
forA
having the same importance asB
withrespect to
U
.3
i
j
w
w
=
forA
having slightly more importance thanB
with respect toU
.5
i
j
w
w
=
forA
having more importance thanB
withrespect to
U
.7
i
j
w
w
=
forA
having a lot more importance asB
with respect to
U
.9
i
j
w
w
=
forA
totally dominatingB
with respect toU
.1
3
i
j
w
w
=
forA
having slightly less importance thanB
with respect toU
.1
5
i
j
w
w
=
forA
having less importance thanB
with respect toU
.1
7
i
j
w
w
=
forA
having a lot less importance thanB
with respect toU
.1
9
i
j
w
w
=
forA
totally dominated byB
with respect toU
.1 1 1 1
2, 4, 6,8, , , ,
2 4 6 8
i
j
w
w
=
can be used asinterme-diate values.
The results of the pairwise comparisons done for level
q
with respect a criterion at levelq
−
1
where levelq
con-tainsn
criteria can be organized in a positive pairwise comparison matrixA
as1 1 1
1 2
2 2 2
1 2
1 2
n
n
n n n
n
w
w
w
w
w
w
w
w
w
w
w
w
w
w
w
w
w
w
=
A
L
L
M
M
O
M
L
(1) where a bw
w
= Relative importance of the tha
criterion over theb
th criterion where,
1, 2,...,
a b
∈
n
.Note two important characteristics about this type of matrix:
•
1
ii
a
=
(every value on the principal diagonal ofA
is 1)•
1
ij ji
a
a
=
(the values on one side of the principaldiagonal are the mirror reciprocals of the values on the other side of the principal diagonal).
AHP Step 3—The third step in the AHP determines the relative weights for each positive pairwise comparison ma-trix developed in Step 2. Saaty [3] introduced a method for determining the relative criteria weight vector
W
of a comparison matrixA
using the right eigenvector ofA
.max
(
A
−
λ
I W
)
=
0
(2)or
max 1
n
ij j i
j
a w
λ
w
==
∑
(3) where 11
n i iw
==
∑
(4)The matrix algebra necessary to solve for
W
can be quite cumbersome. A convenient numerical method for approxi-matingW
is as follows:n
A
:=A
n
W
:= a column vector, the elements of which are the normalized row sums ofA
nrepeat
n := n+1 n
A
:=A
n-1A
n-1n
W
:= a column vector, the elements of which are the normalized row sums ofn
A
until
−
n-1 n
W
W
is sufficiently small for all ele-mentsAHP applied to determining relative return first determines the return parameter importance (weight) of each return parameter and then determines the relative project impor-tance for each return parameter. The aggregate relative return for a given project is the sum of the weighted return parameters for that project.
Note that the estimation process associated with the risk-adjusted investment must be done before relative project importance for each value parameter is determined (this control dependency indicated by the dashed arrow in Figure 1) since relative importance can change as a function of the particular duration, effort, cost, staffing, and delivered defects associated with a given solution. For example, a certain value parameter could assume a greater importance (weight) for a given project if the project can be delivered sooner.
Calculating Risk-Adjusted Relative Return on Investment (RARROI)
Risk-Adjusted Relative Return on Investment (RARROI) is simply the ratio of the relative return to the risk-adjusted investment as shown in Equation (5).
1 n i i i P C
R W
RARROI
I
==
∑
(5) whereRARROI
i
R
= Normalized relative project importance for thei
th return parameter.i
W
= Normalized relative parameter impor-tance (weight) for thei
th return pa-rameter.C
I
= Normalized relative investment (cost of ownership) with confidence percentageC
whereC
represents the enterprise standard risk tolerance (desired prob-ability of success).RARROI-Based Investment Decision Making
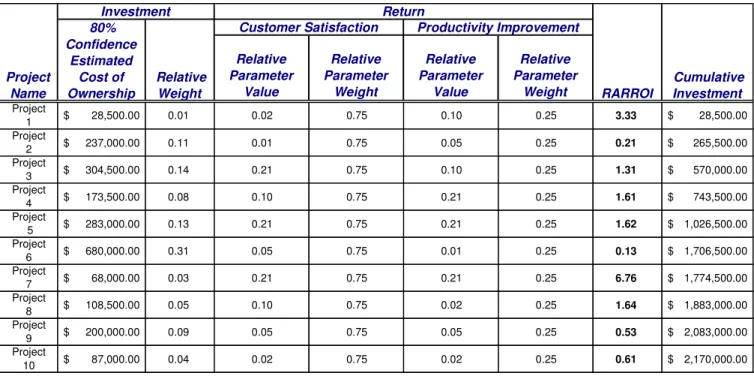
Once Risk-Adjusted Relative Return on Investment (RARROI) has been calculated for each project, all that remains is to rank order the projects by descending RARROI. Adding a column for cumulative estimated in-vestment in dollars provides a quick means of determining where the budget cut line should be drawn.
An Example
The following is a series of figures that show the sequence of the portfolio planning process steps for a portfolio of ten projects where a project’s return is determined by its impor-tance to customer satisfaction and productivity improvement and where the enterprise’s risk tolerance has been estab-lished at 80%. The enterprise’s budget for this portfolio is $1,000,000.
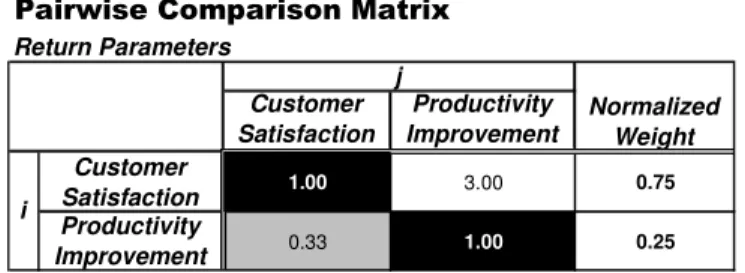
Figure 2: AHP Decision Hierarchy for the Project Port-folio’s Return Evaluation
Pairwise Comparison Matrix
Customer Satisfaction
Productivity Improvement Customer
Satisfaction 1.00 3.00 0.75
Productivity
Improvement 0.33 1.00 0.25
Normalized Weight i
j Return Parameters
Figure 3: Pairwise Comparison Matrix and Normalized Relative Weights for the Return Parameters
Project 1
Project 2
Project 3
Project 4
Project 5
Project 6
Project 7
Project 8
Project 9
Project 10 Project
1 1.00 3.00 0.14 0.20 0.14 0.33 0.14 0.20 0.33 1.00 0.02
Project
2 0.33 1.00 0.11 0.14 0.11 0.20 0.11 0.14 0.20 0.33 0.01
Project
3 7.00 9.00 1.00 3.00 1.00 5.00 1.00 3.00 5.00 7.00 0.21
Project
4 5.00 7.00 0.33 1.00 0.33 3.00 0.33 1.00 3.00 5.00 0.10
Project
5 7.00 9.00 1.00 3.00 1.00 5.00 1.00 3.00 5.00 7.00 0.21
Project
6 3.00 5.00 0.20 0.33 0.20 1.00 0.20 0.33 1.00 3.00 0.05
Project
7 7.00 9.00 1.00 3.00 1.00 5.00 1.00 3.00 5.00 7.00 0.21
Project
8 5.00 7.00 0.33 1.00 0.33 3.00 0.33 1.00 3.00 5.00 0.10
Project
9 3.00 5.00 0.20 0.33 0.20 1.00 0.20 0.33 1.00 3.00 0.05
Project
10 1.00 3.00 0.14 0.20 0.14 0.33 0.14 0.20 0.33 1.00 0.02
Normalized Weight
i
j
Pairwise Comparison Matrix
Customer Satisfaction
Figure 4: Pairwise Comparison Matrix and Normalized Relative Weights for Projects vis-à-vis Customer Satisfaction
Project 1
Project 2
Project 3
Project 4
Project 5
Project 6
Project 7
Project 8
Project 9
Project 10 Project
1 1.00 3.00 1.00 0.33 0.33 7.00 0.33 5.00 3.00 5.00 0.10
Project
2 0.33 1.00 0.33 0.20 0.20 5.00 0.20 3.00 1.00 3.00 0.05
Project
3 1.00 3.00 1.00 0.33 0.33 7.00 0.33 5.00 3.00 5.00 0.10
Project
4 3.00 5.00 3.00 1.00 1.00 9.00 1.00 7.00 5.00 7.00 0.21
Project
5 3.00 5.00 3.00 1.00 1.00 9.00 1.00 7.00 5.00 7.00 0.21
Project
6 0.14 0.20 0.14 0.11 0.11 1.00 0.11 0.33 0.20 0.33 0.01
Project
7 3.00 5.00 3.00 1.00 1.00 9.00 1.00 7.00 5.00 7.00 0.21
Project
8 0.20 0.33 0.20 0.14 0.14 3.00 0.14 1.00 0.33 1.00 0.02
Project
9 0.33 1.00 0.33 0.20 0.20 5.00 0.20 3.00 1.00 3.00 0.05
Project
10 0.20 0.33 0.20 0.14 0.14 3.00 0.14 1.00 0.33 1.00 0.02
Normalized Weight
i
j
Pairwise Comparison Matrix
Productivity Improvement
Figure 5: Pairwise Comparison Matrix and Normalized Relative Weights for Projects vis-à-vis Productivity Improvement
Relative Parameter
Value
Relative Parameter
Weight
Relative Parameter
Value
Relative Parameter
Weight Project
1 $ 28,500.00 0.01 0.02 0.75 0.10 0.25 3.33 $ 28,500.00 Project
2 $ 237,000.00 0.11 0.01 0.75 0.05 0.25 0.21 $ 265,500.00 Project
3 $ 304,500.00 0.14 0.21 0.75 0.10 0.25 1.31 $ 570,000.00 Project
4 $ 173,500.00 0.08 0.10 0.75 0.21 0.25 1.61 $ 743,500.00 Project
5 $ 283,000.00 0.13 0.21 0.75 0.21 0.25 1.62 $ 1,026,500.00 Project
6 $ 680,000.00 0.31 0.05 0.75 0.01 0.25 0.13 $ 1,706,500.00 Project
7 $ 68,000.00 0.03 0.21 0.75 0.21 0.25 6.76 $ 1,774,500.00 Project
8 $ 108,500.00 0.05 0.10 0.75 0.02 0.25 1.64 $ 1,883,000.00 Project
9 $ 200,000.00 0.09 0.05 0.75 0.05 0.25 0.53 $ 2,083,000.00 Project
10 $ 87,000.00 0.04 0.02 0.75 0.02 0.25 0.61 $ 2,170,000.00 Project
Name
Return
RARROI
Cumulative Investment Investment
80% Confidence
Estimated Cost of Ownership
Customer Satisfaction Productivity Improvement
Relative Weight
Figure 6: Project RARROI Calculations
Relative Parameter
Value
Relative Parameter
Weight
Relative Parameter
Value
Relative Parameter
Weight Project
7 $ 68,000.00 0.03 0.21 0.75 0.21 0.25 6.76 $ 68,000.00 Project
1 $ 28,500.00 0.01 0.02 0.75 0.10 0.25 3.33 $ 96,500.00 Project
8 $ 108,500.00 0.05 0.10 0.75 0.02 0.25 1.64 $ 205,000.00 Project
5 $ 283,000.00 0.13 0.21 0.75 0.21 0.25 1.62 $ 488,000.00 Project
4 $ 173,500.00 0.08 0.10 0.75 0.21 0.25 1.61 $ 661,500.00 Project
3 $ 304,500.00 0.14 0.21 0.75 0.10 0.25 1.31 $ 966,000.00 Project
10 $ 87,000.00 0.04 0.02 0.75 0.02 0.25 0.61 $ 1,053,000.00 Project
9 $ 200,000.00 0.09 0.05 0.75 0.05 0.25 0.53 $ 1,253,000.00 Project
2 $ 237,000.00 0.11 0.01 0.75 0.05 0.25 0.21 $ 1,490,000.00 Project
6 $ 680,000.00 0.31 0.05 0.75 0.01 0.25 0.13 $ 2,170,000.00 Project
Name
Return
RARROI
Cumulative Investment Investment
80% Confidence
Estimated Cost of Ownership
Customer Satisfaction Productivity Improvement
Relative Weight
Figure 7: Projects Ranked by Descending RARROI with Budget Cut Line at $1,000,000
4.
S
UMMARY ANDC
ONCLUSIONSoftware Information Technology (IT) project portfolio management can be viewed as consisting of two key ele-ments: portfolio planning and portfolio monitoring and control.
Time-tested software project estimation methods and tools are therefore an essential part of effective portfolio plan-ning as they represent the best practices for estimating a project's estimated relative return and it’s estimated risk-adjusted investment. These estimated values yield a pro-ject’s Risk-Adjusted Relative Return on Investment (RARROI) which, in turn, can be used as the basis for rank-ordering and ultimately selecting the projects to be funded.
A key byproduct of the investment (cost of ownership) estimation process is a baseline plan, which can be used as an input to the portfolio monitoring and control process. Additionally, RARROI can be used in the portfolio moni-toring and control process as part of the basis for setting task priorities in a pre-emptive priority-based scheduling and resource allocation scheme.
Portfolio management is a promising concept that needs measurement to be practical. You can’t control [manage] what you can’t [don’t] measure [1]. This paper provides a reasonably simple calculation based on existing methods and tools that can serve as a foundation for applying measure-ment to portfolio planning and therefore help bring portfo-lio management into the realm of objective (i.e., fact-based) decision making.
R
EFERENCES[1] Chen, Y.W., “Implementing an Analytical Hierarchy Process by Fuzzy Integral,” International Journal of Fuzzy Systems, Vol. 3, No. 3, pp. 493-502, 2001. [2] Demarco, T., Controlling Software Projects:
Man-agement, Measurement, and Estimation. Yourdon Press, New York, NY, 1982.
[3] Saaty, T.L., “A Scaling Method for Priorities in Hier-archical Structures,” Journal of Mathematical Psy-chology, Vol. 15, No. 3, pp.234-281, 1977.
[4] Saaty, T.L., The Analytic Hierarchy Process: Plan-ning, Priority Setting, Resource Allocation, McGraw-Hill, New York, NY, 1980.
B
IOGRAPHYMike Ross has over 30 years of experience in software engineering as a developer, manager, process champion, consultant, instruc-tor, and award-winning international speaker. Mr. Ross is currently the President and CEO of r2Estimating, LLC. Mr. Ross’s previous experience includes three years as Chief Engineer of Galorath Inc. (makers of the SEER suite of estimation tools), seven years with Quantitative Software Manage-ment, Inc. (makers of the SLIM suite of software estimating tools) where he was Vice President of Education Services, and 17 years with Honeywell Air Transport Systems (for-merly Sperry Flight Systems) and 2 years with Tracor Aero-space where he developed or managed the development of embedded software for avionics systems installed various commercial airplanes and for expendable countermeasures systems installed in various military aircraft. He also
co-sessor. Mr. Ross did his undergraduate work at the United States Air Force Academy and Arizona State University, receiving a Bachelor of Science in Computer Engineering.