R E S E A R C H
Open Access
“
Can do, don
’
t do
”
are not the lazy ones: a
longitudinal study on physical functioning
in patients with COPD
Noriane A. Sievi
1, Thomas Brack
2, Martin H. Brutsche
3, Martin Frey
4, Sarosh Irani
5, Jörg D. Leuppi
6,
Robert Thurnheer
7, Malcolm Kohler
1,8and Christian F. Clarenbach
1*Abstract
Background and objective:Reduced physical capacity (PC) and physical activity (PA) are common in COPD patients and associated with poor outcome. However, they represent different aspects of physical functioning and interventions do not affect them in the same manner. To address this, a new PC-PA quadrant concept was recently generated to identify clinical characteristics of sub-groups of physical functioning. The objective of this study was to I) proof the new concept and to verify their differentiating clinical characteristics, II) evaluate the consistency of the concept over time, III) assess whether patients changed their quadrant affiliation over time, IV) and to test if changes in quadrant affiliations are associated with changes in clinical characteristics.
Methods:In a longitudinal, prospective, non-interventional cohort with mild to very severe COPD patients, PC and PA as well as respiratory variables, COPD-specific health status, comorbidities, survival, and exacerbations were yearly assessed.
Results:Data from 283 patients were analysed at baseline. Mean (min/max) follow-up time was 2.4 (0.5/6.8) years. The PC-PA quadrants could be characterized as follows: I)“can’t do, don’t do”: most severe and symptomatic, several comorbidities II)“can do, don’t do”: severe but less symptomatic, several comorbidities III)“can’t do, do do”: few patients, severe and symptomatic, less comorbidities IV)“can do, do do”: mildest and less symptomatic, less comorbidities, lowest exacerbation frequency. Of the 172 patients with at least one follow-up, 58% patients never changed their quadrant affiliation, while 17% declined either PC, PA or both, 11% improved their PC, PA or both, and 14% showed improvement and decline in PC, PA or both during study period. None of the clinical
characteristics or their annual changes showed consistent significant and relevant differences between all individual sub-groups.
Conclusion:Our findings suggest that there are no clinical characteristics allowing to distinguish between the PC-PA quadrants and the concept seems not able to illustrate disease process. However, the already low PC-PA but preserved PC in the“can do, don’t do”quadrant raises the question if regularly assessment of PA in clinical practice would be more sensitive to detect progressive deterioration of COPD compared to the commonly used PC. Clinical trial registration:www.ClinicalTrials.gov, NCT01527773.
Keywords:COPD, Physical activity, Exercise capacity, Longitudinal analysis
© The Author(s). 2020Open AccessThis article is distributed under the terms of the Creative Commons Attribution 4.0 International License (http://creativecommons.org/licenses/by/4.0/), which permits unrestricted use, distribution, and reproduction in any medium, provided you give appropriate credit to the original author(s) and the source, provide a link to the Creative Commons license, and indicate if changes were made. The Creative Commons Public Domain Dedication waiver (http://creativecommons.org/publicdomain/zero/1.0/) applies to the data made available in this article, unless otherwise stated. * Correspondence:[email protected]
1Pulmonary Division, University Hospital Zurich, Raemistrasse 100, 8091
Zurich, Switzerland
Introduction
Chronic obstructive pulmonary disease (COPD) is fre-quently accompanied by impaired physical capacity (PC) and reduced daily physical activity (PA), both arising in early disease stages [1]. Moreover, COPD patients are less physically active than patients with other chronic diseases, such as diabetes and rheumatoid arthritis [2]. Both, reduced ability to perform PA and PC, are known to be associated with a poor outcome (impaired health status, increased healthcare utilization) and are strong predictors for all-cause mortality in COPD [3, 4]. PC and PA represent two different aspects of physical func-tioning. While PC represents the ability to perform ac-tivity (a set of attributes), PA represents what people really do during their daily routine (a complex behav-iour) [5]. A recent longitudinal assessment of the courses of PC and PA in COPD patients showed that PC remained stable despite a substantial annual decrease in PA [6]. This finding leads to our hypothesis, that the longitudinal decline in PA cannot be explained by a con-comitant reduction in exercise tolerance. Furthermore, pulmonary rehabilitation shows a positive impact on PC [7] but incongruent findings on PA improvement [8], suggesting that an improvement in PC does not consist-ently lead to an increase in PA. Further interventions such as PA counselling or long-term oxygen therapy showed variable effects on PA enhancement [9], but studies comparing the effects of these interventions on PC and PA are missing. This implies that interventions may have to be individually tailored according to pa-tients’impairments in PC or PA, or both. According to this new approach, Koolen et al. [10] recently developed a PC-PA quadrant concept with PC (“can do”) and PA (“do do”) plotted against axes. This PC-PA quadrant concept identifies sub-groups of physical functioning and comparison of different clinical characteristics may provide an explanation for the discrepancies between PA and PC in individual COPD patients.
To address the request of the authors to proof their newly introduced PC-PA quadrant concept in another het-erogeneous COPD cohort [10], we performed the analysis accordingly and verified their findings regarding differences in clinical characteristics in our cohort. Furthermore, add-itional characteristics were compared among the quadrants. Due to our longitudinal study design, we assessed I) the consistency of the concept over time, II) whether patients changed their quadrant affiliation over time, III) and if changes in quadrant affiliations are associated with changes in clinical characteristics.
Methods Subjects
In the prospective, non-interventional cohort project
“The Obstructive Pulmonary Disease Outcomes Cohort
Study (TOPDOCS)” patients with already diagnosed mild to very severe COPD from seven pulmonary out-patient clinics in Switzerland were included. Study period was from October 2010 to December 2017 and took place during outpatient visits or hospital stays. Pa-tients were scheduled for initially three annual study visits (some patients extended their participation up to seven study visits). This analysis included data from 283 COPD patients out of the TOPDOCS cohort. Patients aged between 40 and 75 years at inclusion with con-firmed COPD according to Global Initiative for Chronic Obstructive Lung Disease (GOLD)-guidelines [11] were assessed for eligibility. Patients were excluded if they suf-fered from mental or physical disability precluding in-formed consent or compliance with the protocol. In case of a COPD exacerbation, patients were included into the study or called up for follow-up visits with a delay of at least 6 weeks.
The study was conducted in accordance with the dec-laration of Helsinki and all subjects gave written in-formed consent to participate. The Ethics Committee of the Canton of Zurich approved the study (EK-ZH-NR: 1734 and 2011–0106) and the study is registered at
www.ClinicalTrials.gov, NCT01527773.
Measurements
Physical capacity
The 6-min walking distance (6MWD) was annually assessed according to the American Thoracic Society (ATS) guidelines [12]. The 6-min walking test (6MWT) was performed on a 75 m indoor track, and patients were told to walk as far as possible within six minutes. Oxygen supplementation was allowed if required. At start and end of the test, peripheral oxygen saturation was measured by oximeter (PC-60C Fingertip Oximeter, Shanghai International Trading Corp. GmbH, Hamburg, Germany). Percentage of predicted values of 6MWD was calculated by reference equation of Enright et al. [13] The minimal important difference (MID) for 6MWD in COPD patients is estimated as 25 m [14].
Physical activity
PC-PA quadrant concept
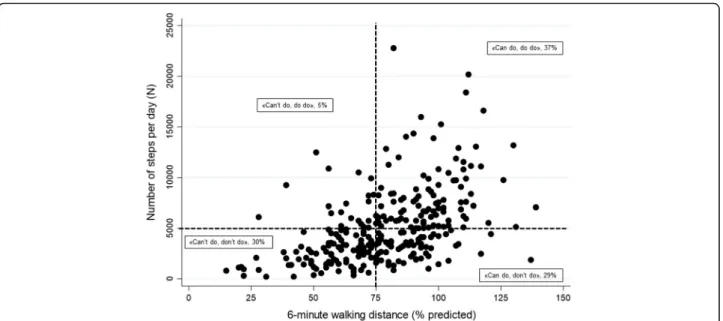
As described in the manuscript by Koolen and col-leagues [10], the PC-PA quadrants were plotted as fol-lows:“can’t do, don’t do”quadrant with low PC (6MWD < 70% pred.) and low PA (number of steps per day < 5000 steps); “can do, don’t do” quadrant with preserved PC (6MWD ≥70% pred.) but low PA (number of steps per day < 5000 steps); “can’t do, do do” quadrant with low PC (6MWD < 70% pred.) but preserved PA (number of steps per day≥5000 steps); “can do, do do” quadrant with preserved PC (6MWD ≥70% pred.) and preserved PA (number of steps per day≥5000 steps).
To assess the longitudinal course of the PC-PA quad-rant concept, patients were categorized into four “ chan-ging groups”according to their quadrant affiliations over time. COPD patients who never changed their PC-PA quadrant during study period were categorized as
“remainer”,“decliner” were patients who decreased their physical functioning (decline in 6MWD < 70% pred. and/or number of steps per day < 5000 steps) at least once, “improver” increased their physical functioning over time (increase in 6MWD ≥70% pred. and/or num-ber of steps per day > 5000 steps) at least once, and
“waverer”included patients who increased and decreased their physical functioning over time (increase and/or de-crease in 6MWD and/or inde-crease and/or dede-crease in steps per day) at least once.
Respiratory variables
Standard pulmonary functional testing was performed according to ATS/ERS guidelines [17, 18] to measure forced expiratory volume in one second (FEV1), residual
volume to total lung capacity (RV/TLC) ratio, and dif-fusing capacity of the lung for carbon monoxide (DLco). Only values after bronchodilation were reported. Disease severity was assessed by spirometric GOLD stages (stage 1–4) and COPD risk groups (risk score A-D) [19].
Blood gas analysis
Daytime arterial blood gas analysis was performed to as-sess partial pressure of oxygen (PaO2), of carbon dioxide
(PaCO2) and oxygen saturation (SaO2) after 5 min of rest
(ABL 700 series blood gas analyzer, Radiometer, Copenhagen). Measurement was performed native, ex-cept few patients with consistent oxygen supplementa-tion during blood gas analysis over all study visits.
COPD-specific health status
Severity of dyspnea was assessed by modified medical re-search council (mMRC) scale [20], for which an MID is not available due to its poor evaluative properties to de-tect changes in dyspnea [21]. COPD Assessment Test (CAT) was performed to measure the impact of COPD
symptoms on health status [22] with an estimated MID of 2 points [23].
To assess states of anxiety and depression, the self-administered Hospital Anxiety and Depression Scale (HADS) was used. The questionnaire is composed of two 7-item sub-scales (A for anxiety and HADS-D for depression), sub-scores ranging from 0 to 21 with higher scores indicating more severe distress. A score of 0 to 7 is suggested to be non-cases, 8 to 10 as possible cases, and > 10 as probable cases of clinical anxiety or depression, respectively [24]. A change of 1.5 points is suggested to be the MID [25].
Comorbidities and survival
Comorbidities were annually assessed by review of the documented medical history, conducting clinical inter-views and clinical examinations. To classify comorbidi-ties, the International Classification of Diseases-Tenth Revision [26] was used. The number of comorbidities was calculated by sum up the various diseases.
Last update in April 2019 was used to evaluate pa-tients who died within or after the study period and to assess survival time. Survival time was defined as time from baseline visit to death or April 2019 in patients who stayed alive. In patients who were lost of follow-up, survival time was not calculated.
Exacerbation history
An acute exacerbation (AE) was defined as an increase in patient’s dyspnea, cough and/or sputum with pre-scription of antibiotics and/or corticosteroids. Severe ex-acerbation was determined as hospital admission due to AE. Annual acquisition of number of AEs during the preceding year was performed and patients were catego-rized into infrequent exacerbators (0–1 AE per year) and frequent exacerbators (≥2 AEs per year) [27]. To get the most accurate information on AE, patients reports were compared with documents from the general practitioner, pulmonologist and hospital.
Data analysis and statistics
All results are shown as mean values (standard deviation (SD)) or median (25%/75% quartiles) unless otherwise stated. Statistical analysis was performed with STATA 15.1 (StataCorp, Texas, USA).
analysis, median annual change in each patients’ clinical characteristics was calculated.
A two-sided p-value of < 0.05 was considered to be statistically significant.
Results
Study participants
Of the 326 patients who agreed to take part, 283 COPD patients (41% spirometric GOLD stage 1/2, 37% stage 3,
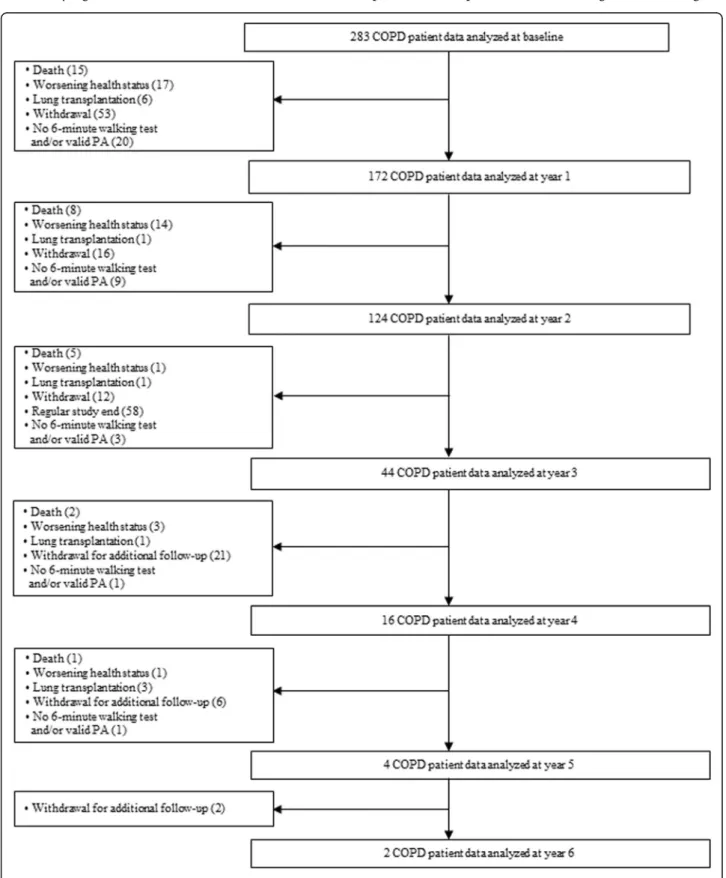
23% stage 4) completed baseline visit and were included in the analysis. Patients were asked to participate for at least three study visits, with some patients extended up to 7 study visits. During follow-up, 172 patients were analysed at year 1, 124 at year 2, 44 at year 3, 16 at year 4, 4 at year 5 and 2 at year 6, respectively (Fig.1). Rea-sons for missing follow-up visits were withdrawal, not able to participate anymore due to worsening health sta-tus, lung transplantation, and death. Mean (min/max) follow-up time was 2.4 (0.5/6.8) years with annual mea-surements (median (quartiles) time between two visits 1.08 (1.01/1.20)). Comparison between patients who re-ceived follow-up and patients who were lost for or failed follow-up showed no differences in baseline PC and PA. The median (quartiles) age was 63 (58/68) years, 65% were male and 24% of the COPD patients were current smokers. Mean (SD) PC was 79.4 (23.1)% of predicted 6MWD corresponding to 418 (125.7) meter. Median (quartiles) PA was 4421 (2522/6863) steps per day. De-tailed patient characteristics are presented in Table1.
PC-PA quadrants
At baseline, 30% (85 patients) were categorized into the
“can’t do, don’t do” quadrant, 29% (81 patients) into the
“can do, don’t do” quadrant, 5% (13 patients) into the
“can’t do, do do” and 37% (104 patients) into the “can do, do do”quadrant (Fig.2).
Differences in clinical characteristics in PC-PA quadrants
Comparison of the PC-PA quadrants revealed significant overall differences in various baseline values of clinical characteristics, such as lung function, CAT score and number of comorbidities (Table2). In year 1, the overall significant differences in clinical characteristics in the PC-PA quadrants partly changed compared to baseline (Additional file1: Table S1). None of the clinical charac-teristics showed significant and relevant differences be-tween all of the individual quadrants (Table 3). The PC-PA quadrants could be characterized as follows: I)“can’t do, don’t do” quadrant: most severe and symptomatic COPD patients, several comorbidities II) “can do, don’t do” quadrant: severe but less symptomatic COPD pa-tients, several comorbidities III) “can’t do, do do” quad-rant: few patients, severe and symptomatic, less comorbidities IV)“can do, do do”quadrant: mildest and less symptomatic patients, less comorbidities, lowest ex-acerbation frequency.
Median differences in CAT score between patients with low PC and patients with preserved PC are remark-ably above the MID of 2 points, despite lack of statistical significance. Lung function impairment increases from
“can do, do do”quadrant to“can do, don’t do”/“can’t do, do do”to “can’t do, don’t do” quadrant, with quite simi-lar values between“can’t do, do do” and “can do, don’t
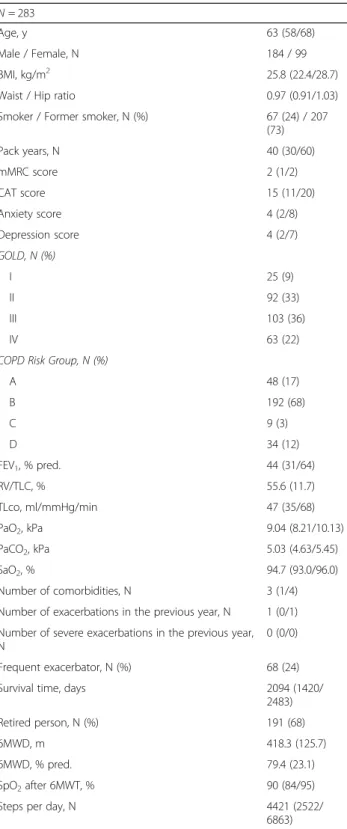
Table 1Baseline characteristics
N= 283
Age, y 63 (58/68)
Male / Female, N 184 / 99
BMI, kg/m2 25.8 (22.4/28.7)
Waist / Hip ratio 0.97 (0.91/1.03)
Smoker / Former smoker, N (%) 67 (24) / 207
(73)
Pack years, N 40 (30/60)
mMRC score 2 (1/2)
CAT score 15 (11/20)
Anxiety score 4 (2/8)
Depression score 4 (2/7)
GOLD, N (%)
I 25 (9)
II 92 (33)
III 103 (36)
IV 63 (22)
COPD Risk Group, N (%)
A 48 (17)
B 192 (68)
C 9 (3)
D 34 (12)
FEV1, % pred. 44 (31/64)
RV/TLC, % 55.6 (11.7)
TLco, ml/mmHg/min 47 (35/68)
PaO2, kPa 9.04 (8.21/10.13)
PaCO2, kPa 5.03 (4.63/5.45)
SaO2, % 94.7 (93.0/96.0)
Number of comorbidities, N 3 (1/4)
Number of exacerbations in the previous year, N 1 (0/1)
Number of severe exacerbations in the previous year, N
0 (0/0)
Frequent exacerbator, N (%) 68 (24)
Survival time, days 2094 (1420/
2483)
Retired person, N (%) 191 (68)
6MWD, m 418.3 (125.7)
6MWD, % pred. 79.4 (23.1)
SpO2after 6MWT, % 90 (84/95)
Steps per day, N 4421 (2522/
6863) BMIbody mass index,mMRCmodified medical research council,CATCOPD assessment test,FEV1forced expiratory volume in one second,RV/TLCresidual
do” quadrants. The median (95% CI) difference in 6MWD was above the MID with 35.2 (−13.2/83.7) me-ters in both groups with low PC, without statistical sig-nificance. In the two groups with preserved PC, patients in the“can do, don’t do”quadrant showed a relevant but not significant median (95% CI) difference in 6MWD of
−41.7 (−67.8/−15.6). Differences in steps per day were rather small between low PA groups and between pre-served PA groups, respectively. (Table3).
Longitudinal properties of the PC-PA quadrant
After one year, the percentage of patients in the“can’t do, don’t do”quadrant declined from 30 to 19% while the num-ber of patients in the“can do, don’t do”quadrant increased from 29 to 44%. The amount of patients in the remaining two quadrants stayed quite stable (3 and 34%, respectively). Of the 172 patients with at least one follow-up visit, 100 (58%) patients never changed their quadrant affiliation dur-ing study period (remainer), while 29 patients (17%) wors-ened either PC, PA or both (decliner), 20 patients (11%) increased their PC, PA or both (improver), and 24 patients (14%) showed increase and decrease in PC, PA or both (waverer). Follow-up time was significantly longer in the waverer group with median (quartiles) of 3.1 (2.2/4.0) years compared to the remainer (2.1 (1.3/2.5) years) and decliner (2.0 (1.1/3.1) years) (p< 0.001 andp= 0.011, respectively).
Of the patients in the“can’t do, don’t do” quadrant at baseline, 51% remained in this quadrant while 24% were improver and 24% waverer. In the “can do, don’t do” quadrant, 63% were remainer, 7% decliner, 15% im-prover and waverer each. 40% of the “can’t do, do do” quadrant remained, while 20% were improver and 40%
waverer. The“can do, do do” quadrant at baseline yield 60% remainer, 35% decliner and 5% waverer.
Median yearly changes in most of the clinical characteris-tics were comparable among the PC-PA quadrants. The significant greater annual decline in number of steps per day in the“can’t do, do do”quadrant compared to the“can do, don’t do”quadrant did not show clinical relevance (me-dian (quartiles) difference of−449 (−2728/1284) steps per day) (p= 0.001). (Additional file1: Table S2).
Differences in clinical characteristics in“changing groups”
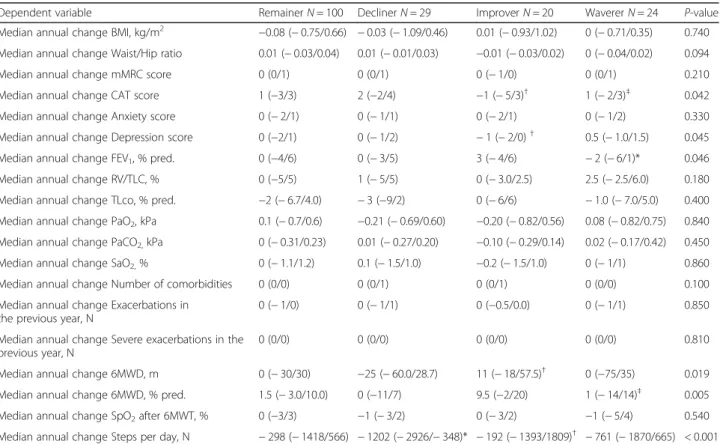
None of the clinical parameters at baseline yield mean-ingful differences between all of the four changing groups (Additional file1: Table S3). Improver showed a significantly higher CAT score (median (95% CI) differ-ence of 4.6 (1.3/7.9)) compared to remainer, and decliner showed a significantly higher RV/TLC (median (95% CI) difference of 7 (3/10)%) compared to remainer. 6MWD and number of steps per day was lowest in the improver group and highest in the decliner group. Furthermore, median annual changes in clinical characteristics did not differ relevantly between the changing groups despite a relevant median (quartiles) difference in yearly change in number of steps per day between decliners and improvers of−1120 (−1722/−557) steps (p< 0.001). (Table4).
Discussion
This analysis applyed a recently introduced concept, taking into account the differences in PC and PA for characterizing COPD patients, in our heterogeneous cohort with longitu-dinal assessments. Patients with low PC and PA presented the worst health status, followed by patients with low PC but preserved PA and patients with preserved PC but low PA.
Preserved PC and PA was found in patients with the mildest disease manifestations. Although 42% of the patients changed their quadrant affiliation over time, none of the observed clinical characteristics or their annual changes allowed to dis-tinguish between patients who maintained, improved or de-creased physical functioning over time.
Several studies demonstrated the deleterious impact of reduced PC and PA on various outcomes in patients with COPD [28–31]. Despite the effort to clarify the re-lation of physical functioning and progress of COPD, reasons for the divergent evolution between PC and PA remain unknown. Why the positive effect of
Table 2Comparison of clinical characteristics between quadrants at baseline
“Can’t do, don’t do”
N= 85 “
Can do, don’t do”
N= 81 “
Can’t do, do do”
N= 13 “
Can do, do do”
N= 104
Overall
p-value
Age, y 64 (60/69) 64 (58/67) 56 (53/60)*† 64 (58/68)‡ 0.007
Male, N (%) 63 (74) 51 (63) 7 (54) 63 (61) 0.180
BMI, kg/m2 24.9 (21.1/28.1) 26.6 (22.8/29.4) 24.0 (22.6/25.8) 26.7 (22.6/29.2) 0.110
Waist/Hip ratio 0.98 (0.90/1.05) 0.98 (0.93/1.02) 0.93 (0.90/1.02) 0.96 (0.89/1.01) 0.250
Smoker, N (%) 11 (13) 25 (31)* 2 (15) 29 (28)* 0.026
mMRC score 3 (2/3) 1 (1/2)* 2 (1/3) 1 (1/2)*†‡ < 0.001
CAT score 18 (14/23) 14 (10/18)* 19 (13/22) 13 (8/19)* < 0.001
Anxiety score 5 (3/8) 3 (2/6) 7 (5/9) 4.5 (2.0/8.0) 0.080
Depression score 6 (4/8) 4 (2/6)* 5 (2/8) 3.5 (1.0/6.0)* < 0.001
GOLD, N (%) < 0.001
I 2 (2) 6 (7) 0 (0) 17 (16)*
II 11 (13) 27 (33)* 6 (46)* 48 (46)*
III 35 (41) 36 (44) 3 (23) 29 (28)†
IV 37 (44) 12 (15)* 4 (31) 10 (10)*‡
COPD Risk Group, N (%) < 0.001
A 4 (5) 16 (20)* 1 (8) 27 (26)*
B 68 (80) 54 (67) 10 (77) 60 (58)*
C 1 (1) 0 (0) 0 (0) 8 (8)*†
D 12 (14) 11 (14) 2 (15) 9 (9)
FEV1, % pred. 31 (25/43) 45 (34/65)* 41 (29/56) 58 (40.5/75.0)*† < 0.001
RV/TLC, % 63 (57/68) 55 (45/65)* 55 (46/62) 52 (43/59)* < 0.001
TLco, % pred. 36 (28/45) 47 (36/64)* 43 (34/48) 63 (46/78)*†‡ < 0.001
PaO2, kPa 8.6 (7.6/9.5) 9.0 (8.4/10.1) 9.3 (8.5/9.6) 9.6 (8.8/10.5)* < 0.001
PaCO2, kPa 5.2 (4.7/5.7) 5.0 (4.5/5.3)* 5.0 (4.7/5.2) 4.9 (4.6/5.4) 0.047
SaO2, % 93.7 (91.2/95.3) 94.8 (93.3/96.0) 94.8 (94.5/96.0) 95.2 (93.7/96.5)* 0.007
Number of comorbidities, N 3 (2/5) 3 (2/5) 2 (1/2)*† 2 (1.0/3.5)*† < 0.001
Exacerbations in the previous year, N 1 (0/2) 0 (0/1) 1 (0/2) 0 (0/1)*‡ < 0.001
Severe exacerbations in the previous year, N 0 (0/1) 0 (0/0)* 0 (0/0) 0 (0/0)* 0.006
Frequent exacerbator, N (%) 28 (33) 20 (25) 6 (46) 14 (14)*‡ 0.004
Survival time, days (N= 214) 1550 (836/2268)a 2115 (1599/2394)b 2390 (1799/3019)c 2279 (1944/2839)d*† < 0.001
Retired person, N (%) 64 (76) 56 (70) 7 (54) 64 (62) 0.130
6MWD, m 300 (252/349) 450 (390/510)* 360 (300/375)† 495 (444/562)*‡ < 0.001
6MWD, % pred. 57 (47/65) 87 (77/95)* 61 (56/65)† 96 (95/107)*‡ < 0.001
SpO2after 6MWT, % 87 (81/92) 90 (85/93)* 91 (87/95) 92 (87/95)* < 0.001
Steps per day, N 2388 (1329/3357) 3284 (2113/3864) 6590 (6007/9258)*† 7553 (5876/9819)*† < 0.001
Values are median (25%/75% quartiles) unless otherwise stated. *p< 0.05 vs“can’t do, don’t do”;†p< 0.05 vs“can do, don’t do”;‡p< 0.005 vs“can’t do, do do”.
a
N= 69;bN= 62;cN= 8;dN= 75.BMIbody mass index,mMRCmodified medical research council,CATCOPD assessment test,FEV1forced expiratory volume in one second,RV/TLCresidual volume to total lung capacity ratio,TLcodiffusing capacity of the lung for carbon monoxide,PaO2partial pressure of oxygen,PaCO2
Table 3Differences in characteristics between individual quadrants at baseline
“Can’t do, don’t do” vs“Can do, don’t do”
“Can’t do, don’t do” vs“Can’t do, do do”
“Can’t do, don’t do” vs“Can do, do do”
“Can do, don’t do” vs“Can’t do, do do”
“Can do, don’t do” vs“Can do, do do”
“Can’t do, do do” vs“Can do, do do”
Age, y −1 (−3/2) −8 (−11/−4)* 1 (−3/1) −7 (−10/−4)* 0 (−2/2) 7 (3/10)*
mMRC score, N −1 (−1/−1)* 0 (−1/0) −1 (−2/−1)* 1 (0/1) 0 (−1/0)* −1 (−2/0)*
CAT score, N −4.3 (−6.1/−2.4)* −0.14 (−4.0/3.7) −4.6 (−6.7/−2.6)* 4.1 (0.6/7.6) −0.4 (−2.4/1.6) −4.5 (−8.9/−0.1)
Depression score, N −2 (−3/−1)* −1 (−3/2) −2 (−3/−1)* 1 (−1/4) 0 (−1/1) −1 (−4/1)
FEV1, % pred. 13 (8/18)* 7 (−2/20) 23 (17/30)* −5 (−15/5) 9 (3/16)* 15 (6/25)
RV/TLC, % −7 (−10.9/−4.0)* −7 (−14/0) −11 (−14/−8)* 0 (−7/7) −4 (−8/0) −4 (−11/3)
TLco, % pred. 11 (6/17)* 6 (−2/15) 25 (18/31)* −5 (−16/4) 12 (5/18)* 18.5 (8/28)*
Number of comorbidities, N
−1 (−1/0) −2 (−2/−1)* −1 (−2/−1)* −1 (−2/0)* −1 (−1/0)* 1 (0/1)
Exacerbations in the previous year, N
0 (−1/0) 0 (−1/1) −1 (−1/0)* 1 (0/2) 0 (0/0) −1 (−2/0)*
Severe exacerbations in the previous year, N
0 (0/0)* 0 (0/0) 0 (0/0)* 0 (0/0) 0 (0/0) 0 (0/0)
Survival time, days (N = 214)
332 (49/698) 884 (328/1358) 732 (386/1075)* 461 (−181/1069) 303 (62/568)* −84 (−701/467)
6MWD, m 169.0(182.8/195.2)* 35.2 (−13.2/83.7) 210.7 (185.5/236.0)* −133.8 (−184.4/ 83.2)*
41.7 (15.6/67.8) 175.5 (123.8/ 227.2)*
6MWD, % pred. 32 (28/36)* 2 (−3/8) 40 (36/44)* −29 (−36/−22)* 7 (3/12) 37 (31/44)*
SpO2after 6MWT, % 2 (0/5)* 4 (1/7) −4 (2/7)* 1 (−1/4) 2 (4/1) 1 (−2/3)
Steps per day, N 692 (263/1108) 4770 (3716/6145)* 5193 (4657/5822)* 3990 (2916/5641)* 4477 (3939/5130)* 349 (−627/1508)
Values are median (95% CI). *p-value < 0.05.mMRCmodified medical research council,CATCOPD assessment test,FEV1forced expiratory
volume in one second,RV/TLCresidual volume to total lung capacity ratio,TLcodiffusing capacity of the lung for carbon monoxide,6MWD 6-min walking distance,SaO2oxygen saturation
Table 4Comparison of median annual change in clinical characteristics between changing groups
Dependent variable RemainerN= 100 DeclinerN= 29 ImproverN= 20 WavererN= 24 P-value
Median annual change BMI, kg/m2 −0.08 (−0.75/0.66) −0.03 (−1.09/0.46) 0.01 (−0.93/1.02) 0 (−0.71/0.35) 0.740
Median annual change Waist/Hip ratio 0.01 (−0.03/0.04) 0.01 (−0.01/0.03) −0.01 (−0.03/0.02) 0 (−0.04/0.02) 0.094
Median annual change mMRC score 0 (0/1) 0 (0/1) 0 (−1/0) 0 (0/1) 0.210
Median annual change CAT score 1 (−3/3) 2 (−2/4) −1 (−5/3)† 1 (−2/3)‡ 0.042
Median annual change Anxiety score 0 (−2/1) 0 (−1/1) 0 (−2/1) 0 (−1/2) 0.330
Median annual change Depression score 0 (−2/1) 0 (−1/2) −1 (−2/0)† 0.5 (−1.0/1.5) 0.045
Median annual change FEV1, % pred. 0 (−4/6) 0 (−3/5) 3 (−4/6) −2 (−6/1)* 0.046
Median annual change RV/TLC, % 0 (−5/5) 1 (−5/5) 0 (−3.0/2.5) 2.5 (−2.5/6.0) 0.180
Median annual change TLco, % pred. −2 (−6.7/4.0) −3 (−9/2) 0 (−6/6) −1.0 (−7.0/5.0) 0.400
Median annual change PaO2, kPa 0.1 (−0.7/0.6) −0.21 (−0.69/0.60) −0.20 (−0.82/0.56) 0.08 (−0.82/0.75) 0.840
Median annual change PaCO2,kPa 0 (−0.31/0.23) 0.01 (−0.27/0.20) −0.10 (−0.29/0.14) 0.02 (−0.17/0.42) 0.450
Median annual change SaO2,% 0 (−1.1/1.2) 0.1 (−1.5/1.0) −0.2 (−1.5/1.0) 0 (−1/1) 0.860
Median annual change Number of comorbidities 0 (0/0) 0 (0/1) 0 (0/1) 0 (0/0) 0.100
Median annual change Exacerbations in the previous year, N
0 (−1/0) 0 (−1/1) 0 (−0.5/0.0) 0 (−1/1) 0.850
Median annual change Severe exacerbations in the previous year, N
0 (0/0) 0 (0/0) 0 (0/0) 0 (0/0) 0.810
Median annual change 6MWD, m 0 (−30/30) −25 (−60.0/28.7) 11 (−18/57.5)† 0 (−75/35) 0.019
Median annual change 6MWD, % pred. 1.5 (−3.0/10.0) 0 (−11/7) 9.5 (−2/20) 1 (−14/14)‡ 0.005
Median annual change SpO2after 6MWT, % 0 (−3/3) −1 (−3/2) 0 (−3/2) −1 (−5/4) 0.540
Median annual change Steps per day, N −298 (−1418/566) −1202 (−2926/−348)* −192 (−1393/1809)† −761 (−1870/665) < 0.001
enhancements in PC, e.g. with pulmonary rehabilita-tions, cannot always be transferred into enhanced PA is a matter of current debate and research [32]. Further-more, it remains to be defined if PA modifying interven-tions, such as PA counselling, also enhances PC for long term. A previous study by our team revealed that the significant decrease in daily PA over time is not accom-panied by a decrease in PC [6]. Consistent with these findings, Koolen et al. [10] developed a new concept in which PC and PA were divided into decreased and pre-served. This PC-PA quadrant should enable the identifi-cation of physical functioning sub-groups with different clinical characteristics and might be useful in optimizing personalized medicine in COPD patients. Following the call to prove the new PC-PA quadrant concept, we ap-plied the concept to our COPD cohort and investigated if the PC-PA quadrant is applicable for dynamic changes, assessed by longitudinal observations. Compar-able to Koolen and colleagues [10], patients in the“can’t do, don’t do” quadrant showed the highest disease bur-den and patients in the “can do, do do” quadrant the mildest COPD. However, none of the assessed clinical characteristics allowed to distinguish between all of the individual quadrants. Several of the differentiating char-acteristics found by Koolen et al. [10], such as BMI and sex, could not be confirmed by our study. Moreover, some of the distinguishing characteristics found to be significant in the baseline assessment were not main-tained significant in the following year. The largest mis-match was found in the “can do, don’t do” patients. Koolen et al. [10] reported the smallest prevalence in these patients and described them as “lazy”, with the highest BMI and low exacerbation history. Our data sug-gested that these patients show a comparable severity of COPD with the “can’t do, do do” patients, but with slightly lower symptoms and a higher PC. We thus hypothesize that the already severe respiratory impair-ment did not translate into a low PC yet, but will lead to an impairment in PC with a delay in time. This finding could also deliver an explanation why the annual de-crease in PA is not accompanied by a dede-crease in PC [6], leading to the assumption that PC may decrease with delay while PA impairment goes in line with disease worsening. To address this, longitudinal studies are needed in which early disease stages are monitored and the onset of PA impairment will be compared with the onset of PC impairment. Furthermore, this raises the question if regular assessment of PA in clinical practice would be more sensitive to detect progressive deterior-ation of COPD compared to the commonly used PC. The PC-PA quadrant concept was not able to project the dynamic course of the disease. Almost half of the pa-tients changed their PC-PA quadrant over time but changes in quadrant affiliation were not connected to
clinical characteristics or their annual changes. We therefore assume that detailed characterization of the four PC-PA quadrants would not be adequate. However, further studies are needed to confirm whether patients in the “can do, don’t do” quadrant show severe disease burden and if these patients would be more responsive for PA enhancement after pulmonary rehabilitations.
The current study has some limitations. Patients with pulmonary rehabilitation within 3 months prior to the baseline evaluation were not included at this time point. However, we cannot exclude that a small number of se-vere patients underwent pulmonary rehabilitation during the study period, potentially increased the group of wa-verers. Furthermore, the number of patients in the“can’t do, do do” quadrant is quite small but seems to repre-sent the real-world distribution of COPD patients.
Conclusion
In conclusion, we found no clinical characteristics to dis-tinguish significantly and clinically meaningful between the PC-PA quadrants. Furthermore, the PC-PA quadrant concept seems not to be able to reflect disease process in COPD patients with a follow-up up to six years. How-ever, the already low PA and preserved PC in the “can do, don’t do”quadrant raises the question if regularly as-sessment of PA in clinical practice would be more sensi-tive to detect progressive deterioration of COPD compared to the commonly used PC.
Supplementary information
Supplementary informationaccompanies this paper athttps://doi.org/10. 1186/s12931-020-1290-9.
Additional file 1: Table S1.Comparison of clinical characteristics between quadrants at year 1.Table S2.Comparison of change in clinical characteristics between quadrants.Table S3.Comparison of clinical characteristics at baseline between changing groups.
Abbreviations
6MWD:6-min walking distance; 6MWT: 6-min walking test; AE: Acute exacerbation; ATS: American thoracic society; BMI: Body mass index; CAT: COPD Assessment Test; CI: Confidence interval; COPD: Chronic obstructive pulmonary disease; FEV1: Forced expiratory volume in 1 s;
FVC: Forced vital capacity; GOLD: Global initiative for chronic obstructive lung disease; HADS: Hospital Anxiety and Depression Scale; MID: Minimal important difference; mMRC: Modified medical research council; PA: Physical activity; PaCO2: Partial pressure of carbon dioxide; PaO2: Partial pressure of oxygen; PC: Physical capacity; SaO2: Oxygen saturation; TOPDOCS: The obstructive pulmonary disease outcomes cohort of Switzerland
Authors’contributions
Design of the study: NAS, MK, CFC, acquisition of data: NAS, MK, RT, JDL, SI, MF, MB, TB, CFC, data analysis and interpretation: NAS, MK, CFC, manuscript draft and revision for intellectual content and approved the final version: NAS, MK, RT, JDL, SI, MF, MB, TB, CFC. All authors read and approved the final Manuscript.
Funding
Gesellschaft Basel, Lung league of Canton Thurgau, Lung league of Canton St. Gallen, Lung league of Canton Aargau and Lung league of Canton Glarus.
Availability of data and materials
The datasets used and analysed during the current study are available from the corresponding author on reasonable request.
Ethics approval and consent to participate
The study was conducted in accordance with the declaration of Helsinki and all subjects gave written informed consent to participate. The Ethics Committee of the Canton of Zurich approved the study (EK-ZH-NR: 1734 and 2011–0106) and the study is registered atwww.ClinicalTrials.gov,
NCT01527773.
Consent for publication
Not applicable.
Competing interests
The authors declare that they have no competing interests.
Author details
1
Pulmonary Division, University Hospital Zurich, Raemistrasse 100, 8091 Zurich, Switzerland.2Pulmonary Division, Cantonal Hospital of Glarus, Glarus, Switzerland.3Pulmonary Division, Cantonal Hospital of St. Gallen, St. Gallen, Switzerland.4Pulmonary Division, Clinic Barmelweid, Erlinsbach, Switzerland. 5
Pulmonary Division, Cantonal Hospital of Aarau, Aarau, Switzerland. 6University Department of Medicine, Cantonal Hospital Baselland and
University of Basel, Basel, Switzerland.7Pulmonary Division, Cantonal Hospital of Münsterlingen, Münsterlingen, Switzerland.8Zurich Centre for Integrative Human Physiology, University of Zurich, Zurich, Switzerland.
Received: 12 November 2019 Accepted: 8 January 2020
References
1. Watz H, Waschki B, Meyer T, Magnussen H. Physical activity in patients with COPD. Eur Respir J. 2009;33(2):262–72.
2. Arne M, Janson C, Janson S, Boman G, Lindqvist U, Berne C, et al. Physical activity and quality of life in subjects with chronic disease: chronic obstructive pulmonary disease compared with rheumatoid arthritis and diabetes mellitus. Scand J Prim Health Care. 2009;27(3):141–7. 3. Waschki B, Kirsten A, Holz O, Muller KC, Meyer T, Watz H, et al. Physical
activity is the strongest predictor of all-cause mortality in patients with COPD: a prospective cohort study. Chest. 2011;140(2):331–42. 4. Puhan MA, Siebeling L, Zoller M, Muggensturm P, ter Riet G. Simple
functional performance tests and mortality in COPD. Eur Respir J. 2013;42(4): 956–63.
5. Caspersen CJ, Powell KE, Christenson GM. Physical activity, exercise, and physical fitness: definitions and distinctions for health-related research. Public Health Rep. 1985;100(2):126–31.
6. Sievi NA, Brack T, Brutsche MH, Frey M, Irani S, Leuppi JD, et al. Physical activity declines in COPD while exercise capacity remains stable: a longitudinal study over 5 years. Respir Med. 2018;141:1–6.
7. McCarthy B, Casey D, Devane D, Murphy K, Murphy E, Lacasse Y. Pulmonary rehabilitation for chronic obstructive pulmonary disease. Cochrane Database Syst Rev. 2015;(2):Cd003793.https://doi.org/10.1002/14651858.CD003793. pub3.
8. Spruit MA, Pitta F, McAuley E, ZuWallack RL, Nici L. Pulmonary rehabilitation and physical activity in patients with chronic obstructive pulmonary disease. Am J Respir Crit Care Med. 2015;192(8):924–33.
9. Mantoani LC, Rubio N, McKinstry B, MacNee W, Rabinovich RA. Interventions to modify physical activity in patients with COPD: a systematic review. Eur Respir J. 2016;48(1):69–81.
10. Koolen EH, van Hees HW, van Lummel RC, Dekhuijzen R, Djamin RS, Spruit MA, et al. "Can do" versus "do do": A Novel Concept to Better Understand Physical Functioning in Patients with Chronic Obstructive Pulmonary Disease. J Clin Med. 2019;8(3):340.
11. Rabe KF, Hurd S, Anzueto A, Barnes PJ, Buist SA, Calverley P, et al. Global strategy for the diagnosis, management, and prevention of chronic obstructive pulmonary disease - GOLD executive summary. Am J Respir Crit Care Med. 2007;176(6):532–55.
12. Brooks D, Solway S, Gibbons WJ. ATS statement on six-minute walk test. AmJRespirCrit Care Med. 2003;167(9):1287.
13. Enright PL, Sherrill DL. Reference equations for the six-minute walk in healthy adults. Am J Respir Crit Care Med. 1998;158(5 Pt 1):1384–7. 14. Holland AE, Hill CJ, Rasekaba T, Lee A, Naughton MT, McDonald CF.
Updating the minimal important difference for six-minute walk distance in patients with chronic obstructive pulmonary disease. Arch Phys Med Rehabil. 2010;91(2):221–5.
15. Van Remoortel H, Raste Y, Louvaris Z, Giavedoni S, Burtin C, Langer D, et al. Validity of six activity monitors in chronic obstructive pulmonary disease: a comparison with indirect calorimetry. PLoS One. 2012;7(6):e39198. 16. Demeyer H, Burtin C, Hornikx M, Camillo CA, Van Remoortel H, Langer D,
et al. The minimal important difference in physical activity in patients with COPD. PLoS One. 2016;11(4):e0154587.
17. Miller MR, Hankinson J, Brusasco V, Burgos F, Casaburi R, Coates A, et al. Standardisation of spirometry. Eur Respir J. 2005;26(2):319–38.
18. Macintyre N, Crapo RO, Viegi G, Johnson DC, van der Grinten CP, Brusasco V, et al. Standardisation of the single-breath determination of carbon monoxide uptake in the lung. Eur Respir J. 2005;26(4):720–35.
19. Global Initiative for Chronic Obstructive Lung Disease: Global Strategy for the Diagnosis, Management, and Prevention of Chronic Obstructive Disease. https://goldcopd.org/global-strategy-diagnosis-management-prevention-copd-2016. Accessed 12 Nov 2019. 2016.
20. Mahler DA, Wells CK. Evaluation of clinical methods for rating dyspnea. Chest. 1988;93(3):580–6.
21. Mahler DA, Weinberg DH, Wells CK, Feinstein AR. The measurement of dyspnea. Contents, interobserver agreement, and physiologic correlates of two new clinical indexes. Chest. 1984;85(6):751–8.
22. Jones PW, Harding G, Berry P, Wiklund I, Chen WH, Kline LN. Development and first validation of the COPD assessment test. Eur Respir J. 2009;34(3): 648–54.
23. Kon SS, Canavan JL, Jones SE, Nolan CM, Clark AL, Dickson MJ, et al. Minimum clinically important difference for the COPD assessment test: a prospective analysis. Lancet Respir Med. 2014;2(3):195–203.
24. Zigmond AS, Snaith RP. The hospital anxiety and depression scale. Acta Psychiatr Scand. 1983;67(6):361–70.
25. Puhan MA, Frey M, Buchi S, Schunemann HJ. The minimal important difference of the hospital anxiety and depression scale in patients with chronic obstructive pulmonary disease. Health Qual Life Outcomes. 2008;6:46. 26. WHO. International Classification of Diseases (ICD). 2013.http://www.who.
int/classifications/icd/en. Accessed 12 Nov 2019 2013 [.
27. Hurst JR, Vestbo J, Anzueto A, Locantore N, Mullerova H, Tal-Singer R, et al. Susceptibility to exacerbation in chronic obstructive pulmonary disease. NEnglJMed. 2010;363(12):1128–38.
28. Esteban C, Quintana JM, Aburto M, Moraza J, Egurrola M, Perez-Izquierdo J, et al. Impact of changes in physical activity on health-related quality of life among patients with COPD. Eur Respir J. 2010;36(2):292–300.
29. Vaes AW, Garcia-Aymerich J, Marott JL, Benet M, Groenen MT, Schnohr P, et al. Changes in physical activity and all-cause mortality in COPD. Eur Respir J. 2014;44(5):1199–209.
30. Esteban C, Arostegui I, Aburto M, Moraza J, Quintana JM, Aizpiri S, et al. Influence of changes in physical activity on frequency of hospitalization in chronic obstructive pulmonary disease. Respirology. 2014;19(3):330–8. 31. Singh SJ, Puhan MA, Andrianopoulos V, Hernandes NA, Mitchell KE, Hill CJ,
et al. An official systematic review of the European Respiratory Society/ American Thoracic Society: measurement properties of field walking tests in chronic respiratory disease. Eur Respir J. 2014;44(6):1447–78.
32. Spruit MA, Singh SJ, Garvey C, ZuWallack R, Nici L, Rochester C, et al. An official American Thoracic Society/European Respiratory Society statement: key concepts and advances in pulmonary rehabilitation. Am J Respir Crit Care Med. 2013;188(8):e13–64.
Publisher’s Note