Supporting Information
Loss of specific active-site ir on atoms in oxygen-exposed [FeFe]-hydrogenase determined by detailed X-ray structure analyses
Julian Esselborna†, Leonie Kertessa, Ulf-Peter Apfelb,c, Eckhard Hofmannd, Thomas Happea
Fakultät für Biologie und Biotechnologie, Photobiotechnologiea, Ruhr Universität Bochum, Universitätsstraße 150,
44801 Bochum, Germany; Fakultät für Chemie und Biochemie, Lehrstuhl für Anorganische Chemie
I-Bioanorganische Chemie b, Ruhr Universität Bochum, Universitätsstraße 150, 44801 Bochum, Germany; Fraunhofer
UMSICHTc, 46047 Oberhausen, Germany; Fakultät für Biologie und Biotechnologie, Protein Crystallographyd, Ruhr
Universität Bochum, Universitätsstraße 150, 44801 Bochum, Germany;
Material and Methods
Protein expression and purification
ApoCpI was overexpressed in E. coli BL21(DE3) ΔiscR under aenaerobic conditions, anaerobically purified with 2mM NaDT in all buffers by strep-tagII affinity chromatography as described earlier1,2, and purity was assessed by SDS-PAGE. In vitro maturation of apoCpI to CpIADT with
(Fe2[µ-(SCH2)2NH](CN)2(CO)42-) ([2Fe]-mimic) in 100 mM K2HPO4/KH2PO4 (pH 6.8) for 90 min at
RT was achieved as reported3 with subsequent removal of unreacted [2Fe]-mimic and NaDT
using a desalting column. Proteins were concentrated using Amicon Ultra centrifugal filters (30 kDa MWCO) under anaerobic conditions. Success of maturation and quality of purified protein samples of CpIADT were determined by testing their H
2 production activity in vitro with
methylviologen as electron donor using an established method4.
Activity tests after O2 exposure
In a similar set-up as used for crystallization experiments following the hanging drop method, 2 µL of purified protein (apoCpI and CpIADT each at 1.3 mg/mL) in 10mM M Tris-HCl (pH 8) and
2 µL of viscous mother liquor (100 mM MES (pH 6), 0.4 M MgCl2, 20% glycerol, 20% PEG 4000)
were placed on glass cover slips. Glass cover slips with protein drops were placed above a mother liquor reservoir and two identically loaded 24-well plates were prepared. As control one plate stayed within the anaerobic chamber at 4 °C, while the second plate was brought to ambient atmosphere. To ensure O2 exposure, each glass cover slip was transferred at 4°C onto a
new, 24-well plate containing aerobic mother liquor. After a defined period of time (20 min, 1 h 10 min, 2 h 30 min, 4 h 15 min, 7 h and 21 h) the oxygen exposed glass cover slips with the protein were transferred back into the anaerobic tent. 4 µL of 10 mM Tris-HCl (pH 8) with 1.5 mM NaDT were added to quench the O2 present in the protein drops. Each drop was then
volume of 200 µL. For the re-maturated CpIADT samples 0.5 µL synthetic 2Fe
H mimic (38 mM,
1000-fold molar excess) in 100 mM K2HPO4/KH2PO4 (pH 6.8) was added to the reaction mixture.
For the control plate incubated under anaerobic conditions, an identical dilution scheme and assay was performed in parallel. Hydrogen formation was detected via gas chromatography after incubation at 37 °C for 20 min.
Crystallography
Crystals of apoCpI and CpIADT were grown in a hanging drop vapor diffusion experiment under
strictly anaerobic conditions in drops of 2µl protein solution (in 10 mM TrisHCl (pH 8.0) with 10 mg/ml protein concentration) with 2 µl reservoir solution at 4°C as described before5.
Reservoir solutions were 100 mM MES (pH 6.0) with 0.4 M MgCl2 and a total 40% v/v of
PEG4000 and glycerol (typically 20% PEG 4000) to achieve cryo-protection without additional cryo-protectant. Box-shaped crystals appeared after 2-4 days. Crystals for the 0 h time-point were mounted on CryoLoopsTM (Hampton Research) and flash-frozen with liquid N
2 under
anaerobic conditions. The same crystallization trays were subsequently removed from the anaerobic atmosphere chamber (Coy) and the glass cover slips, from which the crystallization drops were hanging, were moved under aerobic conditions to cover wells with identical reservoir solution, which were previously incubated under ambient atmosphere for 24 h to allow for saturation with O2. Earlier experiments (unpublished) had shown a strong dependence
of O2 diffusion on the individual vaseline seal of each crystallization well, if the crystal trays were
just incubated as is under ambient atmosphere. At the indicated time-points, individual crystallization wells were opened again and crystals were mounted at 4°C and subsequently flash-frozen with liquid N2.
Diffraction data collection
A total of 3 completely independent attempts (including protein expression) led to 96 crystals, which were screened in-house for diffraction quality. The best ones were measured at beamlines BM14 and ID29 at the ESRF and beamline PXII at SLS at an energy of 7.145 keV to make use of the strong anomalous diffraction of Fe atoms at the energy.
Calculations
All datasets were processed and analyzed with the software packages XDS6 and XSCALE and
were carefully inspected for radiation damage. Indexing of the 16 datasets revealed that most crystals showed the known spacegroup P1211, while some crystals were best integrated in the
higher symmetry spacegroup P21212. All datasets with spacegroup P1211 were treated as
acid positions, while avoiding rearrangement of Fe or S atoms within the clusters. Furthermore, the temperature factors of all atoms were refined and the occupancies of cluster atoms were adjusted during the refinement. Phenix.refine was not supplied with information about anomalous scatterers to keep the anomalous signal free from model bias. We chose the described refinement strategy since at the given resolution and with partial degradation of the clusters over time, we did not expect refinement of the cluster atom positions to result in meaningful structural solutions, but rather in wrong positioning of cluster atoms, which would have precluded our quantitative analysis of degradation of the original cluster conformation. The three datasets in spacegroup P21212 were treated analogously, but 4XDC could not be used
as input structure for the refinement. Instead, the best P21212 dataset at 0 h oxygen exposure
was used for molecular replacement with 4XDC as input model followed by 9 rounds of manual refinement with phenix.refine. The resulting structure was then used instead of 4XDC for a single round of refinement with the strategy described above.
After this first round of refinement, omit maps (given as intensities and phases) were calculated with phenix.composite_omit_map using 2 debias cycles of cartesian simulated annealing while omitting all atoms within [FeS] clusters and a 2.5 Å cushion around them in one fraction. From these omit maps two actual xyz-maps per dataset for 2Fo-Fc (actually 2Fo for omitted atoms) and
the anomalous signal were calculated, respectively, for all cluster atoms and a cushion of 3 Å around them with phenix.mtz2map scaling by volume and using a lower grid resolution factor to achieve maps with a grid spacing of 0.15 Å or lower. These omit maps were used to create the meshes in Figure 1.
For quantitative analysis similar to earlier publications7 those omit maps were used as input for
the program MAPMAN from the Uppsala Software Factory (USF), of which the “peek sphere” subroutine with keyword “mean” was used to calculate the average intensity of all grid points within a sphere with a given radius around the center of atoms of interest. Since diffraction datasets have no comparable absolute intensities, the average of the above calculated mean value of the four Fe atoms of the medial accessory [4Fe-4S] cluster (SF4M) were used as internal
standard; i.e. from this value a scaling factor for each dataset in comparison to the highest resolution dataset for CpIADT at 0 h oxygen exposure was calculated and all mean intensities of
atoms of interest within this dataset were scaled accordingly. Finally, for each atom of interest the average and s.d. of these scaled mean values of the signal within the sphere for both chain A and chain B of all datasets with the same time of exposure to oxygen were calculated resulting in multiplicities of 6, 2, 6, 2 and 6 for 0, 1, 2.5, 7 and 23 hours of oxygen exposure of CpIADT and
multiplicities of 2, 2, 2 and 4 for 0, 2.5, 7 and 23 hours of oxygen exposure of apoCpI. Before plotting, the average and s.d. of these scaled mean values were normalized to the average of
good balance between including as much intensity as possible even from low resolution
datasets with broadened peaks while not including significant intensity from neighboring atoms (Fig. S8). We calculated the mean intensities and s.d. for spheres around the Fe atoms with radii of 0.5, 0.75, 1, 1.25 and 2 Å and plotted them vs time of O2 exposure (Fig. S9-12). Only the
values for a radius of 2 Å show differences in the important trends discussed in the main text, but these values will be biased by the behavior of neighboring Fe atoms as demonstrated in Fig. S8.
Since scaling to the mean values of the anomalous density of the Fe atoms of the SF4M cluster
might lead to artefacts when quantifying the very different electron densities of light atoms, we set up an alternative calculation routine using the density of the Calpha atoms of the following
residues within the active site pocket as internal standard for scaling: 230, 231, 232, 299, 323, 324, 325, 353, 358, 417, 423, 497, 503. This scaling routine was used for the ligands of the 2FeH
and the S atoms of Cys and Met residues (see Figure S6).
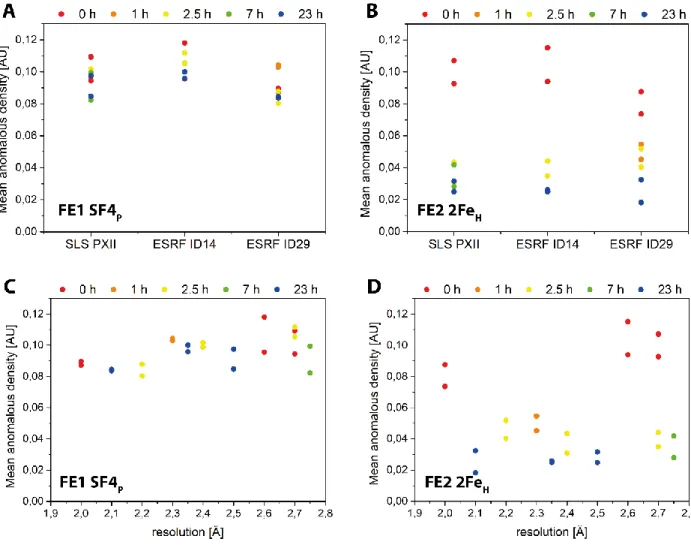
As additional means to rule out different radiation doses or different resolution limits between the different datasets as potential source for the observed effects, we plotted the anomalous signal of one atom with negligible effect and one atom with strong effect of O2 exposure for
each dataset against the beamline used to record the respective dataset and the high-resolution limit of the respective dataset. Figure S13 shows no correlation between beamline (radiation doses were kept identical at each beamline) or resolution and anomalous signal strong enough to have an influence on the distinct effects of O2 exposure discussed in this publication.
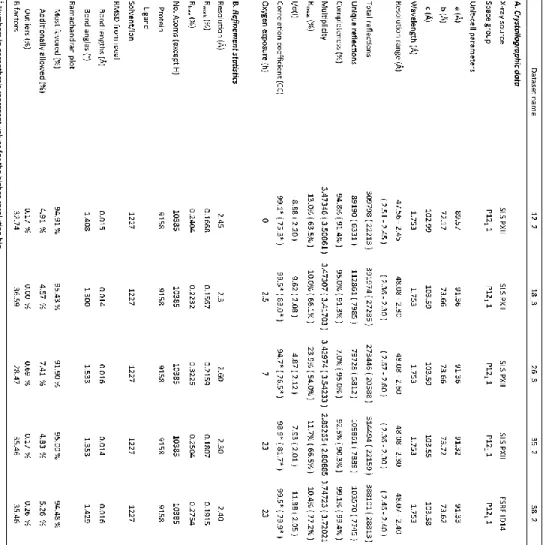
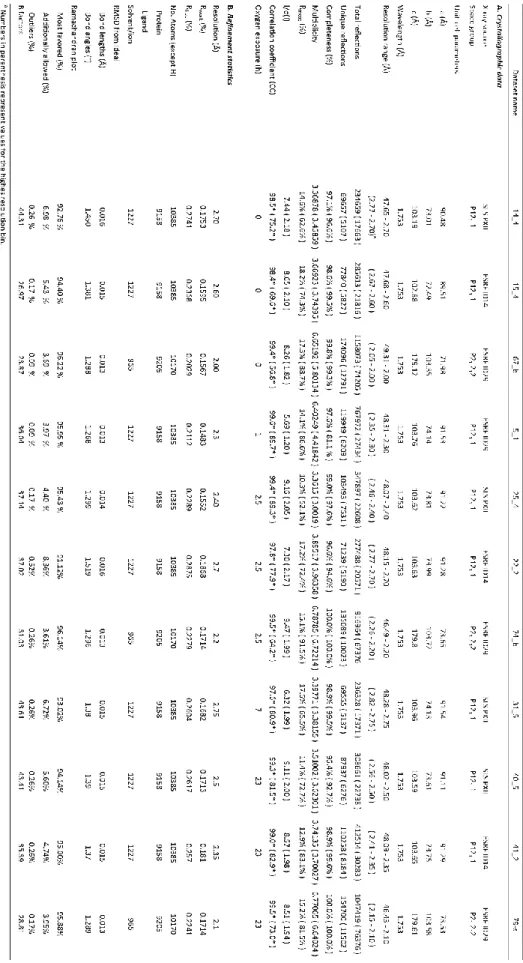
Crystal Data and Refinement Statistics
Additional structural data
Figure S1: Ball and stick models of the H-cluster and the accessory Fe/S clusters overlaid with simulated annealing omit maps of CpIADT after
0 h of O2 exposure. Grey mesh indicates
omit-maps at 1 σ cutoff, while red mesh shows anomalous difference density omit maps cut at 9 σ. Color code: Blue:N, Green:C, Red:O, Yellow:S, Rust: Fe, Grey: Ghost atoms indicating the position of the absent 2FeH in
apoCpI.
Figure S2: Ball and stick models of the H-cluster and the accessory Fe/S clusters overlaid with simulated annealing omit maps of CpIADT after
23 h of O2 exposure. Grey mesh indicates
omit-maps at 1 σ cutoff, while red mesh shows anomalous difference density omit maps cut at 9 σ. Color code: Blue:N, Green:C, Red:O, Yellow:S, Rust: Fe, Grey: Ghost atoms indicating the position of the absent 2FeH in
Figure S3: Ball and stick models of the H-cluster and the accessory Fe/S clusters overlaid with simulated annealing omit maps of apoCpI after 0 h of O2 exposure. Grey mesh indicates
omit-maps at 1 σ cutoff, while red mesh shows anomalous difference density omit maps cut at 7 σ. Color code: Blue:N, Green:C, Red:O, Yellow:S, Rust: Fe, Grey: Ghost atoms indicating the position of the absent 2FeH in
apoCpI.
Figure S4: Ball and stick models of the H-cluster and the accessory Fe/S clusters overlaid with simulated annealing omit maps of apoCpI after 23 h of O2 exposure. Grey mesh indicates
omit-maps at 1 σ cutoff, while red mesh shows anomalous difference density omit maps cut at 7 σ. Color code: Blue:N, Green:C, Red:O, Yellow:S, Rust: Fe, Grey: Ghost atoms indicating the position of the absent 2FeH in
Effects of O2 exposure on light atoms of the H-cluster and it’s immediate environment
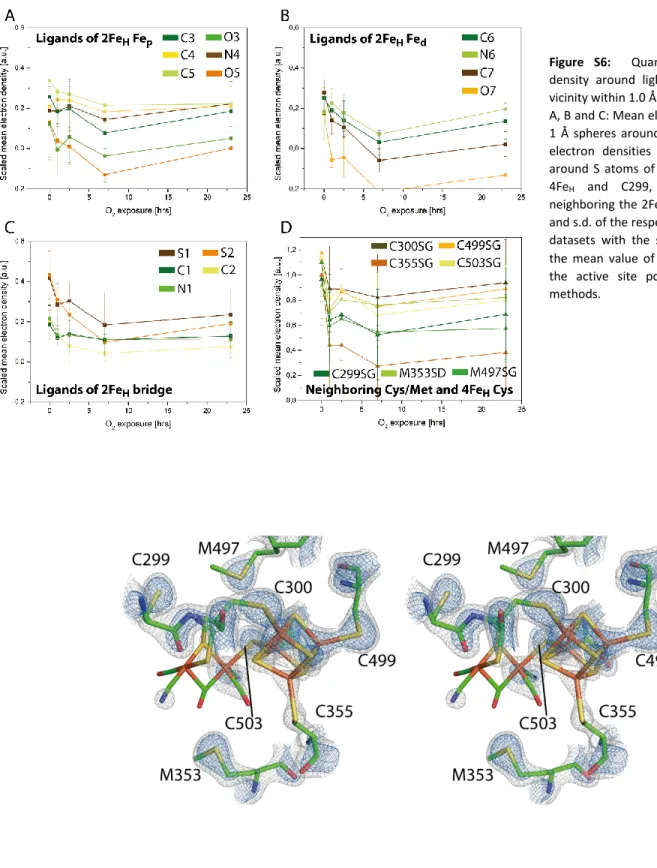
Figure S6: Quantitative analysis of electron density around light atoms of the 2FeH and its
vicinity within 1.0 Å radius.
A, B and C: Mean electron densities of omit map in 1 Å spheres around light atoms in 2FeH. D: Mean
electron densities of omit maps in 1Å spheres around S atoms of the four cysteines holding the 4FeH and C299, M353 and M497 directly
neighboring the 2FeH. Shown are the mean values
and s.d. of the respective atom in both chains of all datasets with the same exposure time scaled to the mean value of the C carbons of residues in the active site pocket as described in the SI methods.
Variation of radius of sphere integral
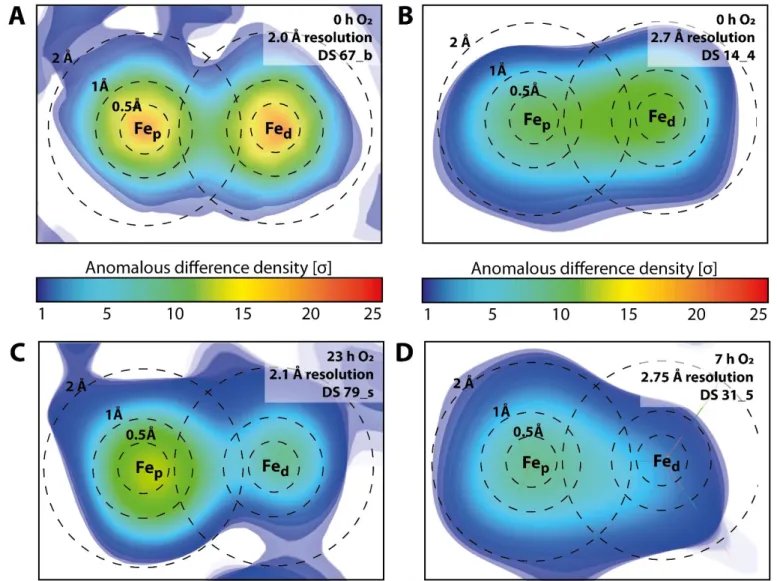
Figure S8: 2D heatmaps of anomalous difference density of simulated annealing omit maps of a plane through the Fe atoms of the 2FeH of select datasets. The plane chosen is parallel to the S atoms of 2FeH, which are located above the paper plane. The
selected datasets represent the best (A,C) and worst (B,D) resolution datasets before (A,B) and after longer O2 exposure (C,D).
Dashed lines indicate rings of given radius around the atom center as defined in the respective model and used for density calculations. Figure prepared with the volume module of pymol with color code as given by scale bars.
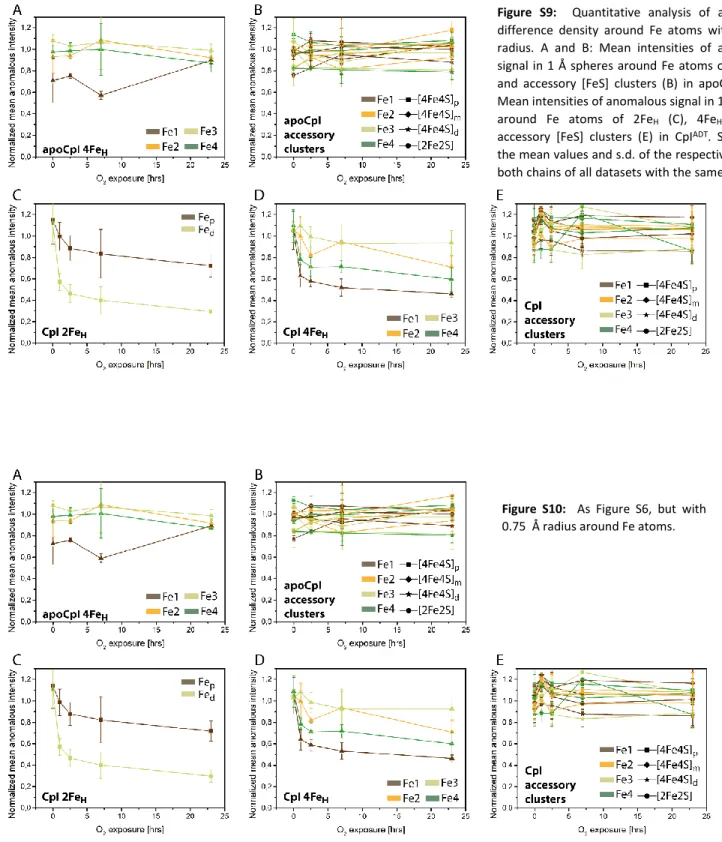
Figure S9: Quantitative analysis of anomalous difference density around Fe atoms within 0.5 Å radius. A and B: Mean intensities of anomalous signal in 1 Å spheres around Fe atoms of 4FeH (A)
and accessory [FeS] clusters (B) in apoCpI. C,D,E: Mean intensities of anomalous signal in 1Å spheres around Fe atoms of 2FeH (C), 4FeH (D) and
accessory [FeS] clusters (E) in CpIADT. Shown are
the mean values and s.d. of the respective atom in both chains of all datasets with the same exposure time.
Figure S10: As Figure S6, but with 0.75 Å radius around Fe atoms.
Figure S11: As Figure S6, but with 1.25 Å radius around Fe atoms.
Figure S12: As Figure S6, but with 2.00 Å radius around Fe atoms.
Variation of anomalous signal with beamline and high resolution limit
Figure S13: Mean anomalous density of select Fe atoms by beamline and by dataset resolution. Mean anomalous density of the strongly affected distal Fe (FE2) of the 2FeH subcluster (B,D) and the not affected FE1 of the buried proximal of the accessory
[4Fe4S] clusters (A,C) plotted for each beamline at which datasets were collected (A,B) and the nominal resolution (I/(I) >2) of each dataset (C,D), respectively. Values for chain A and chain B in each dataset are shown separately. Colors indicate oxygen exposure of the respective crystals before they were flash frozen: red: 0 h, orange: 1h, yellow: 2.5 h, green: 7 h, blue: 23 h.
Figure S14: Quantitative analysis of electron density around Fe atoms in accessory [4Fe4S] clusters within 1.0 Å radius.
Electron densities of omit map in 1 Å spheres around Fe atoms in SF4M. (A) and all accessory clusters (B), respectively. Shown are
the mean values and s.d. of the respective atom in both chains of all datasets with the same exposure time scaled to the mean value of the C carbons of residues in the active site pocket as described in the SI methods.
References
(1) Kuchenreuther, J. M.; Grady-Smith, C. S.; Bingham, A. S.; George, S. J.; Cramer, S. P.;
Swartz, J. R. High-Yield Expression of Heterologous [FeFe] Hydrogenases in Escherichia Coli. PLoS ONE 2010, 5 (11). https://doi.org/10.1371/journal.pone.0015491.
(2) von Abendroth, G.; Stripp, S.; Silakov, A.; Croux, C.; Soucaille, P.; Girbal, L.; Happe, T. Optimized Over-Expression of [FeFe] Hydrogenases with High Specific Activity in Clostridium Acetobutylicum. Int. J. Hydrog. Energy 2008, 33 (21), 6076–6081. https://doi.org/10.1016/j.ijhydene.2008.07.122.
(3) Esselborn, J.; Lambertz, C.; Adamska-Venkatesh, A.; Simmons, T.; Berggren, G.; Noth, J.; Siebel, J.; Hemschemeier, A.; Artero, V.; Reijerse, E.; et al. Spontaneous Activation of [FeFe]-Hydrogenases by an Inorganic [2Fe] Active Site Mimic. Nat. Chem. Biol. 2013, 9, 607–609. https://doi.org/10.1038/nchembio.1311.
(4) Hemschemeier, A.; Melis, A.; Happe, T. Analytical Approaches to Photobiological Hydrogen Production in Unicellular Green Algae. Photosynth. Res. 2009, 102 (2–3), 523–540.
https://doi.org/10.1007/s11120-009-9415-5.
(5) Esselborn, J.; Muraki, N.; Klein, K.; Engelbrecht, V.; Metzler-Nolte, N.; Apfel, U.-P.;
Hofmann, E.; Kurisu, G.; Happe, T. A Structural View of Synthetic Cofactor Integration into [FeFe]-Hydrogenases. Chem. Sci. 2016, 7 (2), 959–968.
https://doi.org/10.1039/C5SC03397G.
(6) Kabsch, W. XDS. Acta Crystallogr. D Biol. Crystallogr. 2010, 66 (2), 125–132. https://doi.org/10.1107/S0907444909047337.
(7) Spatzal, T.; Aksoyoglu, M.; Zhang, L.; Andrade, S. L. A.; Schleicher, E.; Weber, S.; Rees, D. C.; Einsle, O. Evidence for Interstitial Carbon in Nitrogenase FeMo Cofactor. Science 2011, 334 (6058), 940–940. https://doi.org/10.1126/science.1214025.