DIVERSITY OF THE PACIFIC-JAPAN PATTERN AND ITS INFLUENCES ON NORTHWEST PACIFIC TROPICAL CYCLONE ACTIVITY
Wenjing Liu
A thesis submitted to the faculty at the University of North Carolina at Chapel Hill in partial fulfillment of the requirements for the degree of Master of Science in the Department of Marine
Sciences.
Chapel Hill 2020
© 2020 Wenjing Liu
ABSTRACT
Wenjing Liu: Diversity of the Pacific-Japan pattern and its influences on Northwest Pacific tropical cyclone activity
(Under the direction of Wei Mei)
The Pacific-Japan (PJ) pattern features a meridional dipole pattern of atmospheric circulation between the tropical and midlatitude Northwest Pacific. Using observations and large-ensemble atmospheric simulations, this thesis shows that the PJ pattern has experienced distinct changes in its property and forcing mechanism from the period 1976-1988 to 1991-2010, with the source of forcing shifting from the tropical Indian Ocean to the tropical western-central Pacific Ocean. These changes are tied to changes in the characteristics of El Niño-Southern Oscillation (ENSO), i.e., shifting from a combination of various types of ENSO to dominance of central-Pacific ENSO, leading to reduced and increased sea surface temperature variance
ACKNOWLEDGEMENTS
I would like to express my gratitude to my research supervisor, Dr. Wei Mei for giving me the opportunities to investigate the topic I am interested in and providing guidance
throughout the three years. He has taught me the methodology to conduct research and the spirit of never giving up improving my results. I am also thankful for the patience he showed during the discussion on my research work and thesis preparation.
I am extremely grateful to my knowledgeable committee members, Professor Harvey Seim and Professor Rick Luettich, for their help and support during the three years. I am impressed by their kindness, consideration, and a great sense of humor. My sincere thanks also go to Professor John Bane, who is really brilliant and helpful. I took many courses from him and learned a lot. I also want to say thank you to Professor Marc Alperin and Professor Emily Eidam, who helped me a lot and teach me how to present my research work clearly. I am extremely grateful for what they have offered me.
I thank my family for their love and support throughout my life. I would like to say thanks to my friends and colleagues at UNC, Chuxuan, Lu, Taylor, and Lauren, for their help and support during my research projects. I am grateful to Youichi Kamae for offering us the large-ensemble simulation data. I also want to express my appreciation to UNC, I am delighted to have opportunities to study and work at such a beautiful campus.
TABLE OF CONTENTS
LIST OF FIGURES ... vii
Introduction ...1
Data and methods ...4
Data ...4
TC tracking algorithm ...5
Analysis methods ...6
The reproducibility in d4PDF model ...7
The reproducibility of the PJ pattern ...7
The reproducibility of the simultaneous SSTA pattern related to the PJ pattern ...8
The reproducibility of TC activities ...9
The shift of the PJ pattern ...10
Period 1 (1976-1988) ...11
Summary and discussion ...17
Figures...21
LIST OF FIGURES
FIG. 1 – The 11-year running correlation coefficients between the PJ index and SSTAs ...21
FIG. 2 – The comparison of the PJ pattern and associated simultaneous
SSTA pattern in observations and simulations during 1970-2010 ...22
FIG. 3 – The comparison of TC activities in observations and simulations during 1970-2010 ....23
FIG. 4 – The distribution of the correlation coefficients between the PJ
indices from different datasets ...24
FIG. 5 – The comparison of the PJ pattern in observations and simulations during 1976-1988 ...25
FIG. 6 – Regressed SSTA evolution in the HSG and LSG during 1976-1988 ...26
FIG. 7 – Regressed atmospheric circulation anomalies in the HSG and
LSG during 1976-1988 ...27
FIG. 8 – SSTA EOFs in the HSG during 1976-1988 ...28
FIG. 9 – SSTA EOFs in the LSG during 1976-1988 ...29
FIG. 10 – The comparison of the PJ pattern in observations and simulations
during 1991-2010 ...30
FIG. 11 – Regressed SSTA evolution in the HSG and LSG during 1991-2010 ...31
FIG. 12 – Regressed atmospheric circulation anomalies in the HSG and
LSG during 1991-2010 ...32
FIG. 14 – The interannual variation in JJA SSTAs over the tropical IO and Pacific ...34
FIG. 15 – The influences of the PJ pattern on TC genesis frequency ...35
Introduction
The Pacific-Japan (PJ) pattern, also known as the East Asia-Pacific pattern, is an
intraseasonal to interannual teleconnection affecting the summertime climate anomalies over the Northwest Pacific (NWP) and East Asia (Nitta 1986; Nitta 1987; Huang and Sun 1992; Kosaka and Nakamura 2006). Nitta (1986) first defined it as a meridional dipole pattern of cloud anomalies between the northern tropics and the middle latitudes extending from East China to the dateline. Recently, the PJ pattern is always represented by anomalous 850-hPa relative vorticities (Kosaka and Nakamura 2010; Chen and Zhou 2014; Gong et al. 2018). During the positive phase, the two lobes of the PJ pattern are characterized by anomalous anticyclone (AAC) in the tropical NWP and anomalous cyclone (AC) in the middle latitudes (Kosaka and Nakamura 2010; Chen and Zhou 2014; Gong et al. 2018), which indicate suppressed convection over the South China Sea (SCS) and the Philippine Sea associated with enhanced convection around Japan. During the negative phase, the lower-tropospheric anomalous circulation and convection show opposite features.
interdecadal variability, with significant correlations at the beginning of the 20th century, about the 1930s, and since the 1970s (Kubota et al. 2016). In addition, models forced by realistic tropical sea surface temperature (SST) can capture the majority of the PJ variability (Ding et al. 2014; Chen and Zhou 2014; Gong et al. 2018). The SSTAs in the tropical Indian Ocean (IO) mainly force the PJ pattern during the period 1981-1993 via Indo-western Pacific ocean capacitor (IPOC) (Xie et al. 2009; Chen and Zhou 2014), and the SSTAs from the maritime continent (MC) and central Pacific (CP) are the major contributors to the PJ pattern from 1994 to 2006 (Chen and Zhou 2014). The decadal change of the PJ pattern could relate to the decadal variability of ENSO (Kwon et al. 2005; Yim et al. 2008a, 2008b), which is modulated by the Pacific Decadal Oscillation (PDO) (Yoon and Yeh 2010).
However, the PJ pattern is not completely forced by SSTAs. Similar to the Pacific-North American (PNA) teleconnection pattern, the PJ pattern is a Rossby wave train riding on the zonal mean flow, whose excitation needs energy from the zonally varying background flow (Simmons et al. 1983; Xie et al. 2016), especially in the middle latitudes. The PJ pattern is an internal mode of the atmosphere, maintained by tropical convective variability and the background state via barotropic and baroclinic energy conversion (Kosaka and Nakamura 2010; Hirota and Takahashi 2012).
TCs, which will lead to decreased landfalls on East China, Japan and Korean Peninsula (Choi et al. 2010; Kim et al 2012).
Data and methods
Data
In this study, the reanalysis data of SST, winds at 850 hPa and 500 hPa, sea level pressure (SLP), and pressure vertical velocity are obtained from the monthly mean data of the European Centre for Medium-Range Weather Forecasts (ECMWF) twentieth-century reanalysis (ERA-20C) dataset, which covers from 1900 to 2010 with a 1°×1° horizontal resolution (Poli et al. 2016). The observed TC track data are from the Best Track Archive of the Joint Typhoon Warning Center (JTWC), which includes the locations and maximum sustained wind speeds of TCs at intervals of every 6 hours since 1945.
The large-ensemble atmospheric simulation data and SST simulations we use are from the Database for Policy Decision Making for Future Climate Change (d4PDF; Mizuta et al. 2017), which incorporates simulations by the Meteorological Research Institute Atmospheric General Circulation Models, version 3.2 (MRI-AGCM3.2; Mizuta et al., 2012). The 64-vertical-level MRI-AGCM3.2 features the horizontal grid spacing of 60 km, which is fine enough to capture TCs and East Asia monsoons. The 100-member historical climate simulations, which span the period 1951 to 2010, are used to investigate the PJ pattern and its influences on TCs in this study. The historical climate simulations are forced by SST, sea ice concentration, and sea ice thickness. In this experiment, the global-mean concentrations of greenhouse gases are set to be the observational values, the three-dimensional distributions of ozone are from the MRI Chemistry-Climate Model (MRI-CCM; Deushi and Shibata 2011), and aerosols are from the MRI Coupled Atmosphere-Ocean General Circulation Model, version 3 (MRI-CGCM3;
the ensemble mean. The deviation represents the internal variability of the model and the
uncertainty from it is important for weather and climate extremes (Harzallah and Sadourny 1995; Deser et al. 2012; Xie et al. 2015). Conducting large-ensemble simulations is beneficial to assess the influences of internal variability on the climate system by reducing the impact of model errors (Kay et al. 2015). The ensemble mean is necessary to analyze the atmospheric responses to external forcing like SST (Harzallah and Sadourny 1995; Li 1999). More details about experimental design are described in Mizuta et al. (2017).
TC tracking algorithm
The tracking algorithm used in this study is modified from the methodology described in Mei et al. (2014). We use 6-hour data including winds at 850 hPa, SLP, and temperature
averaged between 300 hPa and 500 hPa from 1951 to 2010 to detect and track TCs. Firstly, we detect potential storms according to the criteria listed below:
1) The 850-hPa relative vorticity maxima in areas of 2.0°×2.0° latitude and longitude must exceed 4.5×10⁻⁵s-1.
2) The local SLP minimum must be within a distance of 2.0° latitude or longitude from the 850-hPa relative vorticity maximum and be at least 1.2 hPa lower than the environment. The SLP minimum is defined as the center of the storm.
3) The local maximum of 300–500-hPa averaged temperature is defined as the center of the warm core. Its distance from the storm center must be within 6° latitude or longitude, and its temperature must be at least 0.08 °C warmer than the environment.
1) The distance between two points in two consecutive snapshots (with a time interval of 6 hours) must be shorter than 585 km.
2) The track must last longer than 2 days.
3) The genesis wind speed must be less than 15 mꞏs-1.
4) The maximum surface wind speed should exceed 10 mꞏs-1 during the life cycle of the TC and it couldn’t be reached within 18 hours of the TC generation.
5) The maximum wind speed at 850 hPa must be greater than that at 300 hPa.
6) If the TC forms over the sea, more than 40% of the TC lifespan must be over the sea. If the TC generates on the land, more than 70% of the TC lifespan must be over the sea.
Analysis methods
The reproducibility in d4PDF model
The reproducibility of the PJ pattern
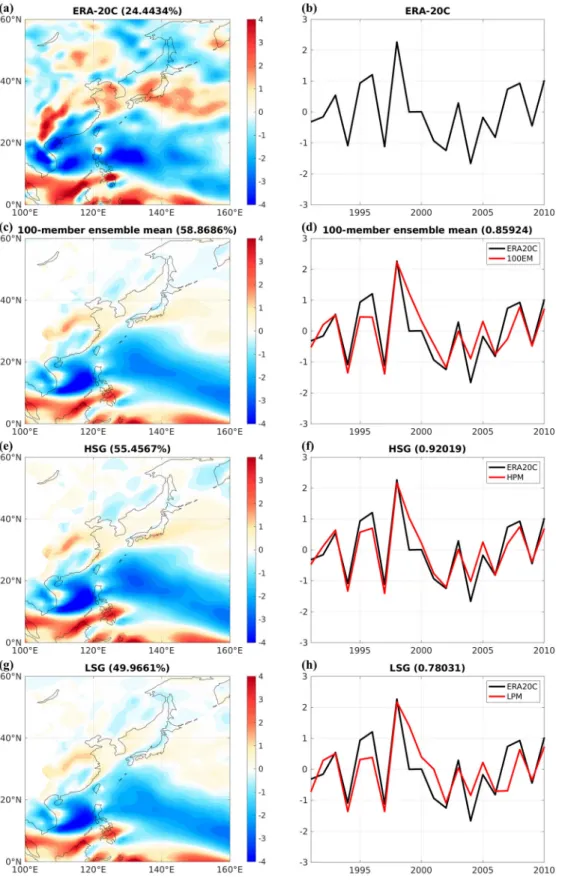
Here, we use the first leading EOF mode of 850-hPa relative vorticity to represent the PJ pattern, following previous studies (e.g., Kosaka and Nakamura 2010). Fig 2a shows the spatial structure of the positive PJ pattern in the ERA-20C dataset (referred to as observations
hereafter), which explains 16.62% of the total variance in the vorticity EOF domain (0°–60°N, 100°–160°E). This pattern features a meridional wave train pattern zonally elongating from East Asia to the Pacific Ocean, with its tropical and midlatitude lobes characterized respectively by an AAC and AC in the lower troposphere.
these members. The atmospheric processes may not be well reproduced by the model, and the ensemble mean also moderates the effects of internal variability. Thus, the simulated amplitudes at midlatitudes are less than the observations.
The PJ index is defined as the PC1, and the 100-member ensemble mean well reproduces the observational PC1. The correlation coefficient between these two PCs is 0.62 during the period 1970-2010, which is statistically significant at the 1% level (Fig 2c).
The reproducibility of the simultaneous SSTA pattern related to the PJ pattern
The ensemble mean simulations can well reproduce the spatial structure of the PJ pattern in observations, indicating that the SST-forced variability plays an important role in the PJ pattern. Therefore, we compare the reproducibility of the simultaneous SSTA pattern associated with the PJ pattern (Figs 2d and 2e). The SSTAs regressed onto the corresponding PJ index are considered as the PJ-related SSTAs. In the observations, the tropical IO and MC feature
The reproducibility of TC activities
Figs 3a and 3b show the distribution of TC genesis locations and tracks during 1970-2010 over the NWP in observations and one-member simulations. The d4PDF simulations can
basically reproduce the distribution of the TC genesis locations in the observations, except for too many TCs generating in the SCS and around the equator. The simulated TC tracks capture the major characters of TC tracks in observations, including the tracks moving westward to the SCS and the tracks curving northwestward to Japan and Korea (Fig 3b). Comparing with the observational tracks, the simulated ones are much longer.
The climatological TC genesis frequency and track density are calculated for
observations and 100-member ensemble mean simulations (Figs 3c and 3d). The TC genesis frequency climatology is defined as the mean value of counts of TCs originated within each 5°×5° grid over the NWP during 1970-2010. Similar to the genesis frequency, the track density is calculated by the duration of TC tracks in each 5°×5° grid. According to the distribution of observed genesis frequency, most of the TCs generate between 5°N and 25°N, with two high-frequency centers locating in the SCS and the Philippine Sea respectively, which are well reproduced by the simulations. The distribution of simulated track density is also analogous to the observed one, except for the eastward extension around 20°N. The high track density area is over 10°-30°N, 110°-140°E, indicating the high exposure risk to the TCs, and the distribution denotes the westward and northwestward moving tracks.
individual members, which deviate from the ensemble mean. The climatological TC count in the 100-member ensemble mean (26.29) is comparable to that in observations (26.05).
The shift of the PJ pattern
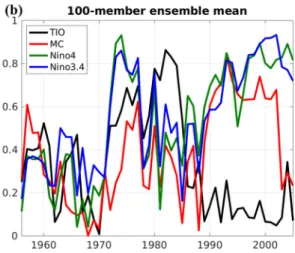
The interannual variability of the PJ pattern experiences a shift from a tropical IO SSTA forced pattern to a tropical Pacific SSTA forced pattern around the early 1990s (Chen and Zhou 2014). To identify the periods dominated by SSTAs in the tropical IO and tropical Pacific respectively, 11-year running correlation coefficients are calculated between SSTAs and the PJ index (Fig 1). The PJ index is calculated by conducting the running EOF analysis. The tropical IO SSTAs are the average SSTAs over the region 0°–20°N, 50°–100°E and the Pacific effects are represented by the area-averaged SSTAs in the MC, Niño 4 and Niño 3.4 regions together. The running correlation coefficients between the PJ index and SSTAs exhibit an obvious shift around 1990 in both observations and the 100-member ensemble mean (Figs 1a and 1b). To better define the two periods before and after the shift, the correlation coefficients in
observations and model simulations are averaged and shown in Fig 1c. It becomes evident that the PJ index is significantly correlated with the tropical IO SSTAs during 1976-1988, while it is significantly correlated with the Pacific SSTAs during 1991-2010. Accordingly, we will study the PJ pattern separately over these two periods.
The reproducibility of the PJ pattern can vary significantly among different members in the simulations during these two periods. To illustrate the differences, members can be divided into different groups based on their performance of replicating the PJ pattern, and the ensemble means of the members in different groups can indicate the diversity of the modeled PJ pattern. 20 members are selected as the high skill group (HSG) according to the highest correlation
members in the low skill group (LSG) have the lowest correlation coefficients. The HSG can be beneficial to understand the mechanisms of the SST-forcing, and the LSG can give indications of model bias for model improvement.
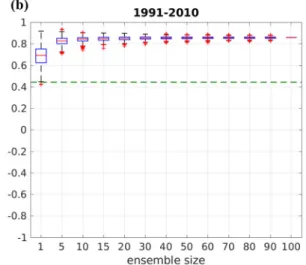
Next, we estimate how many ensemble members are needed to capture the observed variability in the PJ pattern by using the bootstrap method and analyzing a large number of combinations of ensemble members based on the entire 100 members. Fig 4 shows the
distribution of the correlation coefficients between the PCs in the observations and the ensemble mean as a function of ensemble size as a box-and-whisker plot. As the ensemble size increases, the correlation coefficient increases and the range narrows. In general, the correlation coefficient is significantly higher during the second period than in the first period for all ensemble sizes, suggesting that the ensemble members have very different performance in the first period while the members show similar behaviors during the second period. For the first period, the rate of increase of correlation coefficients decreases with the ensemble size, and the correlation
coefficient becomes stable when the ensemble size exceeds 20, indicating that an ensemble of 20 members should be sufficient to reproduce a significant portion of the observed variability in the PJ pattern. In contrast, 5 members are sufficient to capture the observed variability during the second period.
Period 1 (1976-1988)
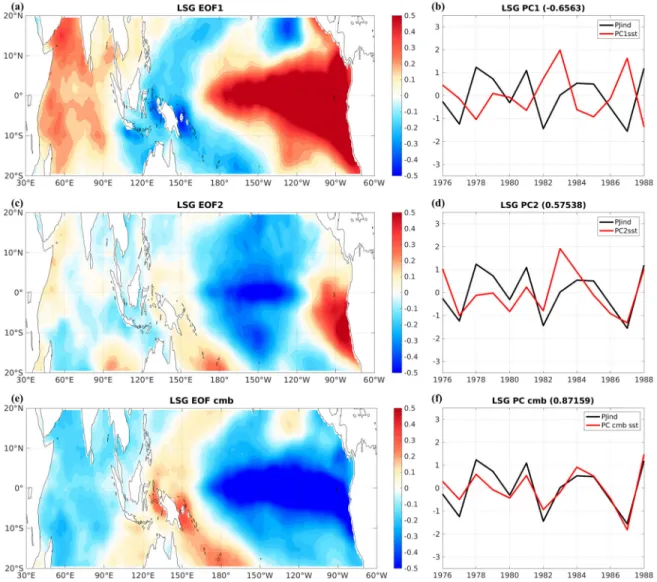
of 5% (Fig 5d). In the HSG simulations, the spatial pattern is better captured than the 100-member ensemble mean simulations, with a pattern correlation coefficient of 0.70; note that the break in the tropical lobe over the Philippines is much weaker in the HSG spatial pattern (Fig 5e). The correlation coefficient between the PJ indices is higher (0.78) and significant at the 1% level (Fig 5f). In the LSG, although the two lobes can be identified according to the spatial pattern, they are much weaker than those in other groups and the shape is more chaotic (Fig 5g). Besides, the correlation of the PJ indices between the LSG and observations is negative (-0.42) and insignificant (Fig 5h). The HSG well replicates the spatial pattern of regressed SSTAs and large-scale circulation anomalies in observations, therefore the SSTA evolution and large-scale circulation pattern in observations and 100-member ensemble mean simulations are not shown. The LSG, however, shows different patterns from the HSG (Figs 6 and 7), and the regressed JJA SSTAs over the tropical IO in the LSG are not significantly correlated with the corresponding PJ index (Fig 6f). During the first period, the performance of different members varies largely, and it could result from various ENSO effects on different members.
During this period, the PJ index is significantly correlated with the warm JJA SSTAs in the tropical IO (Fig 6c), which will force the PJ pattern via IPOC (Xie et al. 2009). The IO is considered as a capacitor because it can memorize the influences of the El Niño event in the preceding winter, shown as the warm SSTAs in the IO (Figs 6a-6c). The anomalous warm IO will enhance the local convection and induce a Kelvin wave (Xie et al. 2009). The anomalous negative pressure vertical velocity at 500 hPa in the IO represents the strong convective
in the tropical NWP, as evidenced by the anomalous positive 500-hPa pressure velocity over the SCS and east of the Philippines (Fig 7a). The suppressed convection and low-level divergence are verified by the wind field at 850 hPa, with an AAC in the tropical area (Fig 7a), which is the south lobe of the PJ pattern. Thus, the Rossby wave train is excited. Figs 6a-6c demonstrate the global SSTA evolution in the HSG during the first period, which resembles a decaying El Niño event prominent in the Eastern Pacific (EP). The PJ pattern during the first period is basically associated with a decaying EP ENSO.
from the preceding winter also bears a resemblance to a developing CP La Niña in the LSG (Figs 6d-6f), illustrating the essential influences of the CP ENSO on the PJ pattern.
The PJ pattern plays an essential role in modulating the TC activities over the NWP. The 100-member ensemble mean simulations basically reproduce the spatial pattern of TC genesis frequency and track density, and there exist narrow discrepancies between different members in the simulations by comparing the HSG and LSG (figures not shown). Thus, the different effects on TC activities among 100 members are due to the reproducibility of the PJ pattern in the model. By regressing the TC genesis frequency anomalies and track density anomalies on the PJ index, we can investigate the influences of the PJ pattern on TC activities (Figs 15 and 16). During the positive phase of the PJ pattern, more TCs generate in the tropical ocean south of 10°N, while fewer originated in the region north of 10°N (Fig 15a). The anomalous downward motion between 10°N and 20°N, which indicates weaker convection, can contribute to
suppressed TC generation in this area, while the enhanced convection represented by the
anomalous upward motion south of 10°N is favorable for TC genesis (Fig 15a). As for the track density, more tracks tend to move westward to land in Southeast Asia during the positive phase of the PJ pattern, and fewer are curving northwestward to Japan and Korea. The AAC over the tropical NWP can hinder the northwestward motion of TCs, and the winds at 500 hPa act as steering flow to direct TCs to Southeast Asia (Fig 16a). When it is the negative phase of the PJ pattern, more TCs will generate in the north part of the tropical NWP. The landfalls will increase in Japan and Korea while decrease in Southeast Asia (Figs 15b and 16b). The distribution of TC genesis frequency and track density related to the positive PJ pattern is more evident and
during the second period, indicating the possible strong CP ENSO influences on low skilled members (Figs 16d and 16h).
Period 2 (1991-2010)
The spatial pattern of the observed positive PJ pattern during the second period is shown in Fig 10a. In comparison with the spatial pattern during the first period, the lobes in the second period are more comparable with those during 1970-2010, because this pattern dominates in the study period. The spatial structure of the PJ pattern is well simulated in the 100-member
ensemble mean simulations, with a pattern correlation coefficient of 0.76 (Fig 10c), and the simulated PJ index is highly correlated with the observed one (correlation coefficient 0.86) at the significance level of 1% (Fig 10d). The performance of HSG is better, with a correlation
coefficient of 0.92 between observed and simulated PCs. Unlike the first period, the LSG shows similarity to the HSG, with comparable spatial patterns and time series (Figs 10e-10h). The similarity is also apparent in the regressed SSTA evolution and large-scale circulation anomalies (Figs 11 and 12). The analogies between HSG and LSG demonstrate that the model can well simulate the PJ pattern forced by Pacific SSTAs, with few disparities between different members. This could result from the significant responses of the model to the Pacific SSTAs.
a descending Rossby wave over the NWP, leading to local negative low-level vorticity anomalies, which can be considered as the tropical lobe of the PJ pattern during the second period. The vorticity anomalies are verified by the AAC shown in the 850-hPa wind field (Fig 12a), with suppressed convection at the southern flank of the AAC. The suppression over the SCS and the Philippine Sea is also related to the convection in the MC by local Hadley circulation. These three centers are connected by Walker circulation, Rossby wave, and local Hadley circulation and can reinforce each other, as the forcing mechanism of the PJ pattern during the second period. This mechanism is dominant when a CP ENSO event is developing (Figs 11a-11c).
The linear combination of the first two EOF modes of the JJA SSTAs can explain about 58% of the total SSTA variance in the second period, shown as CP La Niña and warm SSTAs in the MC (referred to as western-central Pacific pattern hereafter; Fig 13e), which bears a striking similarity to the regressed SSTA pattern in tropical areas in Fig 11c. The EOF1 resembles the EP La Niña, which explains around 40% of the total SSTA variance, while the EOF2 is more
variability in the CP during the second period and stronger variation in the EP and IO during the first period. The same conclusion can be drawn based on the simulations of the 100-member ensemble mean (Fig 14f).
Similar to the first period, the simulations also reproduce the major high-frequency areas of TC genesis frequency and track density during the second period (figures not shown). The regression of TC genesis frequency anomalies on the PJ index illustrates that fewer TCs generate in the NWP during the positive phase of the PJ pattern in this period (Fig 15e). The anomalous downward motion over the high genesis frequency area, a representation of suppressed
convection, is the major contributor to suppressed TC generation in this area (Fig 15e). The track density decreases over the NWP, resulting from the decreased TC counts in the positive PJ years and the AAC over the NWP (Fig 16e). During the negative PJ phase, however, the anomalous upward motion and AC in the tropical areas are favorable for TC generation and landing, which will enhance the TC activities in the NWP (Figs 15f and 16f). The distribution of TC genesis frequency and track density is more obvious in the simulations, featuring the reduced genesis frequency and track density all over the NWP in the positive PJ years (Figs 15g-h and 16g-h) and opposite features in the negative PJ years (figures not shown).
Summary and discussion
The observed and d4PDF simulated data are used to investigate the SST-forcing
period, the interannual variability of the PJ pattern experiences a shift from an IO SSTA forced pattern to a Pacific SSTA forced pattern around 1990, which is captured in both observations and simulations. To better investigate the differences between these two forced PJ patterns, we divided the study period into two parts, which are 1976-1988 (the first period) and 1991-2010 (the second period).
During the first period, the PJ pattern is mainly forced by the IO SSTAs remotely via IPOC. The IO SSTAs in the summer persist since the preceding winter when an El Niño event occurs and act as a capacitor to anchor the AAC in the tropical NWP. The warm IO SSTAs enhance the local convection and inspire a Kelvin wave at lower troposphere along the equator, and the associated surface divergence in the NWP tropical area suppresses the convection there then excites the PJ pattern as a Rossby wave train. The forcing mechanism of the PJ pattern is usually related to decaying EP ENSO. The TCs tend to generate in the south part of the NWP and make landfalls in Southeast Asia, accompanied by fewer landfalls in Japan and Korea during the positive phase of the PJ pattern. This can be explained by the suppressed convection in the tropical areas and the winds at 500 hPa as steering flow. During negative PJ years, the TC activities show the opposite pattern. This mechanism is supported by the observational data and the HSG in the simulations, but large disparities are found between the HSG and LSG
simulations, which can result from the different responses to the Pacific SSTAs among different members.
suppressed convection in the CP, and the local Hadley circulation between the MC and NWP. The forced PJ pattern can be associated with developing CP ENSO events. Fewer TCs generate in the NWP during the positive phase of the PJ pattern in this period, attributing to the
anomalous suppression over the high TC genesis frequency area in the NWP. Responding to the lower genesis frequency, the TC track density over the entire NWP also reduces in the positive PJ years. The TC activities are enhanced during the negative phase of the PJ pattern. The observations and simulations demonstrate analogous patterns during this period, and the
discrepancies are also small among different members. It might be due to the major SST-forcing in this period is from the Pacific, and the effects of the Pacific SSTAs will not lead to disparities among different members.
The shift of the forcing mechanisms may be related to changes in the characteristics of ENSO, which shift from a combination of various types of ENSO to dominance of central-Pacific ENSO (Wang et al. 2019). The change of the ENSO types leads to different SST
interannual variations over the tropical IO and Pacific, which will further induce the PJ pattern in different mechanisms. When an EP ENSO decays in the preceding seasons, the SSTA variation in the IO and EP will be higher, corresponding to the PJ pattern forced by IO SSTAs. The various responses to the Pacific SSTAs among different members lead to the diversity of the model performance. If the CP ENSO is dominant, the region with high SSTA variations is the CP, with Pacific SSTA forcing the PJ pattern. The discrepancy between the HSG and LSG is small. This can give some clues to improve the model so that it reproduces a more realistic PJ pattern.
Figures
FIG. 2. EOF1 of JJA 850 hPa relative vorticity (10-6 s-1)
FIG. 3. NWP TC genesis locations (black dots) and tracks (green curves) during 1970-2010 from (a) observations and (b) one-member simulations of d4PDF. The distribution of the climatological TC genesis frequency (countsꞏyear-1, shading) and track density
(daysꞏyear-1, contours) between 1970 and 2010
FIG. 7. Regressed JJA vertical pressure velocity (omega) anomalies at 500 hPa (Paꞏs-1, shading) and wind anomalies
at 850 hPa (mꞏs-1, arrows) against PC1 during 1976-1988 in the (a) HSG and (b) LSG. Dots indicate the regions
where the regressed omega anomalies exceed the 0.05 significance level. Wind anomalies exceeding the 0.05 significance level are drawn.
REFERENCES
Chen, X. and T. Zhou (2014). "Relative role of tropical SST forcing in the 1990s periodicity change of the Pacific-Japan pattern interannual variability." Journal of Geophysical Research: Atmospheres 119(23): 13,043-013,066.
Choi, K.-S., et al. (2010). "Change of tropical cyclone activity by Pacific-Japan teleconnection pattern in the western North Pacific." Journal of Geophysical Research: Atmospheres 115(D19).
Deser, C., et al. (2012). "Uncertainty in climate change projections: the role of internal variability." Climate Dynamics 38(3): 527-546.
Deushi, M. and K. Shibata (2011). "Development of a Meteorological Research Institute Chemistry-Climate Model version 2 for the Study of Tropospheric and Stratospheric Chemistry." Papers in Meteorology and Geophysics 62: 1-46.
Ding, H., et al. (2014). "The variability of the East Asian summer monsoon and its relationship to ENSO in a partially coupled climate model." Climate Dynamics 42(1): 367-379.
Gong, H., et al. (2017). "Biases of the wintertime Arctic Oscillation in CMIP5 models." Environmental Research Letters 12: 014001.
Gong, H., et al. (2018). "Diversity of the Pacific–Japan Pattern among CMIP5 Models: Role of SST Anomalies and Atmospheric Mean Flow." Journal of Climate 31(17): 6857-6877.
Ha, Y., et al. (2014). "Decadal change of South China Sea tropical cyclone activity in mid-1990s and its possible linkage with intraseasonal variability." Journal of Geophysical Research: Atmospheres 119(9): 5331-5344.
Harzallah, A. and R. Sadourny (1995). "Internal Versus SST-Forced Atmospheric Variability as Simulated by an Atmospheric General Circulation Model." Journal of Climate 8(3): 474-495.
Huang, R. and F. Sun (1992). "Impacts of the Tropical Western Pacific on the East Asian Summer Monsoon." Journal of the Meteorological Society of Japan. Ser. II 70(1B): 243-256.
Kay, J., et al. (2015). "The Community Earth System Model (CESM) Large Ensemble Project: A Community Resource for Studying Climate Change in the Presence of Internal Climate Variability." Bull. Amer. Meteor. Soc.
Kim, J.-S., et al. (2012). "Effects of the Pacific-Japan teleconnection pattern on tropical cyclone activity and extreme precipitation events over the Korean peninsula." Journal of
Geophysical Research: Atmospheres 117(D18).
Kosaka, Y. and H. Nakamura (2006). "Structure and dynamics of the summertime Pacific–Japan teleconnection pattern." Quarterly Journal of the Royal Meteorological Society 132(619): 2009-2030.
Kosaka, Y. and H. Nakamura (2010). "Mechanisms of Meridional Teleconnection Observed between a Summer Monsoon System and a Subtropical Anticyclone. Part I: The Pacific– Japan Pattern." Journal of Climate 23(19): 5085-5108.
Kosaka, Y. and H. Nakamura (2011). "Dominant Mode of Climate Variability, Intermodel Diversity, and Projected Future Changes over the Summertime Western North Pacific Simulated in the CMIP3 Models." Journal of Climate 24(15): 3935-3955.
Kubota, H., et al. (2016). "A 117-year long index of the Pacific-Japan pattern with application to interdecadal variability." International Journal of Climatology 36(4): 1575-1589.
Kwon, M., et al. (2005). "Decadal change in relationship between east Asian and WNP summer monsoons." Geophysical Research Letters 32(16).
Li, Z.-X. (1999). "Ensemble Atmospheric GCM Simulation of Climate Interannual Variability from 1979 to 1994." Journal of Climate 12(4): 986-1001.
Mei, W., et al. (2014). "Variability of Tropical Cyclone Track Density in the North Atlantic: Observations and High-Resolution Simulations." Journal of Climate 27(13): 4797-4814.
Mizuta, R., et al. (2017). "Over 5,000 Years of Ensemble Future Climate Simulations by 60-km Global and 20-km Regional Atmospheric Models." Bulletin of the American
Meteorological Society 98(7): 1383-1398.
Mizuta, R., et al. (2012). "Climate Simulations Using MRI-AGCM3.2 with 20-km Grid." Journal of the Meteorological Society of Japan 90A(0): 233-258.
Nakamura, H. and T. Fukamachi (2004). "Evolution and dynamics of summertime blocking over the Far East and the associated surface Okhotsk high." Quarterly Journal of the Royal Meteorological Society 130(599): 1213-1233.
Nitta, T. (1986). "Long-Term Variations of Cloud Amount in the Western Pacific Region." Journal of the Meteorological Society of Japan. Ser. II 64(3): 373-390.
Nitta, T. (1987). "Convective Activities in the Tropical Western Pacific and Their Impact on the Northern Hemisphere Summer Circulation." Journal of the Meteorological Society of Japan. Ser. II 65(3): 373-390.
Park, J.-Y., et al. (2010). "Decadal changes in two types of the western North Pacific subtropical high in boreal summer associated with Asian summer monsoon/El Niño–Southern Oscillation connections." Journal of Geophysical Research: Atmospheres 115(D21).
Poli, P., et al. (2016). "ERA-20C: An Atmospheric Reanalysis of the Twentieth Century." Journal of Climate 29(11): 4083-4097.
Ronghui, H., et al. (2004). "Recent advances in studies of the interaction between the East Asian winter and summer monsoons and ENSO cycle." Advances in Atmospheric Sciences 21(3): 407-424.
Wakabayashi, S. and R. Kawamura (2004). "Extraction of Major Teleconnection Patterns Possibly Associated with the Anomalous Summer Climate in Japan." 気象集誌. 第2輯
82(6): 1577-1588.
Wang, B., et al. (2001). "Interannual Variability of the Asian Summer Monsoon: Contrasts between the Indian and the Western North Pacific–East Asian Monsoons." Journal of Climate 14(20): 4073-4090.
Wang, B., et al. (2003). "Atmosphere–Warm Ocean Interaction and Its Impacts on Asian– Australian Monsoon Variation." Journal of Climate 16(8): 1195-1211.
Wang, B., et al. (2019). "Historical change of El Niño properties sheds light on future changes of extreme El Niño." Proceedings of the National Academy of Sciences 116(45): 22512.
Xie, S.-P., et al. (2015). "Towards predictive understanding of regional climate change." Nature Climate Change 5(10): 921-930.
Xie, S.-P., et al. (2009). "Indian Ocean Capacitor Effect on Indo–Western Pacific Climate during the Summer following El Niño." Journal of Climate 22(3): 730-747.
Xie, S.-P., et al. (2016). "Indo-western Pacific ocean capacitor and coherent climate anomalies in post-ENSO summer: A review." Advances in Atmospheric Sciences 33(4): 411-432.
Yang, L., et al. (2012). "An interdecadal change of tropical cyclone activity in the South China Sea in the early 1990s." Chinese Journal of Oceanology and Limnology 30(6): 953-959.
Yim, S.-Y., et al. (2008). "Decadal change in the relationship between east Asian–western North Pacific summer monsoons and ENSO in the mid-1990s." Geophysical Research Letters 35(20).
Yoon, J. and S.-W. Yeh (2010). "Influence of the Pacific Decadal Oscillation on the Relationship between El Niño and the Northeast Asian Summer Monsoon." Journal of Climate 23(17): 4525-4537.