Vertical distribution in Calanus finmarchicus
36
0
0
Full text
(2) 576. A. C. GARDINER.. The collections made on May 24th were enumerated at sea and for that reason have not been included. DESCRIPTION. OF METHODS.. Although the instruments are fitted with diving planes these were found to be too small under the conditions of use, and depths of more than 10, fathoms could not b~ attained. On this account the three instruments. 4'. 3'. ;-. I'. 2°. 0'. I' '-" ". ,. ~'. ,I V. I. ,. l",-". 30'. '30'. 56". 56"1. 30. 50'. .:xxm /.. / ,/. 55. ./ I. "(-'";;::"",,,,,,155". Ii. 30'. 30' "". ", '.,':. ./. i.-.. 2°. 54.('. FIG. I.-Position. 1st Day. 3rd Day. 5th Day.. Stations Stations Stations. 1-9. 19-24. 35-41.. 0 0. r. I". 54" 2". of Stations. 2nd Day. 4th Day.. Stations Stations. 10-18. 25-34.. indicates Stations 22a-g. indicates Stations 23-34.. were made fast to one main warp, to the bottom end of which was attached a "kite." It is not proposed to give the actual calibrations of the. apparatus, since the original kite has now been replaced by the more efficient" submarine sentry" (see Wharton and Field, 1920, pp. 406-408). The approximate depth at which each of the three jnstruments fished was estimated beforehand by measuring the angle taken up by the wire.
(3) VERTICAL. DISTRIBUTION. IN. CALANUS.. 577. as successive lengths, each of 10 fathoms, were run out. On the assumption that this angle remains constant for each length, no matter whether the particular stretch is near the surface or at a greater depth, it is a simple matter to draw the curve of the whole length, and so be able to gauge the depth at any point when the total length out is known. The estimated depths were checked against readings of a "Kelvin Tube" attached to the kite. The greatest depth reached was 37t fathoms which was sufficient for the greater part of the area visited. Each haul was of 20 minutes duration, which at the speed of towing meant that the hauls were about 1 mile in length. As a rule the vessel steamed for 9 miles between stations, on the completion of which distance the apparatus was lowered and towed at slow speed for 1 mile. The speed of towing was controlled by counting engine revolutions. Except at certain stations mentioned in Appendix A, p. 597, all hauls were made in daylight between the hours of 0600 and 1800 G.M.T. (Sunrise and sunset are approximately 0356 and 1958 at this period of the year.) The silk discs used in the instrument for retaining the catch were of No. 30 silk, having, when new, 30 threads to the inch. This silk shrinks only slightly after use, and the average size of the opening in old silk is 0.7 X0.7 mm. CRITICISM OF THE METHOD.. The idea of fishing a number of nets at different levels on the same wire is, of course, by no means new. So far as I am aware, however, this is the first occasion on which use has been made of a number of these" Hardy" instruments to obtain collections of plankton which it is desired to treat quantitatively. On this account it will be necessary to discuss the advantages of the method and to lay stress upon possible sources of error. Perhaps the chief advantage of the method is that it enables different levels to be sampled at one and the same time. In the present experiment three instruments were used simultaneously at near the surface, mid-water and near the bottom, but there is no practical reason why four or more could not be used. On this account, then, the method has much to recommend it since in those cases where either a series of horizontal hauls or vertical" stage catches ,,* are made there must inevitably be a considerable interval of time between the first and last collections of a series. Russell (VI, 1928, p. 81), for instance, in his studies on the vertical distribution of marine macroplankton, found that the time taken to sample the six different depths comprising his first series was nearly two hours. As he points out, there is " sufficient time for the vertical distribution of the plankton to become considerably altered." There is, too, risk of the population changing (Russell, I, 1925, * i.e. The hauling of a vertical net up through selected distances of an entire water column..
(4) 578. A. C. GARDINER.. p. 777), due either to the time interval or to the fact that the samples are taken from a number of different bodies of water. The observations given by Gardiner (1931, pp. 451-452) demonstrate clearly how great this risk is. The chief sources of error in the present experiments are due to the bottom and .mid-water samplers being hauled to the surface unclosed. In the first place, of course, since both continue fishing right up to the surface the resulting samples will contain a certain proportion of individuals from the upper levels. The error will be greatest when the organisms are abundant in the upper waters and scarce in the lower layers. In the second place, the mid-water and bottom hauls are actually longer both in point of distance and time than the corresponding surface haul. These two sources of error apply no less to the use of the ring-trawl, and the question is discussed by Russell (V, 1927, pp. 558-561). In his case the length of the haul was only 10 minutes, so that the addition of 2t minutes (the time taken to raise the net from the deepest layer sampled to the surface) is a matter needing consideration. In the present case the length of haul was 20 minutes, so that, although the time taken to get the lowest sampler to the surface was about 2 minutes, the magnitude of the error is only half as great. I have no means of arriving at the significance of these errors, but I have little doubt from the following that it is not great. In series 22a to 22g, for instance, hauls were made in the manner shown in the accompanying text-figure. The traverses c, f, and g were longer than were a, b, d, and e, the former taking 28 minutes to complete, the latter 20 minutes. The whole area sampled was approximately 2 square miles. One would not expect marked differences in density of population in so small an area, nor in the course of the 3t hours taken to complete the collections would one expect any considerable change in the vertical distribution to have taken place. If, now, the catches in the longer hauls c, f, and g, were all bigger than those in the four l'emaining shorter hauls, a, b, d, and e, there would be reason to suppose that towing the bottom sampler for two minutes more than the surface one, as was done each time in the routine collections, would probably have resulted in the catches at the bottom being too big by a relatively constant amount. It is clear from the following table that the longer hauls are not the bigger. Haul.. a. No. of Calanus 362 (all three depth,s). b. c. d. e. 217. 351. 490. 213. g. 143. 184.
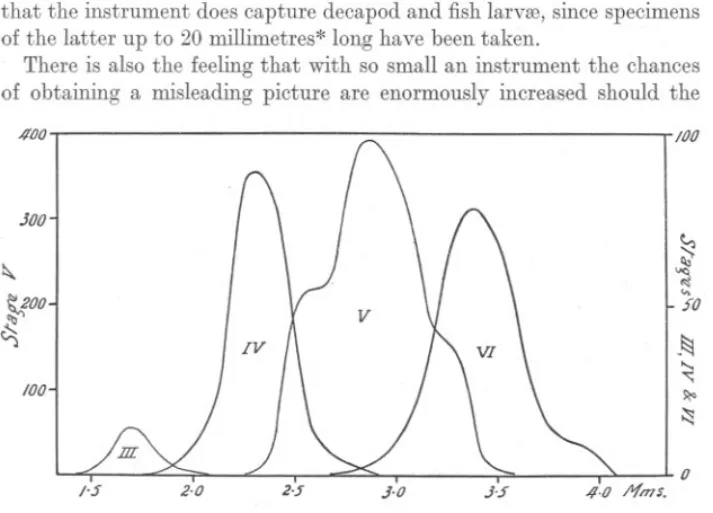
(5) VERTICAL. DISTRIBUTION. IN. 579. CALANUS.. Any differences due to increased length of tow, which there might have been, have been masked by irregularities in the horizontal distribution, and I am fairly confident that this will usually be so. The chief disadvantage of an instrument of the type used probably lies in the small size of the mouth, the diameter of which is only 3.8 centimetres, and the number of individuals captured even in a twenty-minute haul may be very small. Also it is impossible to rid oneself of the impression that a considerable proportion of the larger and more active animals will escape capture. Against this there is abundant evidence that the instrument does capture decapod and fish larvffi, since specimens of the latter up to 20 millimetres* long have been taken. There is also the feeling that with so small an instrument the chances of obtaining a misleading picture are enormously increased should the /100. 100. JOO. ~. ~. ~. .... so. ~oo ~. V). -~. ..... ~ ~. 100. ~ 0 1'5. 2.0. 2.5. FIG. 2.-Length.frequency. .1.0. )'5. /1.0 I'fm$.. distribution of Calanus in Stages III-VI.. animals be irregularly distributed, or worse still, should they be in " swarms." All things considered, however, I am of the opinion that the advantages outweigh the disadvantages. It would undoubtedly be better to sample more than three levels, and this presents no difficulties. It is possible, too, that a more representative catch would result from a sampler of the same type with a larger mouth. MATERIAL.. In working out the collections, the different developmental stages of Calanus were recognised and enumerated separately. The nomenclature adopted is that given by Lebour (1916). In addition, the length of all * This was a lemon sale. NEW. SERIES.-VOL.. XVIII.. No.2.. JANUARY, 1933.. K.
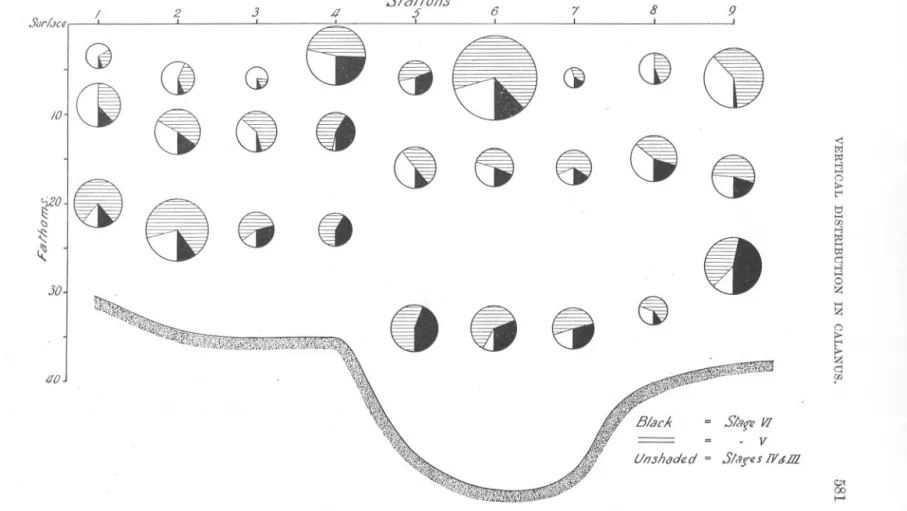
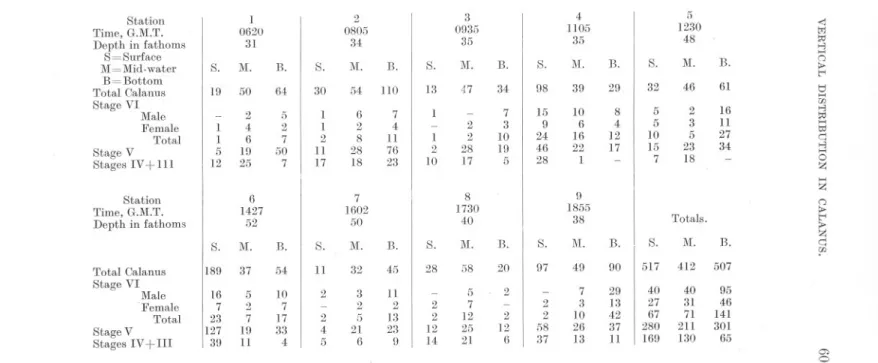
(6) 580. A. C. GARDINER.. specimens in Stage V was determined, as well as that of a sufficient number in Stages IV and VI to give reliable modal lengths. So large a mesh as the No. 30 silk used allows practically all the smaller species; such as Temora longicornis and Pseudocalanus elongatus, as well as the bulk of the younger Calanus finmarchicus to escape. It retains, however, almost all individuals of Calanus in Stage IV and, of course, the older specimens. The actual sizes retained by the mesh are shown in Figure 2, where the length-frequency distribution of Stages III-VI is. gIven. The population sampled by the gear during the period covered by thE} experiment comprised 19% in Stage VI, 49% in Stage V, and 32% in Stages IV and III. The numbers in Stage III were extremely small, and throughout the present paper have been included with those of Stage IV. As will be seen later, the percentage composition of the population in respect to age classes varied'considerably from day to day. VERTICAL DISTRIBUTION. Full data are given in Tables IV-VII, pp. 603-606. An attempt has: .been made to present them graphically in Figures 3-6. In these figures the areas of the circles are proportional to the total number of individuals taken at each level. Each circle will be seen to be subdivided into, usually, three sectors, the areas of which are proportional to the numbt;rs of individuals in Stages VI (c3'+Sj2), V, and IV and III, respectively. These sectors are differently shaded, black representing Stage VI, cross-hatching Stage V and unshaded representing Stages IV and III. (As pointed out above, the number in Stage III retained by the mesh was very small.) The calculated depth at which each collection was made can be read off from the scale of depths on the left-hand side of the figures. Soundings at each station have been indicated by the curved line at the base of the figures. (This does not, of course, represent the actual depth contours, the vertical scale being enormously exaggerated at the expense of the horizontal.) Where the number of individuals in any collection was less than 2, the observation has been recorded as a small black circle. Reference to Figure 1 will give the distances between individual stations. Save on the third day (May 23rd), Figure 5, when seven hauls were made in quick succession (Stations 22a-g, see p. 578), stations were usually about 10 miles apart. It is important not to lose sight of this since the differences in vertical distribution, which are so immediately apparent, may result equally from the collections having been made at considerable distances from one another with, it might be, differences in thermal stratification, as from changes in the amount of light. In addition to this graphical mode of expression, the data have been.
(7) Sur/au. /0. z. 3. ~. (). GI. ()~Ct. r0. ~. /. 1. 8. 8. 8. 4. Ct. Slat/on.s 5'. 6. 88. G(jCt. .. '7. 8. 9 ,. I. Ci C). (J. 8 Cj (:t. 30. 8&8. Ci. ". <: t;j. I;tI §2. t"' I:! ..... 00. q. z. §2. 'f'?i.th. 40. =. =. e. q rn. St8ftl VI. . V. UI7.Jhadfld = stl/fllS /V&lll 01 00 I-". FIG. 3.-Vertical. distribution of Calanus at Stations 1 to !J (1st Day, May 21st)..
(8) 582. A. C. GARDINER.. summarised in Figure 7. The method adopted was to calculate the "centre of gravity" of distribution of each age class at each station. For instance, suppose the distribution to be as follows :-10 individuals at 5 fathoms, 20 at 15 fathoms, and 50 at 30 fathoms, we should then probably be entitled to say, even from three collections, that the individuals favoured the deeper water, and to determine the mean depth at which the main mass of the individuals occurred. In the case quoted this would be at about 23 fathoms. The limitations of the method, however, must be clearly understood, particularly in those cases where the numbers of individuals occurring in the surface, mid-water, and bottom collections do not show such good continuity. In other words, should l~rge numbers of individuals be found in both surface and bottom collections whilst the mid-water one was small, the" centre of gravity," as calculated, would lie at a depth roughly half-way between the surface and bottom where, clearly, the results indicate that the greatest concentration has not occurred. For the primary purpose for which it is proposed to use the data, namely, the study of changes in vertical distribution of the species from place to place, or day to day, the detailed diagrams, Figures 3-6, will undoubtedly provide a more accurate picture. For the secondary purpose of determining the relative abundance of individuals of different age occurring at the depths sampled at each station, the determination of the" centre of gravity," Figure 7, greatly facilitates the interpretation of the results and is almost certainly sound. Here, clearly, we are not concerned so much to find the actual depth at which the majority of the individuals lived, as to see in the samples, no matter at what particular depth they were collected, whether one age class lived above or below another. Day 1, May 21st. Stations 1 to 9. Figure 3. Table IV. This series of stations was worked on a line roughly parallel to the coast, extending from off Whitby to off Berwick. The day was one of bright sunshine, with a light E.N.E. breeze, force 1 on the Beaufort Scale. The composition of the population sampled was as follows :Age Class... VI V IV. + III Total. Number.. 279 792 364 1435. Percentage.. 19.4% 55,2% 25.4%. 100.0. Considering, in the first place, all four age classes together, there is very little consistency in the vertical distribution of the species on this day. At Stations 1 and 2 the biggest catches were in the bottom collections. At.
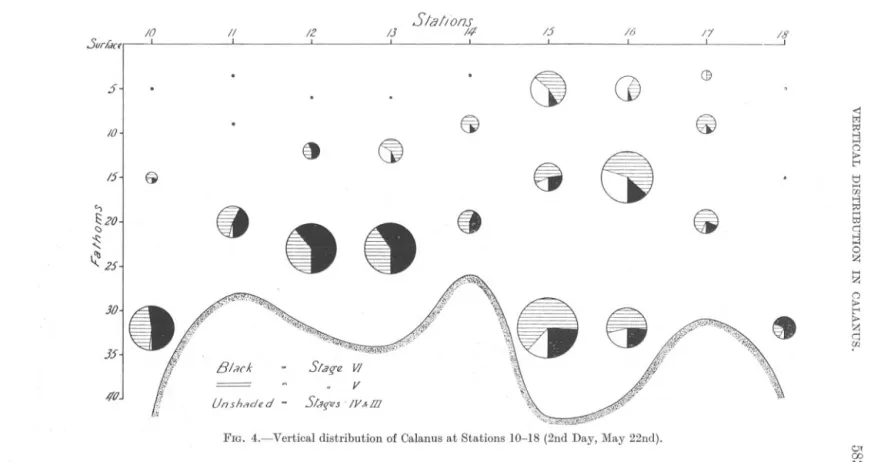
(9) 10I .5url.Kfl. .?-1. II. 12. I. IJI. I. SIal/om. 14. 15. 16. I. I. I. .. .. Ct. (]. /1I. 18 ----I. , <: l;;j i;I:j. IO. .8. 15-1. '\\. 1.0:2Uj 25. J5-1. if. BlnrK. 417J. ..... a > t"' ...,. Lf. Unshaded. n -. FIG. 4.-Vertical. 8. Ci. 8 -. .. t1 ...... 00 ..., i;I:j ...... t:d q ..., .... 0 Z. .. ...... Z. a > t"' > Z q 00. Slaq-eW ". v. SIJ;-uS '/v""m distribution of Calanus at Stations 10-18 (2nd Day, May 22nd).. Ot 00.
(10) 584. A. C. GARDINER.. Stations 4 and 6, however, surface catches greatly exceeded those at the other two depths. Stations 5, 7, and 8, on the other hand, yielded only very small surface catches, whilst at Station 9 the numbers in surface and bottom hauls were approximately equal. As far as the behaviour of the individual age classes is concerned, inspection of Figures 3 and 7 shows that, on the whole, Stages IV and III were most abundant in the upper waters. Stage VI, on the other hand, seemed to find its optimum conditions below 10 fathoms, for in only two cases, Stations 4 and 6, did the surface collections yield the biggest catches. The" centres of gravity" of distribution of Stage V lie usually between those of Stage VI and Stages IV + III. On the whole Stage V seems to find its optimum nearer that of Stage VI than that of the younger individuals. Day 2, May 22nd. Stations 10 to 18. Figure 4. Table V. Leaving Station 9, of the previous evening, a line of stations was run in a northerly direction as far as 56° 19' N. Here the ship was turned and a southerly line run, crossing the northern line between Stations 9 and 10. The line ended off Coquet Island. The day was one of heavy cloud with some rain. Wind was mainly E.N.E. and stronger, force 2-3 on the Beaufort Scale. The composition of the population sampled was as follows :Age Class.. Number.. Percentage.. VI V IV + III. 206 319 84. 33.8% 52.4% 13.8% ---. 609. 100,0. Total. This day differed from the preceding one not only in that the total number of individuals captured was less than half, but also in that the percentage of adults had increased from 19% to 34%, almost entirely at the expense of the younger individuals, Stages IV + III. The vertical distribution of the species as a whole, too, differed very markedly from that of the preceding day. In only one case, Station 15, did the number of individuals taken in the surface catches exceed 30, while on two occasions none was taken, and on four only a single specimen occurred. Similarly, with one exception (Station 16) the mid-water collections were well below the average. At the first five Stations (10-14) and at the last two (17 and 18), young individuals (Stages IV +III) were virtually absent. At the two remaining.
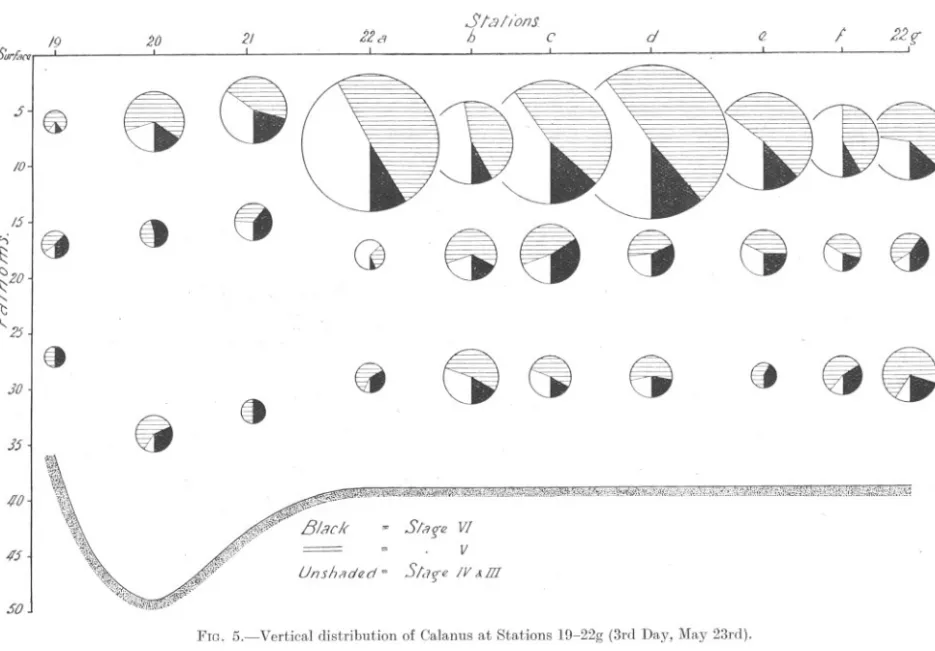
(11) /9 .5Urf.w. .J. I /0. @. !2. I. Slal/onJ h. ita. 2/. C. d. 1.22. I. 8. .. /5. '-i. 20 ,. <: t<J ~ >-'J H. 8. 0. 88. f;)20. ei. Ct8. It l.( 2.5, 30. 15. I. !!. > r< tj. H W >-'J ~ H t::I c:: >-'J. @. Ct~. fj. ~. @t. ~. 8. 88. 8 z H. Z 0. > r< >. Z c:: w. 40. .,,;i,,~,~.'!(j;W"-"'~~"~I>""1"'\"j2';)\:Y."'i"'>;,:'4;'"~"',1;;g,;;Q:"~'I',<.<;;;;\';!~~.)~iW'ii";i~V."~if:~o;;p,.:;:;(\'i't.1"i,",nI;"\'I1J:!;s(,V::K;!,\'fig1~)!.'f,;C;~tiN;\',,;. ~. -. 45. Slng'fl VI. =. Unsh/ldC'd. =. V S/(Iffl. IV &m Of CXJ Of. 50 FIG. 5.-Vertical. distribution. of Calanus. at Stations. l(J-22g (3rd Day, May 23rd)..
(12) 586. A. C. GARDINER.. Stations, 15 and 16, small numbers occurred in the collections at all three depths. The older individuals (Stages V and VI) showed a decided preference for the lower levels. As before, the" centres of gravity" of Stage V were slightly above those of Stage VI. This day differed so markedly from the preceding one, and indeed from the two following, that it would be unwise to draw any hard-and-fast conclusions from these isolated observations. It is impossible, however, to ignore the inference that the absence of individuals in Stages IV and III has been very largely responsible for the small surface catches. Why, at the same time, adults and those individuals in Stage V have not occurred in the upper levels where there is abundant evidence from the other days that they may be present in large numbers, it is impossible to say. Conditions of illumination on this day were such that, a priori, one would have expected the surface catches to have been the biggest. It is possible, of course, that a quite superficial haul might have resulted in large catches, although the evidence from Stations 14 and 17, at which the surface hauls were taken at a depth of about 3t fathoms below the surface, would seem to suggest that this was unlikely. It is a disturbing thought, that in the course of quite a few miles it is possible to pass to an area where the composition of the population could show such marked differences. Day 3, May 23rd. Stations 19 to 22g. Figure 5. Table VI. Fog near the coast prevented the southerly line being continued, and a line of three stations was run in an easterly direction, after which a series of 7 Stations (22a-22g) were worked in the manner described on page 578. All seven of these stations were completed within a period of 3t hours and represent an attempt to obtain a measure of the uniformity of horizontal distribution. The day was one of light cloud and fine haze, but with frequent sunny periods. Wind was S.E. and light, force 2 on the Beaufort Scale. The composition of the population sampled was as follows :Age Class.. VI V IV + III Total. Number.. 345 1097 758 2200. Percentage.. 15.7% 49.9% 34.4%. 100,0. The vertical distribution on this day was on the whole remarkably consistent. At all save the first station the surface collections greatly exceeded those from the other levels..
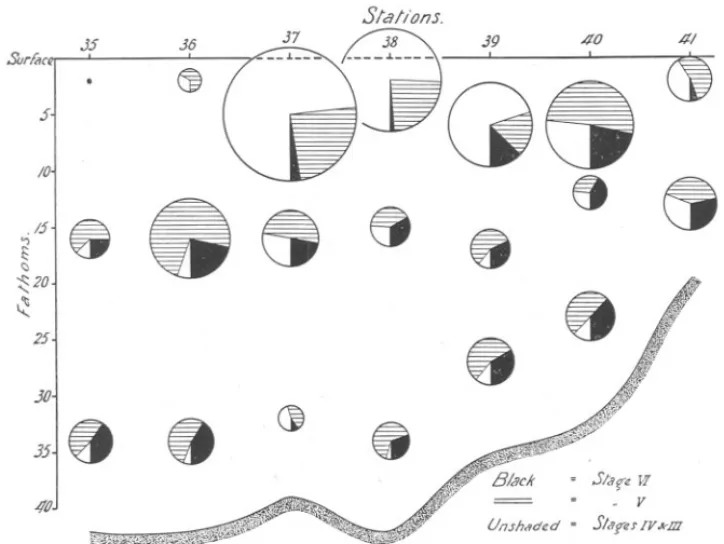
(13) -~. VERTICAL. DISTRIBUTION. 587. IN CALANUS.. In the case of all age classes, the numbers occurring hauls were the largest. The figures are as follows :-. in the surface. Mid-water+ SurfaceHauls. Bottom Hauls.. Number of. 154 290 115. 191 807 643. Stage VI " V " IV +III. In this respect this day contrasts sharply not only with the preceding one, but also with the first day, where it will be recalled the biggest numbers. J5. Surfan. 37. .36. 4/. ~. ~. j.. ./5. '1. <:>. 20. -. -. /0,.. 8. Ct 8. ". 25. 30. 358 4'tlJ. .. 8. " (). distribution. 8. G Un.shaded. FIG. 6.-Vertical. CI. \J. of Calanus at Stations. = S/a!{€ W. =. .,. V. = Slarn IV kID. 35-41 (5th Day, May 25th).. of Stage VI, with only two exceptions, did not occur in the surface collections. Despite this, the several age classes can be distinguished in respect of their depth preferences, where these are determined by means of the " centre of gravity." Reference to Figure 7 shows that, in every case, the mean depth at which the main mass of adults (Stage VI) occurred was the lowest, and that of Stages IV + III usually well above. The" centres of gravity" of individuals in Stage V lie about midway between those of the two other classes. It is interesting to note that in this area the percentage of Stages IV + III.
(14) 588. A. C. GARDINER.. was more than double that in the area covered on the preceding day. The total number of individuals in all classes was the highest recorded on this voyage. Day 5, May 25th. Stations 35 to 41. Figure 6., Table VII. This line of stations was run in a roughly diagonal direction from the S.E. corner of the N.E. bank to the coast off the River Tyne. The day was one of frequent sunny periods. Stations 38 arid 40 were worked in bright sunlight, whilst at Station 39 the sun was obscured by cloud. \Vind was variable from a S.E. or S.W. direction, force 2-3 on the Beaufort Scale. The composition of the population sampled was as follows ;Age Class.. VI V IV + III Total. Number.. Percentage.. 201 498 564. 15.9% 39.4% 44.7%. 1263. 100.0. Ignoring for the moment the last station, which was taken in quite shallow water near the coast, and considering the preceding four, one sees a type of vertical distribution very similar to that given by Stations 22a-g (Day 3). The first two stations, however, 35 and 36, gave only very few specimens in the surface hauls. At Stations 37, 38, and 39, young individuals (Stages IV +III) are both relatively and absolutely very numerous, and on the whole this age class shows once more a decided preference for the upper levels. The" centres of gravity" of Stages V and VI are, with two exceptions, in accordance with what we have been led to expect from a study of the results of the other three days. A more detailed study of Figure 7 reveals a very high degree of consistency in the behaviour of the youngest class of individuals (Stages IV +III). On no occasion was the" centre of gravity" of distribution found to lie below that of Stage VI, and on only one occasion was it low(,f than that of Stage V, namely at Station 11. The" centre of gravity" of Stage V was usually found to be intermediate between that of Stages VI and Stages IV + III. There were five exceptions to this (i.e. 14%), viz. at Stations 1, 2, 8, 39, and 41. It would seem, then, that towards the end of May the different stages show decided depth preferences, those in Stages IV +III living, usually, well above the two older classes, and Stage V living at a depth intermediate between Stages IV and VI..
(15) VERTICAL. THE. RELATIONSHIP. DISTRIBUTION. BETWEEN. LENGTH. IN. 589. CALANUS.. AND. VERTICAL. DISTRIBUTION.. The preceding pages may besummarised very briefly as follows: On the whole, individuals in Stages IV + III favoured the surface waters. Those in Stages V and VI showed no such preference, being sometimes more numerous in the surface collections, but at other stations occurring in greatest numbers at either of the other two levels. However, the mean depth (the" centre of gravity") at which the main mass of individuals /. Z. ~. 4. ~. 6. 7. .5/a. /1 017.Y.. 9. m. G. fi. a. 0. M g. ~. ~. ~. (). (). Day I. Day 2. /0. //J. !:2 <::J Zo. 2t'. ~. ~. ~. ~ ~ <::>. JQ~ .c.,. JO. ,(Ill. .1/0. 50. '50. 19 20 2/. 0. 22<16. cd". I" 22". Day 3. JJ. ~o. Jr. J8. JI). 4Q 4/. 0. Day 5. /"--". /0. ~ x,. )(/ . .. <-i 2fJ !:: <::J. ", 'x/. ,x-' ' .. /0. x 'x . .. 2fJ~. ~ <::J. ~. ~. JfJ.<-,. ~JfJ //0. -I/O. -" 0X. J'1"I~(l VI. V. x 1I!'q$ .tV &Dr 0.5/. .50. FIG. 7.-". ~O. Centres of Gravity". of distribution of Calanus in Stages VI, V and in IV + III..
(16) 590. A. C. GARDINER.. in the age classes recognised occurred, showed that the three classes exhibited a fairly clearly defined depth preference. As the material was sorted, the impression was gained that the individuals in Stage V were larger in size in the bottom than in the surface collections. It seemed, too, as if specimens of this age group in the midwater samples occupied an intermediate position as regards length. The same thing was noticed in the adults. In their case, however, the numbers were never very large and it was thought better to restrict a detailed examination to Stage V. In all, 1443 Calanus in this Stage were measured, 483 from the surface collections, 409 from mid-water, and 551 from the bottom collections. There was, of course, no selection. These measurements are set out in Table I.. TABLE 1. MEAN LENGTHS (IN MM.) OF CALANUS IN STAGE V IN SURFACE, MID-WATER, AND BOTTOM COLLECTIONS. Station. 1 2 3 4 5 6 7 8 9 10 11 12 13 14 15 16 17 18 19 20 21 22a b c d e f g 35 36 37 38 39 40 41 General Average (mm.) Number measured. Surface. mm. 2.67 2.87 2.37 2.96 2,92 2.77 2.52 2.51 2.55 2.73 2.51 2.85 2.87 2.85 2.96 2.77 2.81 2.86 2.81 2.78 2.89 2.82 2.79 2.91 2.67 2.85 2.74 2.76 48.3. Mid-water. mm. 2.85 2.91 2.92 2.81 2.82 2.65 2.76 2.67 2.53 3.03 2.89 2.71 2.80 2.83 2.60 2.83 2.87 2.78 2.83 2.88 2.97 2.91 2.91 2.90 2.86 2.85 2.70 2.92 2.81 2.78 2.85. Bottom. mm. 3.00 2.96 3.04 3.11 3.16 2.88 2.78 2.77 2.80 2.96 2.92 3.12 3-11 2.79 2.77 2.84 2.97 3,07 2.69 3.06 2.99 3,06 3,03 2.86 3,05 2.81 2.96 3.01 2.94 2.88 2.84 3.02 2.93 2.84 2.93. 2.82 409. 2.94 551. -.
(17) VERTICAL. DISTRIBUTION. IN. CALANUS.. 591. The mean lengths of individuals in the surface, mid-water, and bottom collections were found to be 2.76, 2.82, and 2.94 millimetres respectively. Taken by itself this is not, perhaps, very impressive since the differences in mean length are so small, especially when it is recalled that the length of the class as a whole ranged from under 2.5 mm. to 3.5 mm. (vide Figure 2). It must be remembered, however, that the figures quoted above are mean lengths. In addition to this it will be seen in Table I that the mean lengths of individuals in surface hauls are less than those of the corresponding bottom hauls in twenty-four cases out of twenty-seven in which this comparison is possible. A definitely ascending order of mean length from surface, through mid-water to bottom is shown in ten cases. Further work is needed to show whether the latter condition is generally to be expected. At the moment it is perhaps nothing more than an interesting possibility. DISOUSSION. It has been shown that the depth at which Oalanus of different ages may be found from day to day is subject, particularly in the older individuals, to considerable variation. The youngest classes studied (Stages IV and III) have undoubtedly tended to find their daytime optimum above 10 fathoms. The exceptions to this have been but few. The adults (Stage VI), on the other hand, have shown far less consistency, and from a study of their behaviour extending over four days in May, it has not been possible to determine the optimum level. Stage V would seem to have behaved in a manner more closely allied to that of the adults than to that of the younger classes. (Vide infra where some of Russell's data are examined.) , It is not possible to say how far the differences in vertical distribution from day to day were due to the prevailing meteorological conditions, and how far to the fact that the collections were made over a wide area. Russell's hypothesis of optimum illumination (Russell, 1927, p. 247, et seq.)would have led one to expect that on the cloudy day the older individuals, at any rate, should have been nearer to the surface. It would seem, however, that in the present case the reverse has occurred. Russell himself (Russell, VII, 1928, p. 447) says that" the rise towards the surface was evident on sunny days as well as dull, indicating that the suggestion that dull weather and low light intensity was its cause in 1925" (vide Russell, IV, 1926,p. 427)"may possibly have been incorrect." One must bear in mind the possibility that the position at which the majority of individuals occurred in the early hours of the day and again towards evening, where this differs from that at the other hours of the same day, may have been influenced by diurnal migrations. The first station of each day was made shortly after 6 a.m. and with sunrise at 4 a.m..
(18) 592. A. C. GARDINER. ~I ~,. ~I. ~, ~. ~. ~, ~. ~I. :::::J. J:[::: '. "~:::,.. .. F=I. '. ~. D-'~. -01 ~~. ~. collections, it would appear that ..s the" centre of gravity" of dis~ tribution of Stages IV + III, of ~ Stage V, and of Stage VI is, with >. few exceptions, in the order in which. ~~. ~c f I. I I. =:.. ~. I. ... .. 1!. ~. the Stages are here written down.. The data from which this has been derived are shown graphically in ~. Figure 7. § Finally, there is the suggestion on ~ pp. 590-591 that for Stage V, the ~ only one ~o far examined in this. ~ connexion, the greater the length of the individual the lower down in. ~:~. ~. ~~ -l~. ~. ~:. ~. ~k::. "0. ~V ~. ~. ~. .~. I. ~. ). I. I. ~k> kG==J I I. I. I. ~. ~. ~ ~ ~ ~ ~ ~. I. I. ~ ~. I. I. I:iJJf'lJW. I. ,. ~ ~. the water it will be found. This study of the behaviour of Calanus of different age has shown once more (vide Farran, 1911, p. 84; Southern and Gardiner, 1926, p. 323,. and 1932; Russell, 1927, p. 239; Russell, X, 1931, p. 394; Worthington, 1931, p. 406; etc.) the imc5 portance of the onto genetical state ~ of the individual in relation to its. vertical distribution. Russell, who has made such a close study of the vertical distribution of Calanus has restricted himself almost entirely to the use of the ring-trawl, the bag of which is made of stramin. >. l. ... !. ". it is possible that, at this time, the animals might not yet have finished moving either up or down from the position adopted during the hours. of darkness. The results of a single night's observations on the diurnal migrations of individuals of different . age are given in Appendix A and ~ should be studied in this connexion. ~ As regards the position taken up ! by day by specimens of different age in one and the same series of P. surface, mid-water and bottom.
(19) VERTICAL. DISTRIBUTION. IN CALANUS.. 593. with 16 threads to the inch. The population sampled by this large mesh is composed mainly of fully grown specimens, and Russell's. findings are thus almost entirely restricted to adults. On occasions, however, this net has captured individuals in Stage V in considerable quantity (vide Russell, VII, 1928, p. 446), but as he says, loco cit., he has" not attempted to express diagrammatically their vertical distribution" since it is obvious that" the stramin ring-trawl cannot be regarded as an efficient instrument for the capture of these last copepodid stages. . ." With this I find myself in only partial agreement. Admittedly selection by the net will have restricted the population sampled, but if this be realised, the data are perhaps all the more valuable since, by reason of net-selection, they relate to a class of individuals more uniform in size than mine. Figure 8, which represents diagrammatically the vertical distribution of, presumably, only the larger specimens in Stage V, has. been drawn up from the data given by Russell (VII, 1928, Table VII, p.454). The depths at which the collections were made were taken from the same paper, Table I, p. 449. If this figure be compared with Russell's. Figure 1, p. 430, it will be seen that the vertical distribution of Stage V in Figure 8 is more akin to that of the females than to that of the males. The males, it will be remembered, live lower down than the females, vide Russell, lococit., p. 447. It would not appear, however, that in his. findings, as in mine, the optimum level in Stage V is above that of the adults. To what extent, if indeed at all, this is due to the fact that my observations on Russell"s data refer only to the behaviour of the larger Stage V individuals owing to the selective action of the big mesh, it is. impossible to say. The study of the daytime vertical distribution of Calanus at different. seasons of the year enabled Russell (VII, p. 4(6) to state" that there is a gradual descent of the region of maximum abundance from about 10 metres in April to 20 metres in June, with a definite rise towards the surface in July, August, and September. (This rise is already apparent early in July.) A seasonal variation in the median length of all classes of individuals measured was observed by the same worker who noted (loc. cit., p. (47) "a brood of small adults occurring in July, August, and September, as opposed to a brood of large adults which dominated in the spring." If Russell's measurements for Stage V (Table V, p. 453) are plotted, the curve obtained resembles that of the males and females given on p. 442, Figure 6B, in that this class, too, shows a decrease in median length after the beginning of June. From a consideration of the data, Russell makes the suggestion that the broods are physiologically different, the small type preferring a higher light intensity than the large type. My results would certainly seem to lend support to such a view. Not.
(20) 594. A. C. GARDINER.. only do the adults live lower down than the younger classes, but also in Stage V the mean length of individuals is greatest in the bottom hauls. In this connexion, however, it must be clearly understood that I do not believe that individuals of length n millimetres will find their optimum at m fathoms, whilst those of (n+n') millimetres will be found at (m+m') fathoms, where m and (m+m') are relatively constant for the particular season of the year. I think it to be nearer the truth to suppose that if for some reasons at present not understood, the bulk of the individuals of those classes so far investigated, be found at a certain depth, then the main mass of the largest specimens will be deeper and that of the smaller individuals will be at a lesser depth. The causes which prompt the animals to mass at any particular level on a given day are, in my opinion, not yet determined, and I cannot help but think that Russell himself would agree with this (Russell, VII, 1928, p. 447, item 2 of the Summary). Light intensity alone would certainly not seem to be the full explanation. Moreover, the rise towards the surface in July, August, and September, when the smaller broods predominate, would seem to be referable to at least two factors, size and diminishing light intensity, but which is the more potent it is not yet possible to say. It must be rememberedthat my data, with one exception (videp. 596), refer to observations extending over a considerable area. Russell's, on the other hand, deal with observations in the same area, but, for the most part, are derived from not more than one observation on anyone day (excluding, of course, those experiments on di~rnal migration). Moreover, the interval of time separating Russell's consecutive observations, was usually one of several days, and frequently much more. In any further work of this kind I should attempt to repeat my observations much in the manner described here, but with the important difference that I should deal as far as possible with the same body of water. In conclusion, it would appear that there are likely to be considerable differences in the depth at which the older individuals may be found from day to day. Furthermore, it is not possible, from the intensity of illumination, to predict the level at which the concentration will occur. It follows from this that should attempts be made to relate the abundance of herring with, inter alia, that of Calanus, the greatest caution will have to be exercised in the interpretation of results, especially if only one sampler is employed..
(21) VERTICAL. DISTRIBUTION. IN CALANUS.. APPENDIX. A.. 595. DIURNALMIGRATION IN Oalanus finmarchicus. The diurnal migrations of Oalanus finmarchicus in the waters off Plymouth have been studied in detail by Russell (1925, p. 793; VI, 1928, p. 89). This worker used the stramin ringctrawl, the meshes of which retain only the larger individuals, and it is probably safe to assume that his findings are based to a large extent on the behaviour of adults. It will be recalled that he believes the course of the migration to be as follows: (1927,p. 237) " . . . there is a movementtowards the surface as the light fails, but at night when the lowest intensity has faded away and the directional stimulus is removed, the animals become free to go where they will and become evenly distributed from top to bottom. As the light increases the following day those near the surface mass around the optimum intensity as soon as it arrives and follow it downwards, ever increasing their numbers by recruits from deeper layers who gradually come into the sphere of influence of the light or have been prevented from reaching the optimum on account of slow movement." In a more recent paper (XI, 1931, pp. 768-771), where the behaviour of a considerable number of planktonic animals is compared in different years, Russell makes the following statements: "After careful study of the available data it is evident that whatever be the physical and chemical conditions of the environment that control the behaviour of the animals and provide the necessary stimuli, there are two factors inherent in the animals themselves which are largely responsible for the types of distribution shown by any species during the night, namely :1. The depth at which the animal has been living during the previous daylight. 2. The speed at which the animal is capable of swimming upwards." On p. 770 Russell, having recorded that" more of the deep-living animals reached the layers up to the surface in the nights in June, 1925, than they did on either of the nights in July, 1924, or June, 1926," goes on to say that" it seems possible that owing to the scarcity of plankton animals on the nights in 1925 their passage upwards was less impeded by obstructing animals. The presence of other animals in large numbers must in itself cause modification of the behaviour to be expected of an animal in perfectly uninhabited water." Such a condition, however, can rarely be encountered. He concludes with these words: "Both avoiding reactions and feeding reactions must tend to divert an animal from its pure responses to physical and. chemical environmental stimuli." It is by no means clear what is intended by these observations, and NEW. SERIES.-VOL.. XVIII.. No.2.. JANUARY,. 1933.. L.
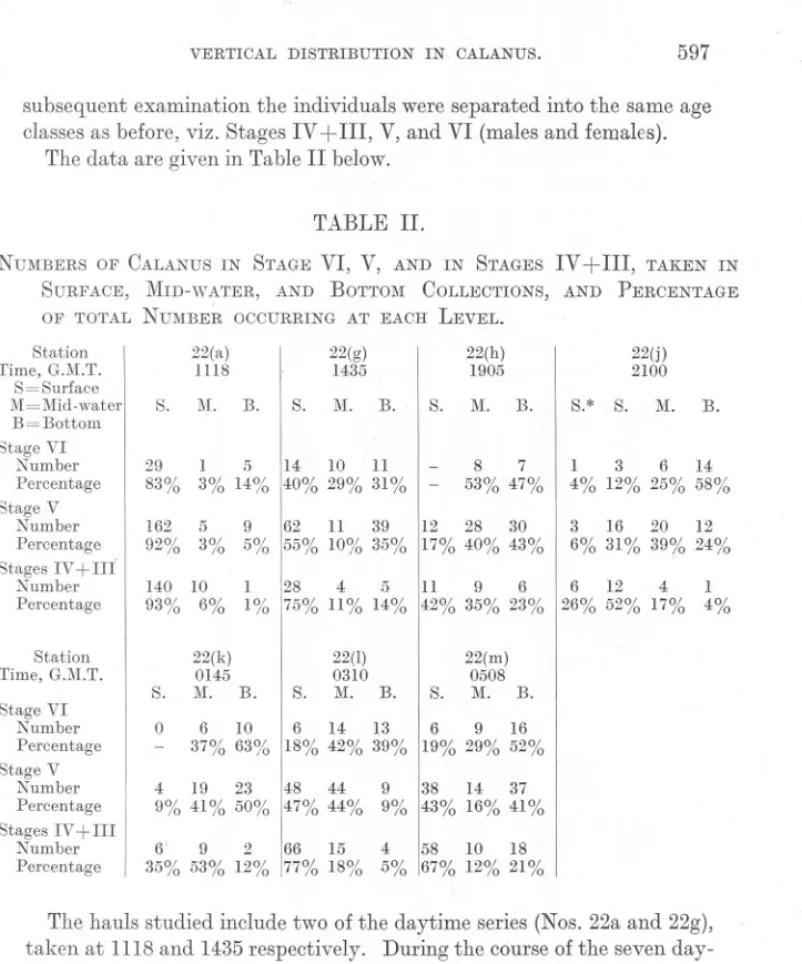
(22) 596. A. C. GARDINER.. to me it seems that one is entitled to re-write Russell's concluding sentence thus: Pure responses to physical and chemical stimuli must tend to divert an animal from its (normal) avoiding and feeding reactions. At the same time I wish to make it quite clear that none of my own work has provided tangible proof that my conception of the motive forces behind these migrations is the more correct. Recently Savage (1931, pp. 24 and 33) published an account of the diurnal migrations of this species based on collections in the North Sea. His results, particularly in the months of August and September, show only a modified agreement with Russell's. During the midnight period, for instance, the migrations were quite at variance with the hypothetical picture suggested by Russell. The daytime results,. however, confirm the observation that during the late summer the animals live higher in the water than in the spring. It must be remembered, however, that Savage used the International closing net of No. 60 silk, and that his material would, on account of the smaller mesh, be very different from Russell's. Evidence is accumulating that the study of the diurnal migrations of a population, all of one species but mixed in respect of age classes, will be unlikely to give clear-cut results, for the reason that individuals of different age do not behave in the same way. As far as Calanus finmarchicus is concerned the data on this point are far from complete, but there are definite indications that it will be necessary to differentiate between the behaviour of young and old individuals. In the present paper I have attempted to show that, by day, individuals in Stage IV (and III) tend to live nearer the surface than do the adults. I have also produced evidence that even in one age class (Stage V) the larger individuals may be found to live nearer the bottom than the smaller ones. Owing to a variety of causes it was not possible on the Oruise under discussion to make an exhaustive study of the behaviour of Oalanus during the hours of darkness. For this reason I have relegated to an Appendix such data as I was able to collect. It will be recalled that on the third day, May 23rd, a small area centred on the position 55°28' N., 0°20' W., was studied in some detail, seven series of hauls being taken between the hours of 1118 and 1435. It was found that, on the whole, the vertical distribution, as well as the total numbers occurring in successive hauls, remained fairly constant. It was accordingly decided to remain in the area and to make further observations during the ensuing hours of darkness. The same methods of collection were employed (see p. 577) and a further fiv~ series of simultaneous hauls at 8, 18, and 28 fathoms were taken at 1905, before sunset; 2100, after sunset; at 0145, during darkness; and at 0310 and 0508, about one hour before and after sunrise. The hauls were made as far as could be judged in the same body of water. In the.
(23) VERTICAL. DISTRIBUTION. IN. 597. CALANUS.. subsequent examination the individuals were separated into the same age classes as before, viz. Stages IV +III, V, and VI (males and females). The data are given in Table II below.. TABLE II. NUMBERS OF CALANUS IN STAGE VI, V, AND IN STAGES IV +III, TAKEN IN SURFACE, MID-WATER, AND BOTTOM COLLECTIONS, AND PERCENTAGE OF TOTAL NUMBER OCCURRING AT EACH LEVEL. Station Time, G.M.T. S=Surface M=Mid-water B = Bottom Stage VI Number Percentage Stage V Number Percentage Stages IV+III Number Percentage Station Time, G.M.T. Stage VI Number Percentage Stage V Number Percentage Stages IV + III Number Percentage. 22(a) 1118 S.. M.. 22(h) 1905. 22(g) 1435 B.. S.. M.. B.. 29 83%. 11 1 5 14 10 3% 14% 40% 29% 31%. 162 92%. 5 3%. 140 10 93% 6%. S.. M.. 22(j) 2100. B.. S.* S.. lVI.. -. B.. 8 47% 7 11 3 25% 6 53% , 4% 12% 12 28 9 62 11 39 30 3 16 20 6% 31% 39% 5% 55% 10% 35% 17% 40% 43%. 14 58% 12 24%. 6 12 4 26% 52% 17%. 1 4%. 11 9 6 1 1% 128 75% 11% 4 14% 5 42% 35% 23%. S.. 22(k) 0145 lVI. B.. 0 -. 6 6 10 14 13 6 9 16 37% 63% 18% 42% 39% 19% 29% 52%. S.. 22(1) 0310 M. B.. S.. 22(m) 0508 M. B.. 4 48 44 19 23 9% 41% 50% 47% 44%. 9 38 14 37 9% 43% 16% 41%. 6' 9 2 15 66 35% 53% 12% 77% 18%. 4 10 18 58 5% 67% 12% 21%. The hauls studied include two of the daytime series (Nos. 22a and 22g), taken at 1118 and 1435 respectively. During the course of the seven daytime hauls, Stations 22a-g, the numbers of individuals in all classes remained fairly high, the averages being: Stage VI, 40; Stage V, 139; and Stages IV +III, 101. By 1435 (Station 22g) the numbers had declined to 35, 112, and 37 respectively. Four and a half hours later, at 1900, before sunset, the numbers had dropped still further to 15, 70, and 26. Being able to sample only three levels, it was impossible to tell whether this was due to the ship being in an area where there were fewer Calanus, or whether the individuals had migrated to some different level. When after sunset, at 2100, the numbers in all classes had dropped still * Additional haul at 2 metres..
(24) 598. A. C. GARDINER.. further, an additional haul about 2 fathoms below the surface was taken. (It was not considered wise to attempt a deeper sample than that at 28 fathoms.) Numbers continued low until the collection made before sunrise (Station 221at 0310) when there was a very definite increase especially in the case of the younger classes. Numerical fluctuations during the course of a period of 24 hours' observations are by no means uncommon.. " 14J5. 1118 I. 0. I. :::T I JO~:. t:.i .... ..... ~ t::. 1905 I. ~. 0145. 2100 I. 0310. ~. eM. T. i. I. C!". TTT. i~TI lit, I. 2. O..fO. 100%. I I I . I I. ,ilI. ~J. Sra;-ftv. ~. 0508. ,!! , I j A.Jiarr€ V.L I. I-. c.. I:::. :. T T ,i' , r[T I. S/a~(!J IV Jlll. FIG. 9.-Diurnal. migration in Calanu8jinmarchicus.. So far as I am aware, however, the catches during the hours of darkness have usually been the bigger. Russell, for instance, gets the following results for Calanus (1925, p. 793; IV, 1926, p. 433) :Daylight (p.m.). 2580 5920. Dusk. 8014 3650 3504. Dark. 9156 9780 8610. Dawn. Daylight (a.m.). 2641 2330 July, 1924. 1986 2470. 1407"l 4876f. ') June, 19.,5..
(25) VERTICAL. DISTRIBUTION. IN. CALANUS.. 599. In an earlier paper (Gardiner, 1931, p. 464) when some data were examined in this connexion, from a population of Calanus sampled with the International net of No. 60 silk, the average number in 15 hauls made during the daytime was 112, whilst the average number in 18 hauls made in the hours of darkness was 107. The diurnal migrations of these three classes, in so far as th~y can be determined from samples at only three levels, are shown graphically in Figure 9. The diagrams have been constructed by computing what percentage of the total number occurred in each of the three collections. In one case (Station 22j) as already mentioned, an additional sample was taken as near the surface as possible. So far as the data go, it would seem that adults and Stage V behave much in the same way. These two classes are seen to have moved progressively downwards from 1118, when they :wereobviously concentrated at a depth of 8 fathoms, until 0145, when the greatest numbers were found at a depth of 28 fathoms. The two subsequent Stations showed an upward migration, ~hich was more rapid in the case of individuals in Stage V. It is interesting to record that in neither class are the catches in the quite superficial water large, showing that if the decline in numbers referred to above was due to the animals' migrations, the direction would probably have been downward. As far as the younger individuals, Stages IV+ III, are concerned, the behaviour differed from that of the older classes in that the catches at the 8-fathom level were, with one exception, the biggest. These individuals, too, would not seem to have sunk to the deeper water during the hours of darkness as have the older specimens. It would probably not be justifiable to contrast these data with those of Russell, from which, of course, they do differ. Neither are a single night's observations sufficient upon which to base general conclusions as to the probable course of the migrations of a species.. APPENDIX. B.. THE RATE OF SINKING OF Oalanus finrnarchicus.. By A. C. Gardiner, with the assistance of J. A. Robertson. Introduction. The fact that these observations on the sinking rate of different sized specimens of Calanus have been appended to an account of the vertical distribution of the same species, may be taken to indicate that we believe there to be a direct connexion between the two subjects. In other words, it may be assumed that we think that since a small specimen sinks more.
(26) 600. A. C. GARDINER.. slowly than a larger one it is not surprising to find the smaller individuals living, on the whole, nearest to the surface. Some ~uch idea did occur to us, but the knowledge that adults may also be abundant in the surface layers is evidence that the greater difficulty which a larger specimen may experience in maintaining itself at any given level is only one factor, and probably not a vital one. At the same time we wish to give it as our opinion that in specimens of different sizes the relationship between the muscular energy and the tendency to sink is one of which sight must not be lost. The measurements in Table VIII, p. 606, are those of the time, in seconds, taken by anffisthetised specimens of Calanus finmarchicus to sink through a column of sea-water of salinity 35.01%, 250 millimetres in height, maintained at a temperature of 18.5° C. The experiments were carried out upon the animals within 3-5 days of their capture, and in the intervening time they were kept in two large aquaria aerated by means of a " plunger" mechanism. . The methods were as follows: A few specimens were transferred to a smaller glass bowl, from which they could easily be removed by means of a net to a second bowl containing a solution of 2.5 grams of Urethane in 100 c.c. of sea-water. As a rule the animals were kept in the solution for a period of five to ten minutes. Experience showed that this produced anffisthesiaof about 1-2 minutes' duration. In those cases where the animal revived too soon, it was immediately re-anffisthetised and a second test made. In any case of doubt that the specimen had been killed it was transferred to a third bowl and carefully observed. Although owing to unavoidable delays some few specimens had really considerable periods in the anffisthetising solution, none was killed. As soon as the animal was deemed to be anffisthetised it was rinsed in sea-water and thence transferred to the test cylinder by means of a wide-mouthed pipette, the end of which was bent at right angles: In this way each animal was introduced into the cylinder with no initial downward velocity. The time taken to sink through the measured distance was read to the nearest tenth of a second from a stop-watch. On reaching the bottom of the cylinder the animal was removed and immediately killed and preserved in 2% formaldehyde. Subsequently the length of each was determined as well as the developmental stage or sex. The test cylinder was an ordinary 1000 m.l. measuring cylinder standing in a bell-jar in which water was circulating. The temperature was read every time an observation was made. Notes were made on the position in which the antennffi were held during test. In the majority of cases these were fully extended, the animals sinking vertically, tail first, with the longitudinal axis of the body at only a very slight angle to the vertical. This is the position in which.
(27) VERTICAL. DISTRIBUTION. IN CALANUS.. 601. unanmsthetised. specimens also were observed.to sink. Where the antennm were partially or completely fold.ed.to the sid.es the animals sank head. first, with the longitud.inal axis at an angle of about 30° to the vertical and. frequently with the ventral surface uppermost. No unanmsthetised. specimen was at any time observed.in such a position. It was anticipated. that there would. be marked. d.ifferencesin the times taken in sinking by specimens of nearly the same size, accord.ing to whether the antennm were fold.ed.or not. Such, however, was not found. to be the case. Experimental Results. The time that each specimen took to sink through the measured. distance of 250 mm., the length of the specimen in millimetres, measured. from the head. to the end. of the caud.al furcm (caud.al setm not includ.ed.) TABLE III. AVERAGE TIME, finmarchicus COLUMN. IN SECONDS, REQUIRED FOR ANlESTHETISED OF DIFFERENT. OF WATER. 250. MlIL LONG.. Length (mm.).. Mean time (seconds).. 2.1 2.2 2.3 2.4. 2.6 2.7 2.8 2.9 3,0 3.1 3.2 3.3 3.4 3.5. 181.3 135.0 110.6 118.7 114.9 99,9 106.8 120.8 74.3 70.4 70.3 58.4 58.9 60.0 57.9 43.8. 3.6 3.7 3.9 4.0. Calanus. LENGTHS (IN MM.) TO SINK THROUGH A. 43.9 (1 only) 31.0 (1 only). and. the d.evelopmental stage are given in Table VIII. The observations have been arranged. in groups, in ascend.ing ord.er of size of the specimens. These results have been summarised. in Table III, which shows that on the.
(28) 602. A. C. GARDINER.. whole the time taken to sink through a fixed distance varies inversely as the length of the individual. The correlation between sinking time and length, expressed as the coefficient of correlation, worked out at r= -0.63, which may be taken as fairly satisfactory. Variations in temperature were small. 89% of the observations lay within an interval of 0'3° C., of which the mean temperature, 18'55° C., was the mid-point. Thus, alterations in the viscosity of the water, due to temperature changes, which would be considerable for large fluctuations in temperature, may be ignored. SUMMARY AND DISCUSSION. One hundred and twenty-one specimens of Calanus finmarchicus were amesthetised in a dilute solution of Urethane (2.5 grms. in 100 C.c. of seawater) and the time taken by each to sink through a measured distance determined. The length of each specimen, in millimetres, was noted, and the relationship between sinking time and length of the individual was determined. The coefficient of correlation, r, was found to be -0.63. Apstein (1910, p. 23), working with preserved material, found that the time taken by adult Calanus was less than that taken by young. He does not give actual length measurements. Eyden (1923, p. 53) showed that for anffisthetised specimens of Daphnia pulex, the average rate of fall was approximately twice as great in specimens of length 2.5-3.0 mm. as in smaller ones, whose length varied from 1.5-2.0 mm. The position in which specimens sank was conditioned by the manner in which the antennffi were held. It was found, however, that this had not as great an influence on the sinking rate as might have been expected. Of the 121 specimens examined, 21 were in Stage IV, 41 in Stage V; 59 were adult, of which 54 were females and only 5 were males..
(29) TABLE. IV.. NUMBERS OF CALANUS IN STAGE VI, V, AND IN STAGES IV +III, TAKEN IN SURFACE, MID-WATER, AND BOTTOM COLLECTIONS. MAY 21sT. Station Time, G.M.T. Depth in fathoms S=Surface M=Mid-water B=Bottom Total Calanus Stage VI Male Female Total Stage V. Stages IV + III. 5 1230 48. 4 1105 35. 3 0935 35. 2 0805 34. 1 0620 31. <j >-3. >-<. 13.. S.. 1\1.. B.. S.. lVI.. B.. S.. M.. B.. 47. 34. 98. 39. 29. 32. 46. 61. 7 3 10 19. 15 9 24 46. 10 6 16 22. 8 4 12 17. 5 5 10 15. 2 3 5 23. 16 11 27 34. 5. 28. 1. 7. 18. S.. M.. B.. S.. lVI.. 19. 50. 64. 30. 54. 110. 13. .5 2 7 50. 1 1 2 11. 6 2 8 28. 7 4 11 76. 1. 1 1 5. 2 4 6 19. 1 2. 2 2 28. 12. 25. 7. 17. 18. 23. 10. 17. -. 0 .,.. t< t:I >-< w >-3. >-< I:>;j. c::: >-3. >-<. 0 Z. >-<. Total Calanus Stage VI Male .Female Total Stage V Stages IV + III. 7 1602 50. 6 1427 52. Station Time, G.M.T. Depth in fathoms. Totals.. lVI.. 13.. S.. 1\1.. B.. I 28. 58. 20. 97. 49. 90. 5 7 12 25 21. 2. 2 2 12 14. 2 2 58 37. 7 3 10 26 13. 29 13 42 37 11. S.. 1\1.. B.. S.. M.. 13.. S.. 189. 37. 54. 11. 32. 45. 16 7 23 127 39. 5 2 7 19 11. 10 7 17 33 4. 2. 3 2 5 21 6. 11 2 13 23 9. 2 4 5. 9 1855 38. 8 1730 40. 2 12 6. S. I. 1\1.. B.. 517. 412. 507. 40 27 67 280 169. 40 31 71 211 130. 95 46 141 301 65. Z 0 .,.. t< .,.. Z c:::. ?'. 0.
(30) .... 0 "'". TABLE V. NUMBERS. OF OALANUS. Station. -. Time, G.M.T. Depth in fathoms S=Surface M=Mid-water B=Bottom Total Calanus Stage VI Male Female Total. Stage V Stages IV + III. I. TAKEN. IN SURFACE,. 10. 11. 12. 13. 0612 41. 0733 28. 0915 32. 1051 34. I. I. B.. S.. M.. B.. S.. 1\1.. B.. S.. M.. B.. I. 5. 54. 1. 2. 26. I. 7. 70. 1. 15. 72. 1 1 3 1. 19 9 28 25 1. I -. -. I 3 4 3 -. 22 21 43 27 -. -. 2 -. 6 5 11 14 1. 21 22 43 20 -. I -. 16 1517 30!. 15 1350 42 S.. I 33. I 2 3 18 12. I. I. I. M. 22. B. 103. S. 17. 1\1. 73. B. 43. 1 5 6 12 4. 11 14 25 66 12. 1 I 6 10. 7 3 10 41 22. 7 3 10 24 0. I. I. S.. 1\1.. 2. 0. R. 16. 1 I. 1 1 7 1. 1 2 3 12 1. S.. -. 18 1810 40. 17. 1643 31. 1 1 0 5. 14 1222 26. I. M.. -. MID-WATER,. 22ND.. S.. Station Time, G.M.T. Depth in fathoms Total ClLlanus Stage VI MILle Female Total Stage V Stages IV+III. IN STAGE VI, V, AND IN STAGES IV +III, AND BOTTOM OOLLECTIONS. MAY. S. I. -. M.. B.. 8. 14. 1 1 5 2. 3 3 6 8 -. TotlLJs.. M. I. n.. I. 3 6 0 3 1. 13. I. S. 56. M. 142. B. 411. 2 2 4 20 23. 12 12 24 82 36. 03 85 178 208 25. t>-. p Q. :> tI "" Z t:<j.
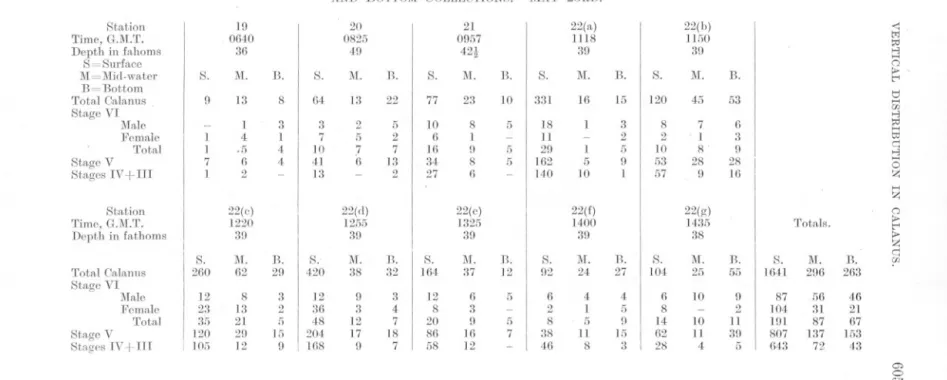
(31) TABLE. VI.. NUMBERS OF OAJANUS IN STAGE VI, V, AND IN STAGES IV +III, TAKEN IN SURFACE, MID-WATER, AND BOTTOM OOLLECTIONS. MAY 23RD. 10 0640 36. Station Time, G.M.T. Depth in fahoms S=Surfaee M=Mid-water B=Bottom Total Calanus Stage VI Male Female Total Stage V Stages IV+IJI. 21 0057 42!. 20 0825 40. 22(a) 1118 30. <: t:J. 22(h) 1150 30. >-3 H. S.. J\L. B.. S.. J\L. B.. S.. M.. B.. S.. J\L. B.. S.. M.. B.. 0. 13. 8. 64. 13. 22. 77. 23. 10. 331. 16. 15. 120. 45. 53. 1 1 7. 1 4 .5 6. 3 1 4 4. 3 7 10 41. 2 5 7. 5 2 7 13. 10 6 16 34. 8 I 0 8. 5. 1. ]. 2. 2. 27. 6. 18 11 20 162 140. 3 2 5 0 1. 8 2 10 53 57. 7 .1 8 28 9. 6 3 0 28 ]6. 6. ]3. 5 5. -. -. 1 5 10. 0 ;.. t'". tj m H. >-3. H t:d q >-3. II. (3 Z H. Z Station. Time, G.1\LT. Depth in fathoms. 1220 30. I. 22(e) 1325 30. 22(d). 22(e). 1255 30. 22(f) 1400 39. 22(g) 1435 38. Totals.. I. Total Calanns Stage VI Male Female Total Stage V Stages IV + III. n.. S. I 260. M. 62. B. 20. S. 420. ]\1. 38. 32. 12 23 35 ]20 ]05. 8 13 21 20 ]2. 3 2 5 15 0. ]2 36 48 204 ]68. 0 3 12 17 0. 3 4 7 ]8 7. I. 164 s. 12 8 20 86 58. M.. n.. S.. M.. n.. S.. M.. B.. S.. M.. B.. 37. 12. 92. 24. 27. 104. 25. 55. 1641. 206. 263. 6 3 0 16 12. 5. 6 2 8 38 46. 4 1 5 II 8. 4 5 0. 6 8 14 62 28. 10 10 11 4. 9 2 11 30 5. 87 104 191 807 643. 56 31 87 137 72. 46 21 67 153 43. -. 5 7. -. ]1). 3. 0 ;.. t'" ;.. Z q :n. 0 01.
(32) 606. A. C. GARDINER.. TABLE. VII.. NUMBERS OF CALANUS IN STAGE VI, V, AND IN STAGES IV +III, TAKEN IN SURFACE, MID-WATER, AND BOTTOM COLLECTIONS. MAY 25TH. Station. Time, G.M.T. Depth in fathoms S=Surface M=cMid-water B=Bottom Total Calanus Stage VI Male Female Total Stage V Stages IV + III. Time, G.M.T. Depth Stationin fathoms Total Calanus. 35 0628 42. 36 0812 42. S.. M.. B.I. S.. M.. B. I S.. M.. B. I S.. IlL. B.. 3. 24. 32'. 9. 112. 34 I 300. 54. 11 I 174. 27. 23. -. 6. 1 2. 6 15 3. 7 6 13 15 4. 6 3. 2 22 24 82 6. 8 6 14 18 2. 2 10 12 27 15. 2 2 40 132. 5 4 9 11 7. 4 3 7 15 1. 39 1629 35. I. 38 1403 42. 37. 1216 39. I. 4 4 8 72 220. 40 1821 32. I. 1 1 5 5. 41 1927 19t. S. 117. M. 28. B. 36. S. 138. IlL 19. B. 42. 10 5 15 20 82. 4 5 9 16 3. 9 3 12 20 4. 19 11 30 71 37. 5 3 8 6 5. 9 7 16 21 5. S. 34. M.. B. 46. 2. d .8 .p. 2. Z t:. 7 6 13 19 14. S. 111. B. 775 264 224. Totals.. I. Stage VI. Male Female Total. Stage V Stages IV+III. 18 14. 1i. "'". '". 33 24 57 228 490. 24 44 68 157 39. TABLE VIII. TIME (IN SECONDS) TAKEN BY CALANUS TO SINK THROUGH 250 MM. OF WATER. (The observations. in order of length.). Stage. IV IV IV. Time. Secs. 238.8 205.3 99.9. 2.2. IV IV IV IV IV. 123.7 153.3 191.3 78,9 127.8. folded. fully extended. " folded.. 2.3. IV IV IV IV IV IV IV IV. 48,0 72.0 89.0 121.3 135.9 147.7 187.6 83,0. fully extended.. Length. mm. 2.1. -. have been arranged. Remarks. Antenme. fully extended.. " folded.. 45 31 76 113 35.
(33) 607. VERTICAL DISTRIBUTION IN CALANUS. TABLE VIII-continued. Stage. IV IV IV IV IV. Time. Sees. 150.6 99.3 93.4 94.6 155.5. V V. 2.7. 2.8. Length. mm. 2.4. 2.6. 2.9. 3,0. 3.1. " ". fu'riy extended.. 106.7 123.1. " ". folded.. V V V V V V V V. 96.1 78.1 75.0 122.1 98.3 189.1 72.1 63.7. " " ". fully extended. folded. fully extended.. V V '? V V V V V. 123.5 120.1 62.7 75.4 110.8 1248 73.3 163-4. " " " " " ". foided. fully extended. " " folded. fully extended.. V V V V V V. 72.5 103.9 176-4 132.4 68.7 170.7. " " " " " ". V V '? <J V V V V V V V. 53.3 38,6 64-1 56.1 84.2 75.7 61.0 117.9 84,6 112.2 73-6. ". folded.. " " ". fu'riy extended. folded.. " ". fu'Uy extended.. '? V <J '? V '2 V V '?. 57.6 69,9 52.5 83,9 39.1 65.8 75.0 70.7 170.0 58,5. " " " " " " " ,. " ". " foided. " fully extended. folded. fully extended. " foided. " fully extended.. '? '? '? <J. 57.8 60,9 55.4 39,5. " " ". " " folded.. V. 3.2. Remarks. Antennoo folded.. t. folded.. folded. fully extended.. t. folded.. fully extended. folded. fully extended..
(34) 608. A. C. GARDINER. TABLE VIII-continued.. 'i? Q V 'i? 'i? V. Time. Sees. 130.4 82.7 67.9 55.5 71,5 59,7 47,3 59,7 71-4 55,0* 110.8 88.6 53.2 98.4. 'i? 'i? 'i? 'i? 0"' 'i? 'i? 'i? 'i? 'i? 'i? 'i? 'i? 'i?. 58,6 98.2 68.6 50.3 42.2 45.3 48,5 62.0 38,3 63.8 58,3 62.9 53.5 67,3. 'i? 'i? 'i? 'i? 'i?. 54.4 58.5 54'5 70.0 57-1. 'i?. " " " " ". 'i?. 114.2 31.9 63,3 56.4 46,0 58.7 49.4. 'i? 0-t'i? 'i? 'i? 'i?. 86.2 46.0 45.3 65.7 54.7 49.3. " ". fuiiy extended.. 'i? 'i? 'i?. 49.1 36.9 45.4. " " ". foided. fully extended.. 3.9. 'i?. 43.9. ... folded.. 4,0. 'i?. 31.0. Length. mm. 3.2. Stage. V 'i? 'i? Q 'i? 'i? Q. V. 3,3. 3.4. 3.5. Q. (J 'i? 'i? 3.6. 3,7. Antennre " " " " " " " " " " ". Remarks. fully extended. " foided. fully extended " foided. fu'liy extended.. foided. fully extended. " " ". ... foided.. " " " ". folded. fully extended.. " " ". foided. fully extended.. ... * Mean of six runs.. -------------------. i. xtended.. " foided. fully extended.. i folded. folded.. fully extended..
(35) VERTICAL. DISTRIBUTION. IN CALANUS.. 609. REFERENCES. ApSTEIN,C. Hat ein Organismus in der Tiefe gelebt in der er gefischt ist ? Internat. Rev., Bd. III, 1910-1l. EYDEN,D. Specific Gravity as a Factor in the Vertical Distribution of Plankton. Proc. Cambridge Philos. Soc., Vol. I, No.1, 1923. FARRAN,G. P. Copepoda. Cons. Int. Expl. de la Mer., Extrait du Bulletin Trimestriel, II (1902-8), 1911. GARDINER,A. C. The Validity of Single Vertical Hauls of the International Net in the Study of the Distribution of the Plankton. Journ. Mar. BioI. Assoc., N.S., Vol. XVII, No.2, 1931. HARDY,A. C. The Herring in Relation to its Animate Environment. II. Fishery Investigations (England). Series II, Vol. VIII, No.7, 1925. LEBOUR,M. V. Stages in the Life-History of Calanus finrnarchicus (Gunnerus). Journ. Mar. BioI. Assoc., N.S., Vol. XI, 1916-18. RUSSELL,F. S. The Vertical Distribution of Marine Macroplankton. An Observation on Diurnal Changes. Journ. Mar. BioI. Assoc., N.S., Vol. XIII, No.4, 1925. -. Ibid.. IV. Ibid.. Vol. XIV, No.2, 1926.. The Vertical Distribution of Plankton in the Sea. Biolog. Reviews, Vol. II, No.3, 1927. The Vertical Distribution of Marine Macroplankton. V. Journ. Mar. BioI. Assoc., N.S., Vol. XIV, No.3, 1927.. --. Ibid. VI.. Ibid., Vol. XV, No.1, 1928.. --. Ibid. VII. Ibid.,. Vol. XV, No.2, 1928.. --. Ibid. X.. Ibid.,. Vol. XVII, No.2, 1931.. -. Ibid. XI.. Ibid., Vol. XVII, No.3, 1931.. SAvAGE,R. E. The Relation between the Feeding of the Herring off the East Coast of England and the Plankton of the surrounding waters. Fishery Investigations (England), Series II. Vol. XII, No.3, 1931. SOUTHERN,R., and GARDINER,A. C. A Preliminary Account of some Observations on the Diurnal Migration of the Crustacea of the Plankton of Lough Derg. Internat. Rev. d. g. Hydrobiol. u. Hydrogr., Bd. XV, Heft 5/6, 1926.. -. --. -. ---. -----.
(36) 610. A. C. GARDINER.. SOUTHERN,R., and GARDINER,A. C. The Diurnal Migrations of the Crustacea of the Plankton of Lough Derg. Proc. Roy. Irish Acad., Vol. XL, Section B, No. 11, 1932. WHARTON,SIR J. W. L., and FIELD, SIR MOSTYN. Hydrographical Surveying. London, 1920. WORTHINGTON, E. B. Vertical Movements of freshwater Macroplankton. Internat. Rev. d. g. Hydrobiol. u. Hydrogr., Bd. XXV, Heft 5/6, 1931.. -. ----.
(37)
Figure

+7

Related documents
Where Over and under refer to, respectively, the group of firms with investments in excess and the group of firms with investments below the necessary level; I is the
Thus, this study tries to dig deeper into the theory in branding by investigating brand empowerment as an antecedent of employees’ critical psychological states (employee
Therefore, given the recurrent issues with the representativeness of survey microdata, data users are advised to apply the weights provided (‘aweight’ in wave 1 and
Regarding the other varieties we can notice that the phenophase of the inflorescence occurred after one day after the witness variety as compared to varieties
Keywords: Helicobacter pylori , Serological testing, Stool antigen test, Endoscopy biopsy, Urease breath test, Non-ulcer dyspepsia, Peptic
In this article, the aim is to investigate how students assess the credibility of scientific information in web-based environments and whether the framework suggested by Fogg
Critical success factors for Big Data adoption in the virtual retail: Magazine Luiza case study.. Bruno Muniz Félix
Det är säkert en inte helt enkel balansgång i alla lägen men när jag efter vårt möte promenerar tillbaka längs Charles River så känns det som det är precis här Henry
