The Association Between Urbanized Diet and the Prevalence of Overweight, Diabetes, and Hypertension in China
Erin Sanzone
Honors Essay Department of Nutrition
University of North Carolina at Chapel Hill 2020
I. Introduction
Urbanization and Diet
China is a rapidly growing population, with more than 1.4 billion people as of January
2019.1 The rapid urbanization experienced in recent years has been paralleled with an increase in
diet-related chronic diseases, such as hypertension, diabetes, and overweight. Between the years
1980 and 2009, China has experienced the greatest human migration from rural to urban areas in
history, climbing from 191 million to 622 million, with 51% of the population living in urban
areas.2 This marked the first time in Chinese history in which the urban population outnumbered
the rural sector. Not only have people moved to urban areas, but also without movement,
urbanization within regions has increased. Among many effects, the urbanization has impacted
the diet of the population of the nation.
The unprecedented urbanization has become a public health concern for the population of
China. The “nutrition transition” in Asia explains the dramatic changes in food consumption and
eating habits.3 Du, et al. analyzed the population of China from 1982-1997 and found the start of
the economic boom in the 1985s dramatically changed the dietary habits of the population.4 The
percentage of energy from fat in urban residents increased from 27.3% in 1982 to 32.8% in 1997.
The urban population also had a decrease in energy expenditure and an increase in leisure time.
Zhai, et al. studied the population of China from 1989-2004, with a sample size of 5,000 and
found the rise in economy of China in 1990 influenced the change in changes in income and
diet.5 There was a great increase in fat (19% to 28% between 1989 and 2004), with a dramatic
decrease in carbohydrates in response. They also found nutrition deficiencies decreased while the
Baker, et al. found processed foods have become a large concern across Asian countries
due to the foods’ increase in refined sugars, sodium, and saturated and trans-fats.6 With
urbanization in China, the population has increased consumption of foods high in fat, protein,
added sugars, and sodium. Pork is heavily consumed, and egg and poultry consumption is
rising.7 Manzel, et al. have indicated that high-fat diets are factors that may associate with
increased adiposity, specifically an increase in white adipose tissue and systemic inflammation.8
Furthermore, obesity is a risk factor for hypertension. The risk of cardiometabolic disease is
climbing as Chinese diets decrease in consumption of fruits of whole grains, increase in sodium
and alcohol, as well as more processed and high fat foods, among other factors that contribute to
cardiometabolic diseases.9
In parallel to the nutrition transition, there has also been a retail revolution in China.
Zhang, et al. found the rise of supermarkets from 2000-2010 in China was the fastest growth of
the supermarket industry than anywhere else in the world.10 Zhou, et al. analyzed the food retail
industry in China and its impact on health across the nation.11 The retail revolution has created a
dramatic increase in processed and packaged foods, which are high in sugars, fat, and sodium.
Based on data from the 2011 China Health and Nutrition Survey, Zhou, et al. found the greatest
percentage of people consuming processed foods live in megacities or highly urbanized areas.12
Furthermore, in a large population-based study in China with a sample size of 3,682 spanning
many provinces, Tian, et al. found almost 13% of the sodium of the urban population is derived
from processed foods, while on average, only 6% of the sodium consumed in rural areas comes
from processed foods.13 The transition can have an impacting effect on the health of the nation.
Not only has the type of foods changed, the eating habits of the Chinese population has
merely a green tea between meals.14 Using 3-day, 24-hour recall data from 1991-2009 China
Health and Nutrition Survey with an average of approximately n=11,000 at each year, Wang et
al. found a statistically significant increase in snacking prevalence, frequency of snacking
occasions, and total daily energy from snacks from 1991 to 2009.15 The rate of snacking
statistically significantly increased in level of SES and in urban compared to rural areas. Snacks
were defined as food consumed outside the “normal” set meals: breakfast, lunch, and dinner.
Common snacks were fruits, fast food, grains, sugar-sweetened beverages, and animal foods.
Fruits were found to be the most prominent snack choice.16
In terms of cooking methods, there has been a decline in boiling and baking food.
Instead, there has been a greater emphasis of frying food in excess oils. Wang, et al. found, from
1991 to 2004, the prevalence of calories/day coming from fried foods increased on average by
10% across three levels of income and education, with a larger percentage of urban population
consuming snacks than rural population.17 Additionally a mega-analysis between 1990-2015
presented by Wang, et al. has been an increase in eating outside the house, including at food
stands, restaurants, etc., as well as purchasing pre-prepared meals from supermarkets.18 Tian, et
al., using data from the CHNS, observed a positive correlation between BMI and eating out.19
Moreover, Li, et al. presented a meta-analysis of urbanization in China and its impact on
environmental and human health between 1990 and 2011. Li, et al. found the urban population is
characterized as engaging in less physical activity, more smoking, and greater alcohol
consumption than the rural population.20 In addition, the rate of mortality from cardiometabolic
diseases jumped from 36.6% in 1990 to 41.5% in 2011 in urban areas.21 Barry Popkin found the
decrease in physical activity as the widespread use of technology affected the urban population
in the rural populations, has led to a more sedentary lifestyle.22 The lack of physical activity has
likely contributed to the increase in obesity and overweight individuals across the country.As for
alcohol consumption, alcohol has long been present for the Chinese population for cultural
events. However, the consumption of alcohol has dramatically increased.23 Iona Millwood, et al.
has found that the urban population is more likely to engage in recreational alcohol use than the
rural population.24 A greater consumption of alcohol was linked to higher blood pressure and
regular smoking. Millwood, et al. found each 20g/day increase in alcohol consumption was
associated with an increase in systolic blood pressure of 2 mmHg.
Hou et al. (2008), in a population-based longitudinal study with a randomly selected
sample of 5,362 adults aged 25-65 years of age from Shangai, found that approximately one third
of the sample was overweight in 2004.25 In a more recent publication, Wang et al(2015)
reported the prevalence of hypertension of 23.25% in a nationally-representative sample of
China (n=451,755) between 2012-2015 .26 Hu et al (2018) found the incidence of type II diabetes
has rapidly increased from 1% in 1980 to 10.8% in 2013 based on a nationally-representative
cross-sectional study of China (n=170,287).27, 28
There has been an overwhelming change in the dynamics of eating habits in the Chinese
population, paralleled with the country’s swift urbanization. The shift away from traditional
cooking methods and traditional foods may play a large role in the health of the urban
population.
Thus, there is an urgent need to understand how an urbanized diet is associated with
diet-related chronic diseases, such as hypertension, diabetes, and overweight to work toward
improving the health of the nation. To this end, we used a single measure of urbanized diet
urbanization index for overall urbanization based on a variety of factors, such as population size,
population density, type of occupations, and the number of markets that provides a nuanced
index of overall urbanization.30 Our team also has developed a diet urbanization index based on
foods and eating habits considered a part of an urban diet. Using this new urbanized diet measure
for 2015, we will examine the association between urbanized diet and diet-related chronic
diseases: overweight, hypertension, and diabetes.
II. Methods
Data Collection
We used data from the China Health and Nutrition Survey. The CHNS is a longitudinal
study that was started in 1989, with subsequent surveys every 2 to 4 years for a total of 10 rounds
of surveys until 2015, collecting demographic, health, and nutritional information among the
participants. The initial data was collected using a random cluster design and utilized
questionnaires to collect the data.31 The initial CHNS surveys took place in nine provinces in
China, using a multistage, random-cluster design, with three additional megacities included in
2011 and three additional provinces included in 2015. The CHNS was designed to capture
urban-rural differences in selected provinces and megacities, and it is not nationally representative.
All 15,718 adult participants (≥ 18 years old) with diet data collected in 2015 were
considered eligible participants (Figure 1). We excluded individuals who had any of the
following characteristics: pregnant at the time of exam (n=53) or individuals with missing or
unreasonable (below 500 and above 10,000) daily calorie intake (n=47). We also excluded 53
individuals as they were missing the urbanized diet measure, our main independent variable. We
annual household income per capita, physical activity, daily calorie intake, or education (n =
1,637). After these exclusions, our final analytic sample was n= 13,981 participants for the
health outcome regressions, with different sample sizes for each outcome: overweight
(n=12,658), hypertension (13,979), and diabetes (12,019), based on the participants with data for
Figure 1: Flow Chart of Sample from China Health and Nutrition Survey (2015) and
activity. Table 1 lists the variables incorporated into the urbanized diet measure. Scores were
assigned to each variable using different methods depending on the nature of the variable and
frequency of positive response or rate of consumption. Continuous variables categorized on a 0-4
scale were categorized on a 0-4 scale using two different methods. The method used was
determined based on the percentage of consumers for each variable. If 80% or more of the
sample were consumers, quintiles were created to assign scores. A score of 0 corresponded to the
1st quintile, including non-consumers, 1 corresponded to the 2nd quintile, and so on with 4
corresponding to the 5th quintile. If less than 80% of the sample were consumers, scoring was
completed using quartiles. Non-consumers were assigned a score of 0, while scores of 1-4
corresponded to the 1st through 4th quartiles of consumption. Binary questions received either a
“0” or “4” for “no” or “yes” depending on the urbanization of the variable. For the only
negatively associated variable included, percent of calories consumed from carbohydrates, the
highest consumption of carbohydrates was given the lowest score for diet urbanization.
Carbohydrates are readily replaced by fats or proteins, and thus, we found a decrease in
carbohydrates as urbanized diet increases. The quintile method was used, dividing the percent of
calories consumed from carbohydrates into five levels. The highest quintile was assigned a score
of 0, the next highest was assigned a score of 1, and so on, with the lowest consumption assigned
a score of 4, correlating to the highest diet urbanization. The total urbanized diet measure of each
individual was found by adding the variable scores together. The mean urbanized diet measure
was 19.65 units, with a standard deviation of 8.13 units, and a median of 20 units, with a range
from 0 - 44 units, as seen in Figure 2.
Figure 2:Distribution of the Urbanized Diet Measure in Analytical Sample from China
Outcome Measures
Whelton, et al. (2017) wrote a meta-analysis of observational studies regarding blood
pressure and the definition of hypertension. After collecting blood pressures and analyzing the
risk of cardiometabolic diseases across dozens of samples, hypertension is defined as having
blood pressure greater than 130/80 mmHg.33 Wang, et al. (2013) used a cross-sectional survey
with 170,287 participants to find the prevalence of diabetes in China. Researchers measured
fasting plasma glucose and hemoglobin levels; for those without diagnosed diabetes, a 2-hour
oral glucose tolerance test was conducted.34 Undiagnosed diabetes was defined by fasting plasma
glucose levels of 126 mgl/dL or greater, 2-hour plasma glucose level of 200 mg/dL or greater.
measured height, weight, waist-to-hip ratio, and body fat percentage. Those with a BMI ≥24kg
m2
were considered overweight..35 The hypertension sample has 13,979 participants, the diabetes
sample has 12,019 participants, and the overweight sample has 12,658 participants.
Covariates
Age, annual household income per capita, and highest education level attained were
covariates in all statistical models. Smoking and sex were also included although in models
where both smoking and sex were included, due to strong correlation between smoking status
and sex, (men are much more likely to smoke than women) they were included as a combination
variable to control for both factors. Specifically, we defined five categories: (1) man, never
smoker (2) man, past smoker, (3) man, current smoker, (4) woman, never smoker, or (5) woman,
ever smoker. We controlled for smoking, as it may be a confounding variable in the overall
health of the individuals. Furthermore, we controlled for household income per capita could
influence access to food. We also controlled for education as we predicted it may influence food
choices. In addition, we controlled for physical activity, as this is a confounder of the association
between diet and health. Sodium and potassium, measured from a household weighed inventory
in combination with three consecutive 24-hour recalls, were included as covariates in the
hypertension models.
Data Analysis
All data analysis was completed using STATA version 16. We quantified the association
between the urbanized diet measure and cardiometabolic risk, measuring outcomes
(hypertension, overweight, and diabetes) using adjusted odds ratios. We ran mixed effect
logistics models, analyzing odds ratios and their complementary confidence intervals, accounting
we used ANOVA and chi-squared testing to determine the significance of differences in
continuous and categorical variables by quartiles of urbanized diet measure.
We used two sequential mixed effects logistic regression models for regressions for
diabetes and overweight, and three sequential models for hypertension. The first model for all
outcomes included only the crude and sociodemographic covariates sex, age (in years), education
(none, primary school or less, completed primary school, college or more), per capita household
income inflated to 2015 value (k), and region. In the second model, we controlled for all of those
covariates and additionally controlled for lifestyle behaviors: 3-day average energy intake (kcal),
sex-smoking bivariable (female never smoke, male never smoke, female ever smoke, male
former smoke, male current smoke), and physical activity (total METs/week). For the
hypertension model, we included an additional third model, which controlled for all of the
sociodemographic and lifestyle behavior data but also added sodium, and potassium as
covariates. In all the models, to ensure a meaningful effect size, all continuous measures,
including the urbanized diet measure, were scaled by their standard deviation. We present
adjusted odds ratios and confidence intervals for all models.
III. Results
Sociodemographic
The sociodemographic data for the analytic samples is described in Table 2. The sample
had a mean age of 51.5, with slightly more women than men. About the same amount individuals
were found in Central and South regions, with fewer from the North region. A majority of
participants had completed primary school, while only 14.5% completed college or more.
As seen in Table 3, only about 4% of females ever smoked, while majority have never
average total METs/week was 162.1, with a standard deviation of 171.5 METs/week, indicating
a wide range in amount of physical activity.
As seen in Table 4, approximately half the sample was hypertensive and half were
overweight. Diabetes prevalence was approximately nine percent.
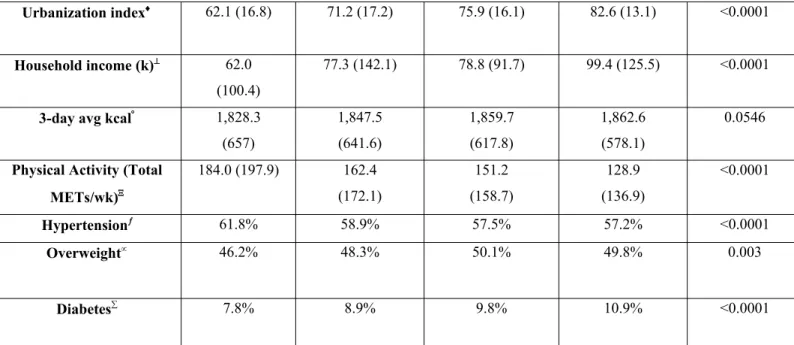
Table 5 presents the differences in covariates across quartiles of the urbanized diet
measure: low urbanized diet measure (0 -14), low-moderate urbanized diet measure (15-20),
moderate-high urbanized diet measure (21-25), and high urbanized diet measure (26-44). There
were overall differences in cardiometabolic disease prevalence (Chi-squared p<0.05). Prevalence
of overweight and diabetes tended to be higher across quartiles of urbanized diet; however,
hypertension had a negative correlation with urbanized diet measure. There were overall
differences in means in age, sex, education, region, sex-smoke, urbanization index, household
income, and physical activity based on ANOVA and chi-squared testing (p<0.05). For example,
in the lowest urbanized diet quartile, 5% of individuals were college graduates, while in the
highest urbanized diet measure quartile 25.4% of individuals had graduated college.
Furthermore, average age was 53.4 years (standard deviation (15.0)) for the first quartile of
urbanized diet measure and was 51.3 years (standard deviation (15.1)) for the fourth quartile. On
the other hand, physical activity decreases with increasing urbanized diet measure. We saw
evidence of differences in patterns of smoking by sex across quartiles, with the highest quartile
having slightly higher percent of non-smokers (58.3% female never smokers, 16.4% male never
smokers) as compared to the first quartile (54.1% female never smokers, 13.3% male never
smokers). Average three-day average kcal/day did not differ across quartiles of urbanized diet
measure (p>0.05).
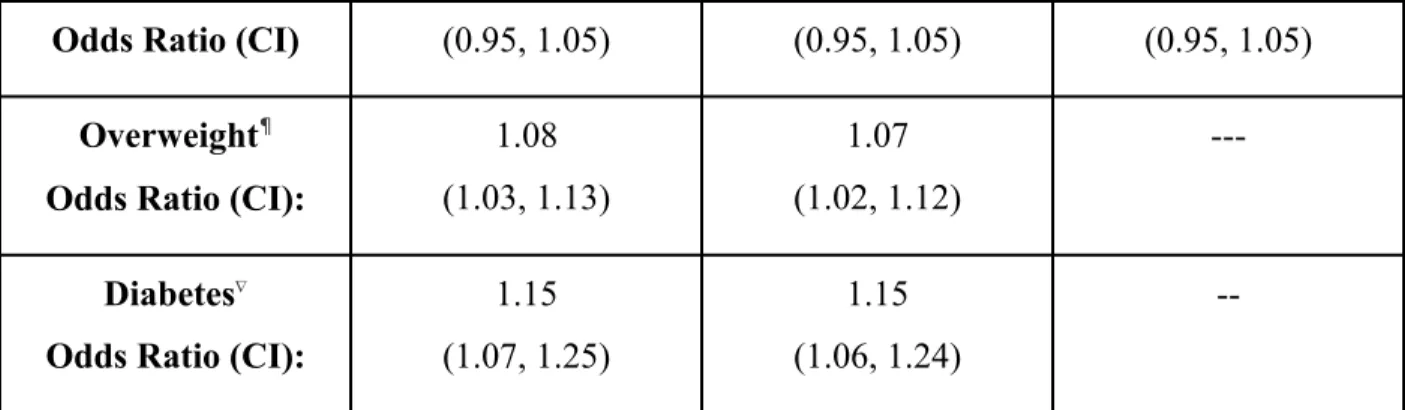
In Table 6, we estimated the effect for a 1-standard deviation (8.14) difference in
urbanized diet relative to each of the cardiometabolic disease measures. We found a 1 standard
deviation increase in our urbanized diet measure was associated with higher odds of being
overweight (OR= 1.08; 95% CI:1.03, 1.13) and diabetic (OR=1.15; 95% CI:1.07, 1.25). This
association was robust to the inclusion of each set of covariates. We did not find a statistically
significant association between urbanized diet score and hypertension in any of the models. Most
notably, the odds ratio was not statistically significant with hypertension in Model III, which
controlled for sodium and potassium. Increased sodium and lowered potassium levels have been
associated with an increased risk for hypertension for decades.36 It was interesting that these did
not play a larger role in our analysis.
In Table 7, we present the odds ratios covariates for each cardiometabolic outcome. Male
never smoker and former smoker were both associated with higher risk of cardiometabolic
outcomes as compared to male current smokers, while female never and ever smokers were
associated with lower risk of cardiometabolic outcomes as compared to male current smokers.
Higher education was inversely related to the hypertension and overweight (Model I) with an
odds ratio of 0.70 (0.56, 0.88) and 0.73 (0.59, 0.90) respectively for college or more as compared
to those without any education. However, for diabetes, no education was associated with lower
risk of cardiometabolic outcome as compared with all other levels of education. Average calories
per day were positively associated with urbanized diet measure in hypertension Models II and III
and overweight Model II with odds ratios of 1.22 (1,06, 1.40), 1.18 (1.00, 1.40), and 1.42 (1.25,
1.62) respectfully. However, average kcal/day was not statistically significant for the diabetes
models. Sodium was positively associated with hypertension in Model III with an odds ratio of
income and physical activity were not statistically significantly associated with cardiometabolic
outcomes.
IV. Discussion
Our findings suggest a positive association between urbanized diet with overweight and
diabetes, even after controlling for a wide range of sociodemographic and lifestyle factors related
to overall urbanization. As such, consuming an urbanized diet, composed of high fats, processed
foods, sweet snacks, and eating out was associated with higher overweight and diabetes
prevalence. However, we did not find a similar association for hypertension. In addition,
education and smoking were two variables that were associated with the cardiometabolic
outcomes.
Previous research has indicated that a Western diet has been associated with an increased
in cardiometabolic diseases across China.37 Specifically the increase in animal food
consumption, fats, alcohol, and decreased whole grains has contributed to an increase in
cardiometabolic diseases of the urban population of Chinese adults.38 Our results for overweight
and diabetes were similar to these previous studies, but we did not find the same positive
association between urbanized diet and hypertension.39 However, none of these previous studies
looked at urbanized diet overall as we did in this study. Though former studies have analyzed
associations between specific dietary items and cardiometabolic diseases, our urbanized diet
score provided a more robust look of urban diet by including both eating habits and specific
foods together. A possible reasoning for the lack of statistically significant results for
than environmental accumulation. Thus, the urbanized diet measure would be less likely to have
a strong association with hypertension without addressing genetic predisposition.
Ming Li conducted a longitudinal study from 1991-2011 using the CNHS data (n=2318)
and found an association between cardiometabolic diseases and lower education level, higher
income, and living in a more urbanized area.40 The results from this study paralleled that of our
study. With an increase in household income, there is a greater increase in money available to
purchase food and equipment, which may also explain the slight increase in average calorie
intake per day. Furthermore, urbanization index positively correlated with urbanized diet
measure validates the urbanized diet measure as a diagnostic tool in terms of measuring
urbanization. Lastly, those with a greater education are likely more informed on nutrition and the
needs to remain healthy. Therefore, our study suggests greater education can be associated as a
preventative measure for cardiometabolic diseases, while a greater income and living in a more
urbanized area can be associated with an increased risk for cardiometabolic disease. Average
kcal/day across quartiles of urbanized diet measure was not statistically significant.
On the other hand, physical activity decreases with increasing urbanized diet measure.
These results parallel previous research. Popkin suggests that more urban areas have more access
to cars and other public transportation, which can contribute to the decrease in physical activity
as urbanization increases.41
Risk of Type II diabetes has been associated with a more urbanized diet and lifestyle.42
We hypothesized that we would find a positive association between urbanized diet measure and
prevalence of diabetes in China, which we observed. Furthermore, based on our results, people
who consumed more urbanized diets had a greater association with overweight within the
Results from our study have important implications for intervention and prevention to
reduce cardiometabolic diseases. One of China’s greatest risks for its increasing cardiometabolic
diseases is the overproduction and overconsumption of processed foods. Our findings suggest
that to reduce risk of cardiometabolic diseases, particularly overweight and diabetes, preventive
and policy efforts to reduce the percentage of fat, sodium, and added sugars in processed foods
and drinks. Furthermore, fast food restaurants should be more strictly regulated and provide
alternative and healthier options for customers. Additionally, promoting more physical activity in
adults would prove beneficial to health, especially in more urbanized areas where leisure time
increased and technology has decreased need for physical movement.
Overall, the findings of our study are limited to the population of China and cannot be
extrapolated to other populations. However, it is a solid model relative to other urbanizing
countries in order to prevent cardiometabolic disease incidence that China has experienced as
China has led the world in its rapid urbanization and other countries are likely to follow a similar
pattern.
Limitations
Our greatest limitation is the self-report data from CNHS. There is always self-reporting
error in questionnaires. Another limitation is the lack of generalizability to other nations.
We were unable to capture alcohol consumption in our urbanized diet variable due to a
large proportion of missingness. Yet we know that alcohol consumption is associated with
chronic diseases. It should also be noted that the majority of the participants have Type II
variable. The estimated incidence of Type I diabetes per 100,000 per year was 1.01 as of 2013.43
Therefore, those with Type I diabetes should take up around 0.001% of the diabetes sample
group.
As the data was self-reported, the actual measure of sodium and potassium may have
been incorrect and thus, skewed results. Sodium, as the main extracellular ion of the cell, and
potassium, as the main intracellular ion of the cell, studies have long indicated that sodium and
potassium have been associated with hypertension. High levels of sodium and low levels of
potassium have a positive association with hypertension, based on a meta-analysis from the New
England Journal of Medicine of 2007.44 A low intake of potassium signals cells to increase
sodium absorption to maintain tonicity, which in turn increases blood pressure and poses a threat
for developing hypertension. The analysis concluded that a 50-100 mmol/day excess intake of
sodium and a decrease in potassium excretion by 50 mmol are both individually associated with
a greater risk in developing hypertension, but both cases together, prove to be most detrimental.
While our sodium results were statistically significant, our results for potassium were not
statistically significant within the hypertension models.
Further Research
In the future, a longitudinal study would be an interesting extension of our research.
Since cardiometabolic diseases develop overtime and one’s diet can change throughout the years,
it would be exciting and possibly more informative to conduct a longitudinal study. Our current
study assumes the preservation of dieting habits. Therefore, by including the past few decades,
we can access how diet has both changed and affected health within urbanized versus rural
Further research should focus on a longitudinal study, starting when the swift start of the
“nutrition transition” occurred in China to see how the existence of cardiometabolic diseases
have shaped during this period of rapid urbanization. Further research should attempt to
understand the role of food marketing and other urban lifestyle changes that have led to changes
in eating behaviors across the country.
Conclusion
Our cross-sectional study in China of 2015 suggests an association between urbanized
diet and diabetes and overweight prevalence in Chinese adults. We found that higher education
was inversely related to hypertension and overweight, comparing college graduates to those
without an education, while for diabetes, all levels of education were positively correlated with
the cardiometabolic outcome. Average kcal/day were positively associated with urbanized diet
measure for hypertension and overweight, but not diabetes. Furthermore, male never and former
smokers had a higher risk of cardiometabolic outcomes compared to male current smokers, while
female never smokers and ever smokers were inversely related to cardiometabolic outcomes.
Overall, our study suggests a shift in current Chinese eating and physical activity habits to
decrease risk of cardiometabolic diseases in the ever-growing urban population.
Works cited
1.“China Population.” Worldometers, www.worldometers.info/world-population/china-population/.
2. Gong, P., Liang, S., Carlton, E. J., Jiang, Q., Wu, J., Wang, L., & Remais, J. V. (2012). Urbanisation and health in China. The Lancet 379(9818), 843–852. doi: 10.1016/s0140-6736(11)61878-3.
4. Du, Shufa, Bing Lu, Fengying Zhai, and Barry M Popkin. (2002).“A New Stage of the Nutrition Transition in China. Asia Pac J Clin Nutr 2008;17 (1):123-130.
5. Zhai, F. Wang, H., Du, S., He, Y. Wang, Z., Ge, K., Popkin, B. (2009). Prospective Study on Nutrition Transition in China. Nutrition Reviews, 67(1): 56-61.
6. Baker, P., and S. Friel. (2014). Processed Foods and the Nutrition Transition: Evidence from Asia. Obesity Reviews 15(7): 564–77.
7. Manzel, A., Muller, D. N., Hafler, D. A., Erdman, S. E., Linker, R. A., & Kleinewietfeld, M. (2013). Role of “Western Diet” in Inflammatory Autoimmune Diseases. Current Allergy and
Asthma Reports, 14(1). doi: 10.1007/s11882-013-0404-6.
8. Manzel, A., Muller, D. N., Hafler, D. A., Erdman, S. E., Linker, R. A., & Kleinewietfeld, M. (2013). Role of “Western Diet” in Inflammatory Autoimmune Diseases. Current Allergy and
Asthma Reports, 14(1). doi: 10.1007/s11882-013-0404-6
9. Manzel, A., Muller, D. N., Hafler, D. A., Erdman, S. E., Linker, R. A., & Kleinewietfeld, M. (2013). Role of “Western Diet” in Inflammatory Autoimmune Diseases. Current Allergy and
Asthma Reports, 14(1). doi: 10.1007/s11882-013-0404-6
10.. Zhang, X., Lans, I. V. D., & Dagevos, H. (2011). Impacts of fast food and the food retail environment on overweight and obesity in China: a multilevel latent class cluster approach.
Public Health Nutrition, 15(1), 88–96. doi: 10.1017/s1368980011002047
11. Zhou, Y., Du, S., Su, C., Zhang, B., Wang, H., Popkin, B. (2015). The Food Retail Revolution in China and Its Association with Diet and Health.” Food Policy 55: 92–100. 12. Zhou, Y., Du, S., Su, C., Zhang, B., Wang, H., Popkin, B. (2015). The Food Retail Revolution in China and Its Association with Diet and Health.” Food Policy 55: 92–100. 13 Tian, HG., Hu, G., Dong, QN., Yang, XL., Nan, Y., Pietienen, P., Nissinen, A. (1996). Dietary Sodium and Potassium, Socioeconomic Status and Blood Pressure in a Chinese Population. Appetite 26(2):235-46.
14. Fengying, Z., Du, S., Wang, Z., Zhang, J., Du, W. Popkin, B. (2014). Dynamics of the Chinese Diet and the Role of Urbanicity, 1991-2011. Obes Rev.15(01): . doi:10.1111/obr.12124. 15. Wang, Zhihong, Fengying Zhai, Bing Zhang, and Barry M Popkin. (2012). Trends in
16. Wang, Zhihong, Fengying Zhai, Bing Zhang, and Barry M Popkin. (2012). Trends in Chinese Snacking Behaviors and Patterns and the Social-Demographic Role between 1991 and 2009. Asia Pac J Clin Nutr. 21(2): 253–262
17. Wang, Z., Zhai, F., Du, S.,Popkin, B.. (2008). Dynamic Shifts in Chinese Eating Behaviors.
Asia Pac J Clin Nutr. 7(1):123-30.
18. Wang, Youfa, Liang Wang, Hong Xue, and Weidong Qu. (2016). A Review of the Growth of the Fast Food Industry in China and Its Potential Impact on Obesity. International Journal of
Environmental Research and Public Health 13(11).
19. Tian, X., Zhong, L. Cramon-Taubadel, S., Tu, H., Wang, H. (2016). Restaurants in the Neighborhood, Eating Away from Home and BMI in China” ed. Cheng Hu. PLoS ONE 11(12): e0167721.
20. Li, X., Song, J., Lin, T., Dixon, J., Zhang, G., Ye, H.. Urbanization and health in China, thinking at the national, local and individual levels. Environ Health 15, S32 (2016)
doi:10.1186/s12940-016-0104-5.
21. Li, X., Song, J., Lin, T., Dixon, J., Zhang, G., Ye, H.. Urbanization and health in China, thinking at the national, local and individual levels. Environ Health 15, S32 (2016)
doi:10.1186/s12940-016-0104-5.
22. Popkin, B., Adair, L., Wen Ng, S. (2011). Global Nutrition Transition and the Pandemic of Obesity in Developing Countries. Nutrition Reviews 70(1): 3-21.
23. Cochrane, J., Chen, H., Conigrave, K. Hao, W. (2003). Alcohol Use in China. Alcohol &
Alcoholism 38(6): 537-542.
24. Millwood, I. Y., Li, L., Smith, M., Guo, Y., Yang, L., Bian, Z., … Liu, H. (2017). Alcohol consumption in 0.5 million people from 10 diverse regions of China: prevalence, patterns and socio-demographic and health-related correlates. International Journal of Epidemiology, 46(6): 2103–2103. doi: 10.1093/ije/dyx210
25. Hou, X., Jia, W., Bao, Y., Lu, H. Jiang, S., Zuo, Y., Gu, H., Xiang, K.. (2008). Risk Factors for Overweight and Obesity, and Changes in Body Mass Index of Chinese Adults in Shanghai.
BMC Public Health 8(389).
27. Hu, Cheng, and Weiping Jia. (2018). Diabetes in China: Epidemiology and Genetic Risk Factors and Their Clinical Utility in Personalized Medication. Diabetes 67(1): 3–11.
28. Wang, L., Gao, P., Zhang, M. Huang, Z. Zhang, D., Deng, Q., Li, Y., Zhao, Z. Qin, X. Jin, D., Zhou, M., Tang, X. Hu, Y. (2017). Prevalence and Ethnic Pattern of Diabetes and
Prediabetes in China in 2013. Jama 317(24): 2515-2523.
29. Cyr-Scully, A. (2020). Development of an Urbanized Chinese Diet Index.
30. Jones-Smith, Jessica C., and Barry M. Popkin. (2010). Understanding Community Context and Adult Health Changes in China: Development of an Urbanicity Scale. Social Science &
Medicine 71(8): 1436-1446.
31. Weng, J., Zhou, Z., Guo, L., Zhu, D., Ji, L. Luo, X., Mu, Y., Jia, W. (2018). Incidence of Type 1 Diabetes in China, 2010-13: Population Based Study. BMJ (Clinical research ed.) 360: j5295.
32. Cyr-Scully, A. (2020). Development of an Urbanized Chinese Diet Index.
33. Whelton, Paul K. et al. (2018). 2017 ACC/AHA/AAPA/ABC/ACPM/AGS/APhA/ASH/ ASPC/NMA/PCNA Guideline for the Prevention, Detection, Evaluation, and Management of High Blood Pressure in Adults: Executive Summary: A Report of the American College of Cardiology/American Heart Association Task Force on Clinical Practice Guidelines.
Hypertension 71(6): 1269–1324.
34 Wang L, Gao P, Zhang M, et al (2017). Prevalence and ethnic pattern of diabetes and prediabetes in China in 2013. JAMA 317:2515–2523.
35. Hou, X., Jia, W., Bao, Y., Lu, H. Jiang, S., Zuo, Y., Gu, H., Xiang, K.. (2008). Risk Factors for Overweight and Obesity, and Changes in Body Mass Index of Chinese Adults in Shanghai.
BMC Public Health 8(389).
36. Perez, Vanessa, and Ellen T. Chang. (2014). Sodium-to-Potassium Ratio and Blood Pressure, Hypertension, and Related Factors. Advances in Nutrition 5(6): 712–41.
38. Gong, P., Liang, S., Carlton, E. J., Jiang, Q., Wu, J., Wang, L., & Remais, J. V. (2012). Urbanisation and health in China. The Lancet, 379(9818), 843–852. doi: 10.1016/s0140-6736(11)61878-3
39. Manzel, A., Muller, D. N., Hafler, D. A., Erdman, S. E., Linker, R. A., & Kleinewietfeld, M. (2013). Role of “Western Diet” in Inflammatory Autoimmune Diseases. Current Allergy and
Asthma Reports, 14(1). doi: 10.1007/s11882-013-0404-6.
40. Odegaard, AO., Koh, WP., Yuan, JM., Gross, MD (2014). Dietary Patterns and Mortality in a Chinese Population.” The American journal of clinical nutrition 100(3): 877–83.
41. Li, M., Shi, Z. (2017). Dietary Pattern during 1991-2011 and Its Association with Cardiometabolic Risks in Chinese Adults: The China Health and Nutrition Survey. Nutrients
9(11): 1218.
42. Popkin, B., Adair, L., Wen Ng, S. (2011). Global Nutrition Transition and the Pandemic of Obesity in Developing Countries. Nutrition Reviews 70(1): 3-21.
43. Mohan, V., Radhika, G., Sathya, RM., Tamil, SR., Ganesean, A., Sudha, V. (2009). Dietary Carbohydrates, Glycaemic Load, Food Groups and Newly Detected Type 2 Diabetes among Urban Asian Indian Population in Chennai, India (Chennai Urban Rural Epidemiology Study 59). British Journal of Nutrition 102(10): 1498–1506.
44. Pappachan, JM., Chacko, EC., Arunagirinathan, G., Sriraman, R. (2011). Management of Hypertension and Diabetes in Obesity: Non-Pharmacological Measures. International Journal of
Hypertension.
45. Cyr-Scully, A. (2020). Development of an Urbanized Chinese Diet Index.
46. Jones-Smith, Jessica C., and Barry M. Popkin. (2010). Understanding Community Context and Adult Health Changes in China: Development of an Urbanicity Scale. Social Science &
Medicine 71(8): 1436-1446.
47. Cyr-Scully, A. (2020). Development of an Urbanized Chinese Diet Index.
48. Adrougué, HJ., Madias, N. (2007). Sodium and Potassium in the Pathogenesis of Hypertension. New England Journal of Medicine. 356:1966-1978.
Cardiology/American Heart Association Task Force on Clinical Practice Guidelines.
Hypertension 71(6): 1269–1324.
50. Wang L, Gao P, Zhang M, et al (2017)..Prevalence and ethnic pattern of diabetes and prediabetes in China in 2013. JAMA 317:2515–2523.
51. Hou, X., Jia, W., Bao, Y., Lu, H. Jiang, S., Zuo, Y., Gu, H., Xiang, K.. (2008). Risk Factors for Overweight and Obesity, and Changes in Body Mass Index of Chinese Adults in Shanghai.
BMC Public Health 8(389).
52. Jones-Smith, Jessica C., and Barry M. Popkin. (2010). Understanding Community Context and Adult Health Changes in China: Development of an Urbanicity Scale. Social Science &
Medicine 71(8): 1436-1446.
53. Adrougué, HJ., Madias, N. (2007). Sodium and Potassium in the Pathogenesis of Hypertension. New England Journal of Medicine. 356:1966-1978.
54. Whelton, Paul K. et al. (2018). 2017 ACC/AHA/AAPA/ABC/ACPM/AGS/APhA/ASH/ ASPC/NMA/PCNA Guideline for the Prevention, Detection, Evaluation, and Management of High Blood Pressure in Adults: Executive Summary: A Report of the American College of Cardiology/American Heart Association Task Force on Clinical Practice Guidelines.
Hypertension 71(6): 1269–1324.
55. Hou, X., Jia, W., Bao, Y., Lu, H. Jiang, S., Zuo, Y., Gu, H., Xiang, K.. (2008). Risk Factors for Overweight and Obesity, and Changes in Body Mass Index of Chinese Adults in Shanghai.
BMC Public Health 8(389).
56. Wang L, Gao P, Zhang M, et al (2017). Prevalence and ethnic pattern of diabetes and prediabetes in China in 2013. JAMA 317:2515–2523.
57. Cyr-Scully, A. (2020). Development of an Urbanized Chinese Diet Index.
58. Adrougué, HJ., Madias, N. (2007). Sodium and Potassium in the Pathogenesis of Hypertension. New England Journal of Medicine. 356:1966-1978.
59. Whelton, Paul K. et al. (2018). 2017 ACC/AHA/AAPA/ABC/ACPM/AGS/APhA/ASH/ ASPC/NMA/PCNA Guideline for the Prevention, Detection, Evaluation, and Management of High Blood Pressure in Adults: Executive Summary: A Report of the American College of Cardiology/American Heart Association Task Force on Clinical Practice Guidelines.
60. Hou, X., Jia, W., Bao, Y., Lu, H. Jiang, S., Zuo, Y., Gu, H., Xiang, K.. (2008). Risk Factors for Overweight and Obesity, and Changes in Body Mass Index of Chinese Adults in Shanghai.
BMC Public Health 8(389).
61. Wang L, Gao P, Zhang M, et al (2017). Prevalence and ethnic pattern of diabetes and prediabetes in China in 2013. JAMA 317:2515–2523.
62. Adrougué, HJ., Madias, N. (2007). Sodium and Potassium in the Pathogenesis of Hypertension. New England Journal of Medicine. 356:1966-1978
63. Whelton, Paul K. et al. (2018). 2017 ACC/AHA/AAPA/ABC/ACPM/AGS/APhA/ASH/ ASPC/NMA/PCNA Guideline for the Prevention, Detection, Evaluation, and Management of High Blood Pressure in Adults: Executive Summary: A Report of the American College of Cardiology/American Heart Association Task Force on Clinical Practice Guidelines.
Hypertension 71(6): 1269–1324.
64. Hou, X., Jia, W., Bao, Y., Lu, H. Jiang, S., Zuo, Y., Gu, H., Xiang, K.. (2008). Risk Factors for Overweight and Obesity, and Changes in Body Mass Index of Chinese Adults in Shanghai.
BMC Public Health 8(389).
65. Wang L, Gao P, Zhang M, et al (2017). Prevalence and ethnic pattern of diabetes and prediabetes in China in 2013. JAMA 317:2515–2523.
Tables and Figures
Table 1: Variables included in the Urbanized Diet Measure* - China Health and Nutrition
Survey Wave 2015
Fridge Household owns refrigerator
Microwave Household owns microwave
Fruit % calories consumed from fruit
Nuts and Seeds % calories consumed from nuts and seeds
Sweet Snacks % calories consumed from sweet snacks
All Snacks Avg # all snacks / day
Eggs % calories consumed from eggs
Dairy % calories consumed from dairy
Fried Food % calories consumed from fried foods
Eating Out % calories consumed from fruit
High-fat Meat % calories consumed from high-fat meat
Carbohydrates % calories consumed from carbohydrates (3-day avg)
Fat % calories consumed from fats (3-day avg)
Animal Products % calories consumed from animal sources
*Urbanized diet measure was constructed using food, dietary habits, and cooking tools related to urbanized diet lifestyle factors45
Table 2: Physical and SES Characteristics of Sample - China Health and Nutrition Survey Wave 2015*
Age 51.5 15.1
Sex Male 42.6% 0.5
Female 57.4%
Education None 7.4%
Primary School or Less 24.0%
Primary school 54.1%
College or more 14.5%
Region North 17.9%
Central 40.6%
South 41.5%
* The China Health and Nutrition Survey (CNHS) is a cross-sectional study, wave 2015 (n=13,981 with exclusions)
Table 3: Lifestyle behaviors, China Health and Nutrition Survey Wave 2015*
Variable Mean Std deviation
Sex - male %† Overall 42.6%
Current smokers 58.8%
Former smokers 7.5%
Never smokers 33.7%
Sex - female % Overall 57.4%
Ever smokers 4.3%
Urbanization index‡ 72.5 17.7
Urbanized Diet Measure§ 19.6 8.1
Household income (k)| 79.0 119.1
3-day avg kcal¶ 1842.1 623.9
Physical Activity (Total METs/wk) 162.2 171.5
* The China Health and Nutrition Survey (CNHS) is a cross-sectional study, wave 2015 (n=13,981 with exclusions)
† Due to strong correlation between smoking status and gender, they were included as a combination variable to control for both factors
‡ Urbanized index defined as urbanization in China, as defined by Jones-Smith and Popkin with data from CNHS.46 § Urbanized diet measure was constructed using food, dietary habits, and cooking tools related to urbanized diet lifestyle factors47
| Per capita total gross HH income (k) inflated to 2015 ¶ 3-Day Ave.: Energy (kcal)
Total METs/wk from all PA (5 domestic PA) with estimated value
Table 4: Percentage of Hypertension, Type II Diabetes, Overweight, China Health and Nutrition Survey Wave 2015*
Cardiometabolic Disease Percent
Hypertension† 58.1%
Diabetes‡ 9.1%
Overweight§ 48.1%
* The China Health and Nutrition Survey (CNHS) is a cross-sectional study, wave 2015 (n=13,981 with exclusions)
† Hypertension is defined as having blood pressure greater than 130/80 mmHg48,49
Table 5: Sociodemographic and lifestyle factors across quartiles of urbanized diet China Health and Nutrition Survey Wave 2015*
Low urbanized diet measure (0-14)† Low-moderate urbanized diet measure quartile (15-20)‡ Moderate-high urbanized diet measure quartile (21-25)§ High urbanized diet measure quartile|(26-44)
P-value for test of differences
between quartiles¶
Age 53.4 (15.0) 51.8 (15.2) 51.1 (15.1) 51.3 (15.1) <0.0001
Sex Male 48.2% 48.5% 48.1% 43.3% <0.0001
Female 51.8% 51.5% 51.9% 56.7%
Education None 12.2% 7.6% 5.1% 3% <0.0001
Primary School or
Less
31.9% 27.0% 21.0% 14.2%
Primary School
50.9% 54.5% 56.6% 57.4%
College or more
5.0% 10.9% 16.5% 25.4%
Region North 17.2% 18.7% 17.0% 19.9% <0.0001
Central 45.8% 33.9% 34.6% 44.4%
South 37.0% 47.4% 48.4% 35.6%
Sex-smoke Female
Never Smoke
54.1% 53.6% 54.2% 58.3% <0.0001
Male Never Smoke
13.3% 14.0% 13.9% 16.4%
Female Ever Smoke
3.0% 3.2% 3.7% 1.8%
Male Former
Smoke
2.8% 3.1% 3.7% 3.3%
Male Current
Smoke
Urbanization index 62.1 (16.8) 71.2 (17.2) 75.9 (16.1) 82.6 (13.1) <0.0001
Household income (k) 62.0
(100.4)
77.3 (142.1) 78.8 (91.7) 99.4 (125.5) <0.0001
3-day avg kcal 1,828.3
(657)
1,847.5 (641.6)
1,859.7 (617.8)
1,862.6 (578.1)
0.0546
Physical Activity (Total
METs/wk)
184.0 (197.9) 162.4 (172.1)
151.2 (158.7)
128.9 (136.9)
<0.0001
Hypertension 61.8% 58.9% 57.5% 57.2% <0.0001
Overweight 46.2% 48.3% 50.1% 49.8% 0.003
Diabetes 7.8% 8.9% 9.8% 10.9% <0.0001
* The China Health and Nutrition Survey (CNHS) is a cross-sectional study, wave 2015 (n=13,981 with exclusions)
†Urbanized diet measure score (0-14) n= 4,469
‡ Urbanized diet measure score (15-20) n= 4,056
§ Urbanized diet measure score (21-25) n= 3,304
| Urbanized diet measure score (26-44) n= 3,789
¶ ANOVA testing was used for continuous variables and chi-squared testing was used for categorical variables
Due to strong correlation between smoking status and gender, they were included as a combination variable to control for both factors
Urbanized index defined as urbanization in China, as defined by Jones-Smith and Popkin with data from CNHS.52
. Per capita total gross HH income (k) inflated to 2015 3-Day Ave.: Energy (kcal)
. Total METs/wk from all PA (5 domestic PA) with estimated value
Hypertension is defined as having blood pressure greater than 130/80 mmHg53, 54
For an individual to be considered overweight, the Chinese define it has having a BMI ≥24kg/m255
Diabetes was based on fasting glucose greater than 126 mg/dL, medications, or self-diagnosis.56
Table 6: Odds ratios (95% Confidence Intervals) Cardiometabolic Outcomes Associated with a 1 Standard Deviation Change in Urbanized Diet Measure*
Model I† Model II‡ Model III§
Odds Ratio (CI) (0.95, 1.05) (0.95, 1.05) (0.95, 1.05)
Overweight¶
Odds Ratio (CI):
1.08 (1.03, 1.13) 1.07 (1.02, 1.12) ---Diabetes
Odds Ratio (CI):
1.15 (1.07, 1.25)
1.15 (1.06, 1.24)
--* Urbanized diet measure was constructed using food, dietary habits, and cooking tools related to urbanized diet lifestyle factors57
† Controlling for sex, age, region, education, per capita household income
‡ Controlling for smoking/gender combination, region, education, per capita household income, physical activity,
3-day average daily kcal intake
§ Controlling for smoking, sex, and the interaction between smoking and sex, region, education, per capita household income, physical activity, 3-day average daily kcal intake, sodium, and potassium
| Hypertension is defined as having blood pressure greater than 130/80 mmHg58, 59
¶ For an individual to be considered overweight, the Chinese define it has having a BMI ≥24kg/m260
Diabetes was based on fasting glucose greater than 126 mg/dL, medications, or self-diagnosis.61
Table 7: Odds ratios (95% Confidence Intervals) Cardiometabolic Outcomes Associated with a 1 Standard Deviation Change in Urbanized Diet Measure - with Covariates
Hypertension* Odds Ratio (CI) Overweight† Odds
Ratio (CI)
Diabetes‡ Odds Ratio (CI)
Model I§ Model II|
Model
III¶
Model I Model II Model I Model II
Urbanized Diet Measure (1 SD unit) 1.00 (0.95, 1.05) 1.00 (0.95, 1.05) 1.00 (0.95, 1.05) 1.08 (1.03, 1.13) 1.07 (1.02, 1.12) 1.15 (1.07, 1.24) 1.15 (1.06, 1.24)
Sex 0.59
(0.54, 0.64) 0.56 (0.48, 0.65) 0.56 (0.48, 0.65) 0.87 (0.81, 0.94) 0.66 (0.58, 0.76) 0.78 (0.68, 0.90) 0/87 (0.68, 1.10)
Sex- smoke Male current
smoke
Female never smoke 0.64 (0.58, 0.71) 0.65 (0.59, 0.72 1.06 (0.97, 1.17) 0.79 (0.67, 0.94) Male never smoke -- 1.08 (0.95, 1.24) 1.08 (0.94, 1.24) -- 1.42 (1.25, 1.62)
-- 0.98 (0.78, 1.23) Female ever smoke -- 0.52 (0.39, 0.69) 0.53 (0.40, 0.70) -- 0.86 (0.67, 1.10)
-- 1.08 (0.73, 1.60) Male former smoke -- 1.40 (1.06, 1.84) 1.40 (1.06, 1.84) -- 1.31 (1.04, 1.64)
-- 1.17 (0.84, 1.62) Age 1.06 (1.05, 1.06) 1.06 (1.05, 1.06) 1.06 (1.05, 1.06) 1.01 (1.00, 1.01) 1.01 (1.00, 1.01) 1.05 (1.04, 1.06) 1.05 (1.04, 1.06)
Region North Ref Ref Ref Ref Ref Ref Ref
Central 1.02 (0.82, 1.27) 0.99 (0.80, 1.24) 0.99 (0.8, 1.22) 0.71 (0.60, 0.83) 0.67 (0.57, 0.78) 0.77 (0.63, 0.95) 0.78 (0.62, 0.95) South 0.60 (0.48, 0.74) 0.58 (0.47, 0.72) 0.59 (0.48, 0.73) 0.53 (0.45, 0.62) 0.51 (0.44, 0.60) 0.68 (0.54, 0.84) 0.69 (0.55, 0.86)
Education None Ref Ref Ref Ref Ref Ref Ref
Primary school or less 1.12 (0.94, 1.35) 1.10 (0.92, 1.33) 1.12 (0.94, 1.36) 1.07 (0.91, 1.26) 1.07 (0.91, 1.25) 1.46 (1.10, 1.94) 1.47 (1.10, 1.95)
Primary school 0.93 (0.77, 1.11) 0.91 (0.76, 1.10) 0.922 (0.764, 1.11) 0.99 (0.84, 1.12) 0.97 (0.82, 1.15) 1.67 (1.25, 2.24) 1.66 (1.24, 2.22)
College or more 0.70 (0.56, 0.88) 0.69 (0.55, 0.87) 0.70 (0.56, 0.89) 0.73 (0.59, 0.90) 0.70 (0.57, 0.86) 1.35 (0.93, 1.96) 1.31 (0.90, 1.91)
HH income (k) (1 SD unit) 1.03
(0.99, 1.07) 0.99 (0.96, 1.04) 1.03 (0.98, 1.07) 0.99 (0.96, 1.04) 0.99 (0.99, 1.00) 0.97 (0.89, 1.06) 0.97 (0.89, 1.06)
METs/wk) (1 SD unit) (0.92, 1.00) (0.98, 1.07) (0.99, 1.00) 1.00)
Average kcal/day (1 SD unit) -- 1.22
(1.06, 1.40) 1.18 (1.00, 1.40) -- 1.42 (1.25, 1.62)
-- 1.02 (0.81, 1.26)
Sodium (mg/day) (1 SD unit) -- -- 1.07
(1.02, 1.12)
-- -- --
--Potassium (mg/day) (1 SD unit) -- -- 0.97
(0.92, 1.03)
-- -- --
--* Hypertension is defined as having blood pressure greater than 130/80 mmHg62, 63
† For an individual to be considered overweight, the Chinese define it has having a BMI ≥24kg/m264 ‡ Diabetes was based on fasting glucose greater than 126 mg/dL, medications, or self-diagnosis65
§ Controlling for sex, age, region, education, per capita household income
| Controlling for smoking/gender combination, region, education, per capita household income, physical activity, 3-day average daily kcal intake
¶ Controlling for smoking, sex, and the interaction between smoking and sex, region, education, per capita household income, physical activity, 3-day average daily kcal intake, sodium, and potassium
Urbanized diet measure was constructed using food, dietary habits, and cooking tools related to urbanized diet lifestyle factorsa
“Male” used as reference group
. “Male current smoke”” used as reference group; due to strong correlation between smoking status and gender, they were included as a combination variable to control for both factors
North region used as reference group
No education used as reference group
Per capita total gross HH income (k) inflated to 2015
Total METs/wk from all PA (5 domestic PA) with estimated value 3-Day Ave.: Energy (kcal)