Analysis of Color Images using Cluster based
Segmentation Techniques
Amrita Mohanty
School of Computing Science and Engineering VIT University, Vellore
Zameer Muzaffar Mir
School of Computing Science and Engineering VIT University, Vellore
S Rajkumar
School of Computing Science and Engineering VIT University, Vellore
Puja Bardhan
School of Computing Science and Engineering VIT University, Vellore
ABSTRACT
Image segmentation divides an image into several constituent components such as color, structure, shape, and texture. It forms a major research topic for many image processing researchers as the applications are endless. Its applications include image enhancement, object detection, image retrieval, image compression, and medical image processing to name a few. The segmentation of color images is necessary for efficient pattern recognition and feature extraction involving various color spaces such as RGB, HSV and CIE L*A*B*, etc. This paper describes the different cluster based segmentation techniques used for segmenting the different color images and the resultant is analyzed with subjective and objective measures. Initially, registered color images are considered as input. Then the cluster based segmentation techniques namely K-Means clustering, Pillar-Kmeans clustering and Fuzzy C-means (FCM) clustering techniques are applied. Further, the segmented image is analyzed with measures such as compactness and execution time. From the experimental results, it has been observed that K-means and Pillar-Kmeans are the most suitable techniques for RGB, HSV and LAB color spaces than the FCM technique.
Keywords
Image Segmentation, Color Spaces, Clustering, Compactness
1.
INTRODUCTION
Image segmentation is an essential component of image analysis and pattern recognition system. It is one of the most difficult tasks in image processing and determines the quality of the final result of analysis. During the segmentation, a digital image is partitioned into set of pixels where pixels in a region are similar according to some criteria such as color, intensity or texture, so as to locate and identify objects and boundaries in an image. The color based segmentation attracts more and more attention mainly because color images can provide more information than gray level images and use of color images in PCs and computers are increasing rapidly [2]. The work in this paper was motivated from the fact that the accuracy in segmentation of a color image depends not only on the algorithm used but also on the color space selected. Effective segmentation is achievable through clustering. The main purpose of this paper is to evaluate the performance of these clustering algorithms in order to determine which of them returns optimal results in the color extraction process. Cluster partitions pixel set into several groups such that the intra-class similarity is maximized and inter-class similarity is minimized.
In the proposed system, initially natural images are taken from the Berkley Image Segmentation Database (BSD). Five
different images are chosen which will be worked upon involving three different color spaces namely RGB, HSV and CIEL*A*B. Then the image segmentation technique is applied to segment the image. Three clustering algorithms namely K-means, Pillar-Kmeans and Fuzzy C-means (FCM) group pixels that are spatially connected and have similar colors in the same region. The resultant segmented images are first compared qualitatively based on human evaluation; then, analytically based on execution time of the algorithms; finally, quantitatively based on the analysis of compactness of the clusters formed which is calculated using variance. The rest of this paper will be organized as follows. Section II deals with literature survey and gives a brief description of the segmentation techniques with its merits and demerits, and quantitative metrics for evaluation of segmented image. Section III illustrates the system design and explains each step in the process in detail. Section IV explains the results and performance evaluation. Finally, Section V provides concluding remarks.
2.
LITERATURE SURVEY
Image segmentation being the most critical step in image processing much research work has been done for developing techniques for segmenting images to obtain detailed information. However, there is still no general theory for image segmentation. So, this developmental work has been progressive.
Several general-purpose techniques and algorithms have been developed for image segmentation. In order to show their effectiveness these techniques must typically be combined with a domain's specific knowledge and solve the domain's segmentation problems. Thus, classification of these techniques for image segmentation also becomes an essential and pivotal task. According to reference [3], the image segmentation techniques have been divided into four groups such as thresholding, edge detection, region extraction and clustering (a multi-dimensional extension of thresholding).
2.1
Segmentation Techniques
The different types of segmentation techniques are discussed with their advantages, limitations and applications. These techniques are suitable for color imaging as well.
2.1.1
Thresholding
which the property equals or exceeds a threshold. From a grayscale image, thresholding can be used to create binary images. Thresholding methods can be classified into several categories such as entropy-based, Otsu’s method, and k-means clustering.
Advantage- Simple to implement and fast (especially if repeating on similar images) and can be quickly adapted to occur over multiple frames, while maintaining their single pass efficiency.
Disadvantage- It may be difficult to identify significant peaks and valleys in the image and gives no guarantee of object coherency—may have holes, external pixels, etc.
2.1.2
Edge-based Segmentation
Edge-based segmentation refers to the process of identifying and locating sharp discontinuities in an image. The discontinuities are abrupt changes in pixel intensity which characterize boundaries of objects in an image. The assumption made here is that the boundary of a region or an object is closed and also that the number of objects that are interesting are equal to the number of boundaries in an image. For the purpose of precision, the perimeter of the boundaries detected must be approximately equal to that of the object in the input image. There are a large number of edge detection operators available and each of them is designed to be sensitive to certain types of edges.
Advantage-Able to enclose large areas and can be used to avoid a bias in the size of the segmented object without using a complex thresholding scheme.
Disadvantage-Edge detectors perform poorly in presence of noise. Some other problems that are centered on the use of gradient to detect the boundaries are edge-less, very noisy, boundary those are very smooth, texture boundary.
2.1.3
Region-based Segmentation
In region-based segmentation, objects are defined as regions of pixels which have homogeneous characteristics. Region based segmentation partition the pixels according to their similarities such as color, intensity, texture or patterns that are unique to each type of region and have spatial connectedness. The assumption made in this method is that the partitions that are formed correspond to objects or meaningful parts of the image.
Advantages-Region growing methods can properly separate the regions that have the same properties we define. Good segmentation results for images with good connectivity. Disadvantage- It is time-consuming and failure to adjust the homogeneity/similarity criteria accordingly will produce undesirable results such as the segmented region may be smaller or larger than the actual, over or under-segmentation of the image and fragmentation.
2.1.4
Clustering
In cluster-based image segmentation objects or patterns are classified in such a way that samples of the same group are more similar to one another than samples belonging to different groups. Several clustering strategies have been used such as the hard clustering scheme and the fuzzy clustering scheme, each of which has its own characteristics.
2.2
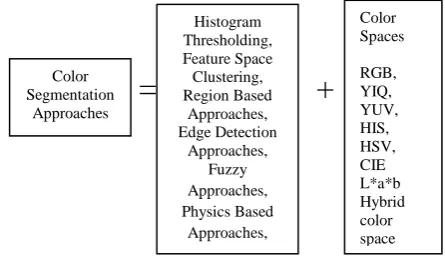
COLOR IMAGE SEGMENTATION
The literature on color image segmentation is not as extensively present as that on monochrome image
approaches with different color representations, as shown in Fig. 1.
[image:2.595.314.537.101.231.2]
= +
Fig 1: Commonly used color image segmentation approaches
Most gray level image segmentation techniques can also be employed to color images, such as thresholding, clustering, region growing, edge detection, fuzzy approaches and neural networks. Also, these segmentation methods can be directly applied to each component of a color space and then the results can be combined to obtain a final segmentation result.
There is no single color representation that can be said to have stood out from others for segmenting all kinds of color images. Segmentation, thus, may be looked at as an image classification problem based on color and spatial features. There is not one image segmentation technique or algorithm but several. The same can be said about color systems. In most of the existing color image segmentation approaches, the definition of a region is based on similarity of color. Thresholding is easier as it requires only the intensity levels to set up a threshold value and then compare. Clustering has proved to be the most effective segmentation technique till date. The fuzzy logic has attracted more and more attention in the field of image processing. The k-means and pillar k-means take centroids’ positions by calculating the accumulated distance metric between each data point and all previous centroids. Thus, the approach for image segmentation opted by this paper will help to realise the performance of the mentioned clustering methods.
3.
SYSTEM DESIGN
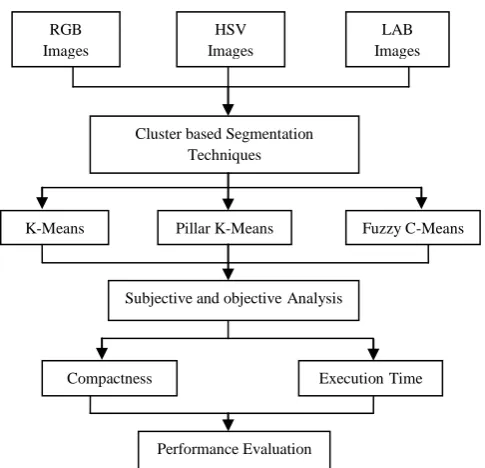
The objective of this research was to compare the effectiveness of three clustering methods involving RGB, HSV and CIE L*a*b* color spaces for a variety of real color images. The methods were: K-Means clustering algorithm, Pillar-Kmeans algorithm and Fuzzy C-means (FCM) clustering methods. Clustering algorithms were evaluated on natural images and their performance was compared. To evaluate these three techniques, the Compactness(C) and the execution time were calculated. Here C amounts to how closely the objects in the cluster are related, a lower value indicates a better technique. In the standpoint of execution time, our intention was to study the computational time of all the algorithms in all the color spaces. An overall view of system design is shown in Fig. 2.
Color Segmentation
Approaches
Histogram Thresholding, Feature Space Clustering, Region Based
Approaches, Edge Detection
Approaches, Fuzzy Approaches, Physics Based
Approaches,
Color Spaces
Fig 2: An overall view of system design
3.1
K-means Clustering
The K-means [6] is one of the simplest unsupervised learning algorithms .The procedure follows an easy way to classify a given data set through a certain number of clusters (assume k clusters) fixed apriori. The main idea is to define k centroids, one for each cluster. The K-Means method is numerical, non-deterministic and iterative.
3.1.1
K-means algorithm
Input:
Dataset, D = {d1, d2,...,dn} //set of n data points.
k //set of desired clusters
Output:
A set of k clusters.
Algorithm
Step1: Arbitrarily choose k data-items from D which serve as initial group of centroids.
Step2: Calculate the distance (Euclidean) from the data point to each cluster.
Step3: If the data point is closest to its own cluster, nothing needs to be done else move it into the closest cluster.
Step4: Repeat the step2 and step3 until convergence criteria is met. At this point the clusters are stable and the clustering process ends.
The choice of initial partition can greatly affect the final clusters that result, in terms of inter-cluster and intra-cluster distances and cohesion [7].
3.2
Pillar K-means Clustering
Because of initial starting points generated randomly, using K-means algorithm it is difficult to reach global optimum which will lead to incorrect clustering results [1]. These obstacles in K-means have been addressed by specifying a procedure to initialize the cluster centers before proceeding with the standard k-means optimization iterations [8].
3.2.1
Pillar K-Means algorithm
Input:
Dataset, D = {d1, d2,...,dn} //set of n data points.
k //set of desired clusters
Output:
A set of k clusters.
Algorithm
Step1: One centroid is uniformly chosen at random from among the data points.
Step2: For each data point z, the distance D(z), between z and the nearest chosen centroid is computed.
Step3: One new data point is chosen at random as a new center, using a weighted probability distribution where a point z is chosen with probability proportional to D(z)².
Step4: The 2 and 3 steps are repeated until k centers have been chosen.
Step5: Now that the initial centers have been chosen, one can proceed using standard k- means clustering.
3.3
Fuzzy C-means Clustering
Fuzzy C-means [8] (FCM) is a class of algorithms for cluster analysis where the allocation of data points to clusters is not "hard" (all-or-nothing) but "fuzzy". It allows one piece of data to belong to two or more clusters. This method is frequently used in pattern recognition. With fuzzy c-means, the centroid of a cluster is computed as being the mean of all points, weighted by their degree of belonging to the cluster [4].
3.3.1
The Fuzzy C-Means algorithm
It is based on minimization of the following objective function:
P x Q y y x c xyc
A
M
Q
B
1 1
2
1<=c< ∞
(1)
where c is any real number greater than 1, Axy is the degree of
membership of Mx in the cluster y, Mx is the xth of
d-dimensional measured data, Qy is the d-dimension center of
the cluster, and ||*|| is any norm expressing the similarity between any measured data and the center.
Step1: Initialize A= [ ] matrix, A(0)
Step2: At k-step: calculate the central vectors Q(k)=[ ] with A(k)
P x c xy P x x c xy yA
M
A
Q
1 1(2)
Step3: Update A(k) , A(k+1)
Q k c k x y x xyQ
M
Q
M
A
1 1 21
(3)
RGB Images HSV Images LAB ImagesCluster based Segmentation Techniques
K-Means Pillar K-Means Fuzzy C-Means
Subjective and objectiveAnalysis
Compactness ExecutionTime
Step4: If || A(k+1) - A(k)||< threshold then STOP; otherwise return to step2.
3.4
Evaluation Techniques
Based on whether a human evaluator assesses the segmented image visually or not, evaluation methods can be divided into two major categories: Subjective Evaluation and Objective Evaluation.
3.4.1
Subjective Evaluation
A human evaluator based on his/her perception and vision will evaluate the effectiveness of the techniques used for image segmentation process. Based on how clear the regions contrast appears to be to the eye. The disadvantage of such methods is that visual or qualitative evaluations are inherently subjective and thus may vary from person to person.
3.4.1.1
Analytical Methods
Analytic methods assess segmentation algorithms independently of their output, evaluating them based on certain properties of the segmentation algorithms, such as processing strategy. For evaluation of our work we have studied the time taken for the image segmentation results for all the three color spaces for a similar number of iterations.
3.4.2
Objective Evaluation
Unsupervised evaluation is quantitative and objective [1]. We have used the following measure for the same.
3.4.2.1
Compactness
The performance of a clustering algorithm within a given color space can be evaluated from the quality of the resulting clusters in that space. The process of evaluating the quality of a cluster is referred to as cluster validation which measures relative closeness among the objects in a cluster. A group of measures evaluate cluster compactness based on variance. Lower variance indicates better compactness.
4.
EXPERIMENTAL RESULTS
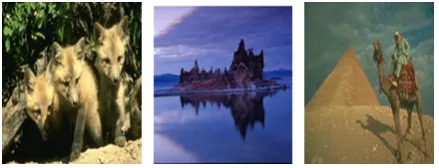
The cluster-based segmentation techniques were tested with 3 color images acquired from the Berkley Image Segmentation Database (BSD). The images are of size 481X321 with uniform resolution. These images include different varieties, such as landscape, animals and architecture with different scale of goals in the images.
The source images are shown in Fig 3 and the segmented images in RGB, HSV and CIEL*A*B color spaces are shown in Fig 4-6. For all the clustering techniques, the range for the number of clusters was taken as k= {3, 5, 7} based on the number of distinct features.
Fig 3: Input images derived from the Berkley Segmentation database (a) cats (b) lake (c) pyramids.
(a)
(b) (c) (d)
(e) (f) (g)
[image:4.595.53.273.595.679.2]
(h) (i) (j)
Fig 4: Subjective segmentation results: (a) original image cats;
RGB segmentation with following clustering methods: (b ) K-Means (c) Pillar-Kmeans and (d) FCM; HSV segmentation with following clustering methods: (e)
K-Means (f) Pillar-Kmeans and g) FCM; LAB segmentation results with following clustering methods: (h) K-Means, (i) Pillar-Kmeans and (j) FCM
methods.
(a)
(e) (f) (g)
(h) (i) (j)
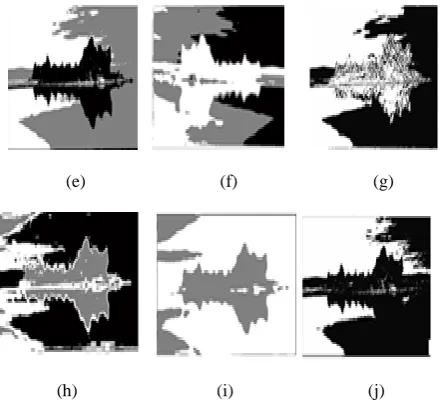
Fig 5: Subjective segmentation results: (a) original image lake;
RGB segmentation with following clustering methods: (b ) K-Means, (c) Pillar-Kmeans and (d) FCM; HSV segmentation with following clustering methods: (e)
K-Means, (f) Pillar-Kmeans and g) FCM; LAB segmentation results with following clustering methods: (h) K-Means, (i) Pillar-Kmeans and (j) FCM
methods.
(a)
(b) (c) (d)
(e) (f) (g)
[image:5.595.55.278.92.293.2]
(h) (i) (j)
Fig 6: Subjective segmentation results: (a) original image pyramids;
RGB segmentation with following clustering methods: (b) K-Means, (c) Pillar-Kmeans and (d) FCM ; HSV segmentation with following clustering methods: (e)
K-Means, (f) Pillar-Kmeans and g) FCM; LAB segmentation results with following clustering methods: (h) K-Means, (i) Pillar-Kmeans and (j) FCM
methods.
The images were tried with subjective analysis such as visualization and execution time. From the experimental results obtained, analysis showed that Pillar-Kmeans clustering technique required less time than the K-Means and FCM clustering techniques. For getting this result we had taken the mean over 10 runs of the code. The Fig 7 shows the graph of execution time measure, where x-axis represents the color images and y-axis indicates the corresponding value derived from the specific measure for each of the segmentation techniques.
[image:5.595.315.535.402.595.2]Fig 7: Performance comparison of execution time.
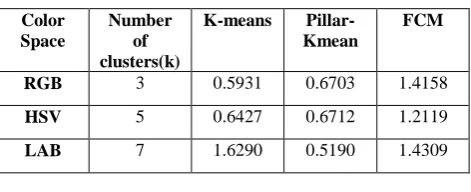
Table I Calculation of variance objective measure of segmented images using different techniques for cats
image
Color Space
Number of clusters(k)
K-means Pillar-Kmean
FCM
RGB 3 0.5931 0.6703 1.4158
HSV 5 0.6427 0.6712 1.2119
LAB 7 1.6290 0.5190 1.4309
Table II Calculation of variance objective measure of segmented images using different techniques for Lake image
Color Space
Number of clusters(k)
K-means Pillar-Kmean
FCM
RGB 3 0.4318 0.6328 1.3855
HSV 5 0.6541 0.5951 1.5127
LAB 7 0.6693 0.4916 1.4395
Table III Calculation of variance objective measure of segmented images using different techniques for pyramids
image
Color Space
Number of clusters(k)
K-means Pillar-Kmean
FCM
RGB 3 0.5370 0.5809 1.5037
HSV 5 0.6175 0.5998 1.5040
LAB 7 0.7003 0.7468 1.4968
5.
CONCLUSION
In this paper, three different cluster based segmentation techniques performed on 3 different color images were analyzed by testing their performance through subjective and objective measures. The experimental result showed that Pillar-Kmeans provided better results than the other two techniques using subjective (visualization and execution time) measure for RGB, HSV and LAB color spaces. The compactness based on variance measure value was less for K-means technique in RGB color space while Pillar-KK-means technique for HSV and LAB images proved to show better quality result than FCM technique.
From the results we ranked that the projected segmentation techniques in this paper as Pillar-Kmeans, K-means and FCM for efficient pattern recognition, content based image retrieval and objection detection applications for RGB, HSV and LAB color spaces.
6.
REFERENCES
[1] Ali Ridho Barakbah and Yasushi Kiyoki, “A New Approach for Image Segmentation using Pillar-Kmeans Algorithm”, International Journal of Information and Communication Engineering , Vol.6 No.2, pp.83-88, 2010.
[2] Samira Chebbout, Hayet Farida Merouani, “Comparative Study of Clustering Based Color Image Segmentation Techniques”, Eighth International Conference on Signal Image on Signal Image Technology and Internet Based Systems, pp.839-844, 2012.
[3] Yong Yang, Shuying Huang, “Image Segmentation by Fuzzy C-means Clustering Algorithm with a Novel Penalty Term”, Computing and Informatics, vol. 26, pp. 17–31, 2007.
[4] D.Jude hemanth, D.Selvathi and J.Anitha, “Effective Fuzzy Clustering Algorithm for Abnormal MR Brain Image Segmentation”, IEEE International Advance Computing Conference, pp.609-614, 2009.
[5] Chen-Kuei Yang, Wen-Hsiang Tsai, “Reduction of color space dimensionality by moment-preserving thresholding and its application for edge detection in color images” Pattern Recognition Letters, Vol.17, pp.481-490, 1996.
[6] K.A. Abdul Nazeer, M.P.Sebastian, “Improving the Accuracy and Efficiency of the K-means Clustering Algorithm”, Proceedings of the World Congress on Engineering, Vol I, 2009.
[7] Siddheswar Ray, Rose H. Turi and Peter E.Tischer, “Clustering-based Colour Image Segmentation: An Evaluation Study”, Proceeding of Digital Image Computing: Techniques and Applications, pp.86-92, 1995.
[8] Gregory A. Hance, Scoot E. Umbaugh, Randy H. Moss and William V. Stoecker, “Unsupervised Color Image Segmentation with application to skin tumor borders”, IEEE Engineering in Medicine and Biology, pp.104-111, 1996.
[9] Rafael C. Gonzalez, Richard E. Woods, “Digital Image Processing”, Second Edition, Prentice Hall, 2007.