Improving the Intrusion Detection using Discriminative
Machine Learning Approach and Improve the Time
Complexity by Data Mining Feature Selection Methods
Karan Bajaj
Chitkara UniversityHimachal Pradesh
Amit Arora
Chitkara university Himachal PradeshABSTRACT
As the dependence of daily life is increasing on Internet technology, the attacks on the systems, servers are also rapidly increasing. The motives of attacks are to steal the confidential data from the systems or making the system unavailable to the authorised users. An effective approach is required to detect the intrusions to provide the defence to the Networks. First we applied the feature selection to reduce the dimensions of NSL-KDD data set. By feature reduction and machine learning approach we able to build Intrusion detection model to find attacks on system and improve the intrusion detection using the captured data. The intrusion detection accuracy of learning algorithms is also performed on the data set, without the level 21 attacks which is most easy to identify attacks, using learning algorithms and the success rate of proposed model is calculated over the attacks which are hard to detect.
General Terms
Detection accuracy, Pattern Recognition, Security and Machine learning.
Keywords
Feature Selection, Weka, NSL-KDD data set, Accuracy, Intrusion detection, Machine learning.
1.
INTRODUCTION
With the increasing dependence of human over the Internet technology and worldwide web, it becomes challenging to secure the information and confidential data flowing over the network. The valuable information attracts more attackers and is always prone to maximum attacks over the network. Intrusion may occur due to system vulnerabilities or security breaches, such as system misconfiguration, user misuse, or program defects. So with the growing threat of attackers over the network the effective intrusion detection is needed to
anomaly on which evaluation is performed with a total of 24 training attack types in the train set [8], with an additional 14 types [8] in test data. This makes the detection more realistic, because now the model is also checked for the unknown attacks.
In NSL-KDD [2] data set both train and test data is marked with numbers as 1 to 21 which represents the severity of the attacks. The attacks which are numbered as 21 is most easy to detect by the learning algorithms [8]and attacks which are marked as 1 are most difficult to identify, other falls in between. NSL-KDD [2] data set also contain a subset which does not include records with difficulty level of 21 out of 21.
3.
PREVIOUS RESEARCH
researchers had applied single algorithm to detect all the attack types or they had used cross validation on data set which is good only for the detection of already known attacks. The researchers that have used the NSL-KDD [2] data set with multiple machine algorithms did not try further any attribute selection measures to improve the accuracy. This motivated us for our assumption that using NSL-KDD [2] data set with different training and test sets separately and attribute selection with different machine learning algorithms will yield good performance and high prediction for detection of attacks including unknown attacks as well.
The detection accuracy is also checked for the attacks which are difficult to identify in the data set. For this the NSL-KDD [2] subset as a test set is used which does not include records with difficulty level of 21. This is a special data set which does not include the attacks which can be easily identified through learning algorithms. In our approach we use a same training set which contains all kind and difficulty level of attacks and two separate test sets one with all difficulty level of attacks and another in which attacks which can be easily detected are already removed that is having difficulty level of 21. By using this special data set we can learn the behavior of our proposed model over the attacks which hard to detect.
5.
ATTRIBUTE SELECTION
MEASURES
For the attribute selection, different feature selection algorithms are used they find the contribution of the 41 features in NSL-KDD [2] data set in intrusion detection. Feature selection reduces the features from the data set without affecting the effective indicators of system attacks.
5.1
Information Gain Attribute Evaluation
InfoGainAttributeEval evaluates the worth of an attribute by measuring the information gain with respect to the class [9].
Info (G) = - 𝑚𝑖=1𝑝ilog2(𝑝𝑖)
Here Information gain G is calculated by calculating the probality of occurrence of class over total classes in data set.
5.2
Gain Ratio Attribute
It uses an extension to the information gain uses the gain ratio [9]
Gain Ratio (A) = Gain (A)/Split Info (A)
This value represents the potential information generated by splitting the training data set.
5.3
Correlation Attribute Evaluation
Correlation specifies dependence of feature on each other. It represents the linear relationship between the variables or features.
B A N i i i B A N i i i ABN
B
A
N
b
a
N
B
b
A
a
r
1 1Here N is the number of tuples, 𝑎𝑖 and 𝑏𝑖 is the respective values of A and B in tuple i, A and B are the respective mean values of A and B, 𝜎A and 𝜎B are the respective standard
deviations of A and B [9]. The value of rA,,B lies between -1
and 1. If A and B are completely correlated, rA,B takes the
value of 1 if A and B are inversely correlated then rA,B takes
value of -1and if A and B are totally independent then rA,B is
zero.
6.
IMPLEMENTATION SETUP &
METHODLOGY
From feature selection and machine learning algorithms the results will be obtained through which we can identify and predict the machine learning techniques that helps to distinguish between alerts, attacks and normal data. Our purpose is to suggest a learning model to reduce the false alarms and improves detection of attacks.
Fig1: Implementation setup model
This test is also performed on the NSL-KDD [2] data set without the 21 level of difficulty to check the Intrusion detection accuracy on attacks which are difficult to indentify
Feature Selection
For the attribute selection, the different feature selection methods are:
6.1.1
Information Gain Attribute Evaluation
Algorithm
Information Gain Attribute Evaluation, we process the NSL-KDD [2] train set and retrieves the results. This algorithm use rankers method on features and evaluate the feature by ranking them from most important to least important.
Fig2: Information Gain Attribute Evaluation
6.1.2
Gain Ratio Attribute Evaluation Algorithm
We use training data and apply Gain Ratio Attribute Evaluation algorithm on data, this algorithm use rankers method on features and evaluate the feature by ranking them.
Information gain measure is biased towards tests with many outcomes. Gain Ratio prefers to select attributes having a large number of values. It uses an extension to the information gain.
Fig.3 Gain Ratio Attribute Evaluation
6.1.3
Correlation Attribute Evaluation Algorithm
Correlation Attribute Evaluation, this algorithm rank the features in NSL-KDD [2] train set based on their correlation
with each other, correlation specify dependence of feature on each other.
0 0.2 0.4 0.6 0.8 1 1.2 1.4 1.6
Information gain
Information gain
0 0.2 0.4 0.6 0.8 1
1.2
Gain Ratio
Gain Ratio
0.2 0.4 0.6 0.8
Based on this outcome these features are removed from the training and all the test data sets.
6.2
Discriminative Machine learning
Algorithms
On the reduced data set we applied several discriminative machine learning algorithms, now training set are given to train the machine learning algorithms and test data set is given separately. Using separate train and test set give us advantage to check the accuracy of detection of attacks even on unknown attacks, because training set contain 24 attack types [8] and test set contain additional 14 attacks with previous 24 attacks . This makes the detection more accurate, because now the model is also checked for the unknown attacks.
6.2.1
NaïveBayes
The NaiveBayes [10] classifier provides a approach, to represent and learn the probalistic knowledge [11].
6.2.2
J48
Is a tree classifier in Weka Tool [12], it is a version of C4.5 algorithm which was developed by Quinlan [13].
6.2.3
NB Tree
NBTree [14] builds a naive Bayes classifier on each leaf node of the built decision tree,which just integrates the advantages of the decision tree classifiers and the Naive Bayes classifiers [15].
6.2.4
Multilayer Perception
It is a neural network classification algorithm [11].
6.2.5
LibSVM
Support Vector Machines are supervised learning models with algorithms that analyze the data and recognize the patterns. LIBSVMis integrated software for support vector classification, regression and distribution estimation. It supports multi-class classification [16].
6.2.6
SimpleCart
Cart stands for classification and regression. Cart has the ability to generate the regression trees. It enables users to provide prior probability distribution [17].
7.
RESULTS & PERFORMANCE
COMPARISON
Table1 is representing the results, without feature selection on NSL-KDD [2] data set with 41 features and 1 class of Labels. The result in terms of accuracy of detection for various learning algorithms from previous benchmarks is shown, except SimpleCart algorithm that is not used in previous benchmark paper.
Table 1. Detection accuracy without feature selection** Indicates information not provided by the author in their
respective paper.
Classifier(Discrimitive Machine Learning
Algorithms) Accuracy (%) Detection
Incorrectly Classified Instances
J48 [8] 81.05 **
Naïve Bayes [8] 76.56 **
NB Tree [8] 82.02 **
Multi-layer Perception
[8] 77.41
**
SVM [8] 69.52 **
SimpleCart 80.3229 19.6771
[image:4.595.311.548.98.383.2]Table 2 is representing the results, after feature selection on NSL-KDD [2] data set. Now the feature is reduced from 41 features to 33 features and 1 class of Labels. The result is compared with previous benchmarks shown in Table 1.
Table 2. Detection accuracy after feature selection
Classifier(Discrimitive Machine Learning
Algorithms) Accuracy (%) Detection
Incorrectly Classified Instances
J48 81.9375 18.0625
Naïve Bayes 75.7851 24.2149
NB Tree 80.6778
19.3222
Multi-layer Perception 73.5495
26.4505
LibSVM 71.0211 28.9789
[image:4.595.307.549.441.700.2]7.1
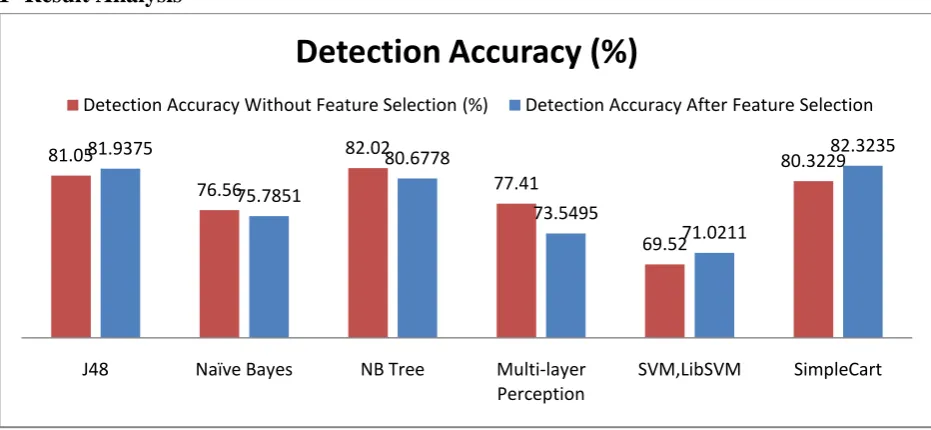
Result Analysis
Fig.5 is representing the comparative analysis in terms of detection accuracy with and without feature selection.
The result shown in Fig.5 is representing the detection accuracy of maximum 82.3225 percent. By analyzing the result from Fig.5 it can be said that by applying feature selection detection accuracy over the attacks are increased and SimpleCart is most preferred algorithm for detection of Intrusions. But it also includes the attacks which can be easily detectable by any machine learning algorithm which is labeled as 21 in NSL-KDD [2] data set.
Therefore the same test is also performed on the another NSL-KDD [2] data set without 21 level of difficulty, but the training data set will remain unchanged and only test set will be changed.
Table 3 is representing the results, without feature selection on NSL-KDD [2] data set without 21 level of difficulty in which hard to detect attacks are removed. The result from previous benchmarks is shown, except SimpleCart algorithm that is not used in previous benchmark paper.
Table 3. Accuracy on Data Set without 21 level of difficulty ** Indicates information not provided by the
author in their respective paper.
Classifier(Discrimitive Machine Learning
Algorithms)
Detection Accuracy (%)
Incorrectly Classified Instances
J48 [8] 63.97 **
Table 3 shows that the intrusion detection rate of learning algorithms has decreased drastically in case we remove the easily detectable attacks from the NSL-KDD [2] data set.
Table4. Accuracy after feature selection on Data Set without 21 level of difficulty.
Classifier(Discrimitive Machine Learning
Algorithms)
Detection Accuracy
(%)
Incorrectly Classified Instances
J48 65.654 34.346
Naïve Bayes 54.2532 45.7468
NB Tree 63.6287 36.3713
Multi-layer Perception 56.2869 43.7131
LibSVM 44.8439 55.1561
SimpleCart 66.7764 33.2236
Table 4 is representing the results, after feature selection on NSL-KDD [2] data set. Now the features is reduced from 41
81.05
76.56
82.02
77.41
69.52
80.3229 81.9375
75.7851
80.6778
73.5495
71.0211
82.3235
J48 Naïve Bayes NB Tree Multi-layer
Perception
SVM,LibSVM SimpleCart
Detection Accuracy (%)
7.2
Result Analysis
Fig6: is representing accuracy detection rate. The comparative analysis is shown with and without feature selection.
The result shown in Fig.6 shows that after reducing the features the detection accuracy also improves on attacks which are hard to detect.
8.
CONCLUSIONS
In this paper we propose model for intrusion detection, that suggest, for the detection of intrusion it is not necessary to perform the test on all the 41 features of NSL-KDD [2] data set. First by using feature selection the features are reduced to 33 features and further by removing the features, the biasing of learning algorithms towards the frequent and easily detectable records in the data set is reduced. And the suggested machine learning algorithm after selection process is SimpleCart for the intrusion detection that leads to improve the computer security alerts from computer security incidents using machine learning techniques.
This model is also checked on attacks which are hard to detect, using same training data set, we found that simple cart again shows improvement in detection rate accuracy. When we compare the percentage wise improvement of SimpleCart algorithm from table1 and table2 there is improvement of around 2%. This result also contains the attacks which are easy to detect.
When we compare the percentage wise improvement of SimpleCart algorithm from table 3 and table 4 there is improvement of around 4%. In this result, attacks which are easy to detect are removed.
Therefore by looking the improvement percentage we can say that SimpleCart algorithm performs more well on Intrusions which are hard to detect on system.
9.
FUTURE SCOPE
The proposed model can be checked on different data sets, for intrusion detection to establish the new benchmarks on Intrusion detection.
10.
REFERENCES
[1] Chia-Mei Chen, Ya-Lin Chen, Hsiao-Chung Lin 2010. “An efficient network intrusion detection”, Elsevier, vol. 33 (4), pp. 477- 484.
[2] “Nsl-kdd data set for network-based intrusion detection systems. Available on: http://nsl.cs.unb.ca/NSL-KDD/, March 2009.
[3] KDD Cup 1999. Available on:
http://kdd.ics.uci.edu/databases/kddcup99/kddcup99.html [4] Meera Gandhi G., Kumaravel, A., Srivatsa, S.K., 2010. “Effective Network Intrusion Detection using Classifiers Decision Trees and Decision rules” Int. J. Advanced Networking and Applications, vol.2 (3), pp. 686. [5] Aarthy, R. and Marikkannu,P., 2012. “Extended security
for intrusion detection system using data cleaning in large database” International Journal of Communications and Engineering, vol. 2(2), pp.56-60.
[6] Guy Helmer, Johnny, S. K. W., Honvar, V., Miller, Wang, Y., 2010. “Lightweight agents for intrusion detection”, Journal of systems and Software. Elsevier, vol 67(2), pp.109-122.
[7] Sperotto, A., Gregor Schaffrath, Sadre, R., Morariu, C., Aiko Pras, and Stiller, B., 2010. “An Overview of IP Flow-Based Intrusion Detection” IEEE communications surveys & tutorials, vol. 12(3): pp. 343
[8] Mahbod Tavallaee, Ebrahim Bagheri, Wei Lu, and Ali, A., Ghorbani, 2009 “A Detailed Analysis of the KDD CUP 99 Data Set” IEEE Symposium on computational intelligence in security and defence application.
[9] Jiawei Han and Micheline kamber: Data Mining Concepts and Techniques ,Publisher Elsevier, 2001, pp.67-69,296-301.
63.97
55.77
66.16
57.34
42.29
62.6245 65.654
54.2532
63.6287
56.2869
44.8439
66.7764
J48 Naïve Bayes NB Tree Multi-layer
Perception
SVM,LibSVM SimpleCart
Detection Accuracy(%)
[10]John, G.H., Langley, P., 1995 “Estimating Continuous Distributions in Bayesian Classifiers” In Proc. Of 11th
Conference on Uncertainty in Artificial Intelligence. [11]Huy Anh Nguyen and Deokjai Choi., 2008 “Application
of Data Mining to Network Intrusion Detection: Classifier Selection Model”, Springer-Verlag Berlin Heidelberg,LNCS 5297, pp. 399–408.
[12]“Waikato environment for knowledge analysis (weka) version 3.6.9. and 3.7.9”Available on :http://www.cs.waikato.ac.nz/ml/weka/
[13]Quinlan, J.: C4.5: 1993. Programs for Machine Learning, Publisher Morgan Kaufmann, San Mateo.
[14]Kohavi, R., “Scaling up the accuracy of naive-bayes classifiers: A decision-tree hybrid,” ser. Proceedings of
the Second International Conference on Knowledge Discovery and Data Mining. AAAI Press, 1996, pp. 202– 207.
[15]Liangxiao Jiang, and Chaoqun Li., 2011. “Scaling Up the Accuracy of Decision-Tree Classifiers: A Naive-Bayes Combination,” Journal of Computers, vol. 6 (4), pp.1325-1331.
[16]Chih-Chung Chang and Chih-Jen Lin, “LIBSVM : a library for support vector machines,” ACM Transactions on Intelligent Systems and Technology, 2:27:1--27:27,
2011. Software available at
http://www.csie.ntu.edu.tw/~cjlin/libsvm
![Table 2 is representing the results, after feature selection on NSL-KDD [2] data set. Now the feature is reduced from 41 features to 33 features and 1 class of Labels](https://thumb-us.123doks.com/thumbv2/123dok_us/8066796.778158/4.595.311.548.98.383/representing-results-feature-selection-feature-reduced-features-features.webp)