R E S E A R C H
Open Access
First-pass perfusion CMR two days after infarction
predicts severity of functional impairment six
weeks later in the rat heart
Daniel J Stuckey
1,2*, Carolyn A Carr
1, Stephanie J Meader
1, Damian J Tyler
1, Mark A Cole
1and Kieran Clarke
1Abstract
Background:In humans, dynamic contrast CMR of the first pass of a bolus infusion of Gadolinium-based contrast agent has become a standard technique to identify under-perfused regions of the heart and can accurately demonstrate the severity of myocardial infarction. Despite the clinical importance of this method, it has rarely been applied in small animal models of cardiac disease. In order to identify perfusion delays in the infarcted rat heart, here we present a method in which a T1weighted MR image has been acquired during each cardiac cycle. Methods and results:In isolated perfused rat hearts, contrast agent infusion gave uniform signal enhancement throughout the myocardium. Occlusion of the left anterior descending coronary artery significantly reduced the rate of signal enhancement in anterior regions of the heart, demonstrating that the first-pass method was sensitive to perfusion deficits.In vivo measurements of myocardial morphology, function, perfusion and viability were made at 2 and 8 days after infarction. Morphology and function were further assessed using cine-MRI at 42 days. The perfusion delay was larger in rat hearts that went on to develop greater functional impairment, demonstrating that first-pass CMR can be used as an early indicator of infarct severity. First-pass CMR at 2 and 8 days following infarction better predicted outcome than cardiac ejection fraction, end diastolic volume or end systolic volume. Conclusion:First-pass CMR provides a predictive measure of the severity of myocardial impairment caused by infarction in a rodent model of heart failure.
Background
Non-invasive,in vivomeasurements of cardiac morphol-ogy, viability and function have revolutionised our understanding of cardiac disease [1-3]. In combination, echocardiography, angiography, PET, SPECT, CT and CMR can be used to measure wall and valve motion, cavity volumes, aortic and coronary blood flows, tissue perfusion and cardiac metabolism [1-5]. CMR offers excellent soft tissue contrast, coupled with high tem-poral and spatial resolution, allowing accurate measure-ment of cavity volumes, wall thickness and ejection fraction. Further, infarct size and transmurality, mea-sured using CMR shortly after systemic infusion of the contrast agent gadolinium-diethylenetriaminepentaace-tate (DTPA), strongly correlates with progression to
heart failure and patient mortality [2,5-8]. MR imaging of the first-pass of a bolus infusion of Gd-DTPA has become a standard clinical method for identifying under-perfused regions of the human heart and accu-rately predicts the severity of myocardial ischemia [9-14].
Scaling down imaging techniques to study the ever increasing number of small animal disease models has been a formidable challenge [15]. The rat model of myo-cardial infarction, induced by occlusion of the left ante-rior descending coronary artery, is widely used and has provided data essential for the development of surgical and pharmacological therapy [16]. However, the left ventricular mass of the rat heart (~500 mg) is approxi-mately three hundred times smaller than the human left ventricle (~150 g), and contracts 5 to 10 times faster, making it necessary to use high field strengths, smaller voxel sizes and rapid gating strategies.
* Correspondence: [email protected]
1
Department of Physiology, Anatomy and Genetics, University of Oxford, Parks Road, Oxford, UK
Full list of author information is available at the end of the article
Small animal cine-MRI has identified increased left ventricular mass, end diastolic and end systolic volumes in the infarcted heart during progressive cardiac remo-deling [17]. Pharmocologiical and biological therapies have been extensively tested in this model system [16,18]. However, owing to the variability of infarct size induced by experimental myocardial infarction, it is use-ful to have a baseline measure of infarcted heart func-tion prior to administrafunc-tion of the therapeutic agent. Acute changes to left ventricular mass and volume, typi-cally made using echocardiography, are not good predic-tors of functional outcome, making these frequently used experimental methods for assessing acute infarct severity inaccurate. A more robust early measure of dis-ease severity may be obtained from late gadolinium enhancement (LGE) CMR [19] or perfusion imaging. LGE-CMR identifies tissue damage due to increased contrast agent retention within infarcted areas of caused by cell membrane rupture and increased interstitial space [3,5]. These processes occur within hours of infarction, so offer good early predictors of infarct sever-ity. An even earlier indicator of the extent of functional impairment may be offered by perfusion imaging because it is the reduced perfusion that ultimately results in cell necrosis, membrane rupture, reduced con-tractility, remodeling and heart failure [10]. Myocardial perfusion has been imaged using arterial spin labeling and T1 mapping [20-23], but imaging the first-pass of a Gd-bolus infusion has rarely been used to study small animal models of myocardial infarction [24,25], probably owing to the need for ultra-fast and high-resolution imaging [20].
Here, we have developed a method to identify perfu-sion deficits in infarcted rat hearts during bolus infuperfu-sion by acquiring a T1 weighted MR image every cardiac cycle, both in the isolated perfused heart and in vivo. Perfusion delay and myocardial viability, morphology and function were measured in vivo at 2 and 8 days after infarction to compare with cardiac function mea-sured in the same animals at 42 days.
Methods
Experimental design
For ex vivo MRI studies of isolated, perfused hearts, control female Wistar rat hearts (n = 12) were isolated, perfused and imaged as described below. Hearts were then removed from the magnet, the coronary artery occluded, the heart repositioned and re-imaged (n = 8).
For in vivoMRI studies, baseline cine-MRI was per-formed prior to surgery. Female Wistar rats (n = 34) underwent myocardial infarction followed by in vivo first-pass imaging, cine- and LGE-CMR at 2 and 8 days. Problems with i.v. infusions, owing to unsuccessful tail vein cannulation, movement of cannulae during
positioning of rats within the magnet and blood clots or air bubbles in the drug line, meant that first-pass ima-ging could not be performed on all 34 rats at each time point (2 days, n = 21; 8 days, n = 27; both 2 and 8 days, n = 14). After 9 days, 7 of the rats that were imaged at 2 and 8 days were sacrificed; hearts were isolated, per-fused and imaged ex vivo. The remaining 27 rats (14 and 20 of which had had first-pass imaging at 2 and 8 days respectively) underwent cine-MRI at 42 days. The University of Oxford Animal Ethics Review Com-mittees and the Home Office (London, UK) approved all procedures.
Ex vivoMRI of isolated, perfused hearts
Hearts were excised from control (n = 12) or infarcted (n = 7) rats, arrested in ice-cold Krebs-Henseleit buffer and attached to a cannula by the ascending aorta. Hearts were perfused at 85 mmHg with filtered Krebs-Henseleit buffer containing 11 mM glucose and 1.8 mM pyruvate. Buffer was maintained at 37°C and pH 7.4, aerated with 95% O2/5% CO2 and not re-circulated, to avoid contrast agent accumulation. A balloon connected to a pressure transducer was placed in the left ventricu-lar (LV) cavity, inflated to an end diastolic pressure of 4 mmHg and used to measure cardiac function. The heart was placed in a 20 mm NMR tube and lowered into the centre of a vertical-bore, 11.7 T MR magnet (Magnex Scientific, Oxon, United Kingdom) with a 20 mm1H birdcage coil (Rapid Biomedical, Würzburg, Germany) and a Bruker console (Bruker Medical, Ettlin-gen, Germany) running Paravision 2.1.1. Perfusion was then switched to a constant flow of 15-20 ml/min, based on each heart’s coronary flow at 85 mmHg.
Coronary occlusion model of myocardial infarction Rats (n = 34) were anesthetized with 2.5% isoflurane in O2, intubated, and a thoracotomy was performed. The pericardium was removed and the heart was infarcted by ligation of the left anterior descending coronary artery (LAD), approximately 2 mm from the origin, using a 5-0 proline suture [26].
In vivoCMR
Rats were anesthetized with 2.5% isoflurane in O2 and positioned supine in a purpose-built cradle. ECG elec-trodes were inserted into the forepaws, a respiration loop was taped across the chest and heart and respira-tion signals were monitored using a custom-built phy-siological motion gating device [27]. The cradle was lowered into a vertical-bore, 11.7 T MR system with a 52-mm birdcage coil (Rapid Biomedical, Würzburg, Ger-many) and a Bruker console running Paravision 2.1.1.
First-pass CMR was performed on a single short axis slice, which encompassed the papillary muscles, using a fast gradient echo sequence that acquired one image per heart beat (TE/TR, 0.8/2 ms; ~60° pulse; field of view 40 × 40 mm; slice thickness 1.5 mm; matrix size 64 × 64, zero filled to 256 × 256). The flip angle was adjusted to null sig-nal in the myocardium before bolus infusion. A bolus of 0.5 mg/kg Gd in 200-270μl saline was infused via the tail vein in 2 seconds during image acquisition. This volume, derived fromex vivodata, was ten times greater than that used inex vivoexperiments asin vivocardiac output (75-100 ml/min) was 5 times greater than ex vivo perfusion rate (15 - 20 ml/min) and infusion time was 2 seconds
in vivoand less than 1 secondex vivo
Cardiac cine-MRI was performed 10 to 25 min after Gd infusion as described [28]. A stack of contiguous 1.5 mm thick true short-axis ECG and respiration-gated cine-FLASH images (TE/TR 1.43/4.6 ms; 25° pulse; field of view 51.2 × 51.2 mm; matrix size 256 × 256; voxel size 200 × 200 × 1500μm; 25 to 35 frames per cardiac cycle (mean heart rate 360 ± 20 bpm), were acquired to cover the entire left ventricle. Long-axis two-chamber and four-chamber images were also acquired. The relatively high flip angle (25°) of the cine-MRI acquisition allowed LGE-CMR to be assessed from the same stack of cine images, similar to the method recently described and validated by Prottiet al[29]. The entirein vivoimaging protocol was performed in approximately 60 minutes.
MRI data analysis
Image analysis was performed by an operator blinded to the surgical procedure performed on the rats using Ima-geJ (NIH Image, Bethesda, MD). Left ventricular volumes and ejection fractions were calculated from the stack of cine images as described [18]. To determine the area of akinetic scar tissue, the average endocardial and
epicardial length of akinetic tissue in cine images were measured in each slice, summed across all slices and multiplied by slice thickness (1.5 mm) to give the abso-lute scar size as described by Nahrendorf et al [17] Per-fusion was assessed by analyzing the change in signal intensity during Gd infusion in regions of interest (ROIs) selected in the infarcted anterior myocardium, adjacent to the infarct in the peri-infarcted lateral region and in the remote tissue of the inferior wall of the left ventricle. The relative rate of perfusion delay was mea-sured as the time from inflow of contrast agent to the LV cavity, to 90% of the maximum signal intensity in the ROI. Fromex vivo perfusion measurements, it was possible to measure the rate of contrast inflow and efflux from the gradient of the signal intensity/time curve. The area of reduced perfusion on the stack of ex
vivo images was identified as myocardium with signal intensity greater than two standard deviations below that of remote myocardium.
In vivoLGE-MR images were thresholded to two stan-dard deviations above the mean signal intensity from remote tissue. The volume and perimeter (endocardial length of the enhanced region) of the hyperenhanced region was traced manually and expressed as a percen-tage of total LV volume or perimeter.
Data and statistical analysis
Results are shown as means ± standard errors. Differ-ences were considered significant at P < 0.05 using unpaired Student t-tests or ANOVAs for repeated mea-sures. Dependence between two measures was assessed using Pearson’s Correlations.
Results
First-pass cardiac perfusion imaging in isolated, perfused rat hearts
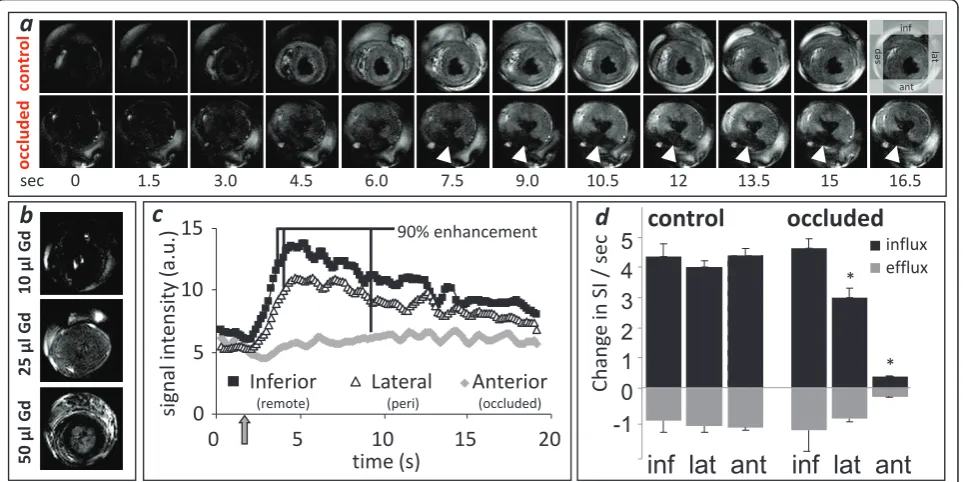
clearance of the Gd bolus from the myocardium was calculated as the gradient of the signal intensity/time curve from 10 to 15 seconds after bolus infusion. No differences in Gd efflux between regions were observed (Figure 1d).
Perfused hearts were then removed from the magnet and the LAD occluded (successful occlusion in 8 of 12 hearts). Areas of low perfusion were identified below the occluded LAD as non-enhanced regions on MR images acquired during the Gd bolus infusion (Figure 1a). Perfu-sion delay (PD), calculated as the delay between time to 90% enhancement in an ROI compared with the remote inferior wall (Figure 1c), was significantly longer in the infarcted anterior wall (3.47 ± 0.65 s, p < 0.001) and the peri-infarcted lateral wall (0.81 ± 0.49 s, p < 0.05). The gradient of signal intensity increase was significantly lower in the infarcted (0.40 ± 0.02 a.u./s, p < 0.05) and peri infarcted (3.00 ± 0.20 a.u./s, p < 0.05) regions com-pared with remote regions (4.65 ± 0.30 a.u./s, Figure 1d). The rate of Gd clearance was also significantly lower in anterior myocardial regions affected by LAD occlusion (infarct, -0.28 ± 0.04, peri-infarct -1.00 ± 0.20, remote -1.40 ± 0.68 a.u./s, Figure 1d). Saturated gradient echo images, acquired up to 50 min after coronary occlusion found no evidence of LGE in the perfused infarcted hearts.
In vivofirst-pass perfusion imaging of infarcted rat hearts Cardiac morphology and function
Cine-MRI measurements of cardiac morphology and function were made serially on rats prior to and at 2, 8 and 42 days after infarction (Table 1). Left ventricular mass, end diastolic volume (EDV), end systolic volume (ESV) and body weight were significantly increased at 8 and 42 days after infarction. Ejection fraction (EF) was reduced by 2 days, whereas stroke volume and cardiac output were depressed at 2 days, but returned to normal levels by 8 days. The percentage of akinetic myocardium and heart rates did not change from 2 to 42 days. First-pass cardiac perfusion imaging 2 and 8 days post infarction
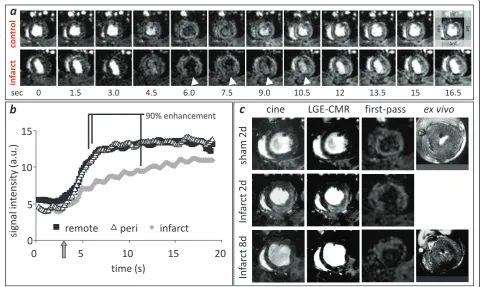
Infusion of Gd initially reduced signal in the LV cavity owing to T1 and T2 shortening of blood from the high concentration of contrast agent (Figure 2a). This made it impossible to measure an arterial input function. However, signal in the myocardium became enhanced shortly after cavity hypoenhancement, as contrast agent perfused through the coronary circulation. Slight cyclical elevations in myocardial signal intensity occurred due to respiratory motion. Even though the image acquisition time continued through much of the cardiac cycle, car-diac motion did not prevent measurement of contrast inflow. Imaging of first-pass perfusion in rat hearts
10
ђ
l Gd
0
5
10
15
0
5
10
15
20
Inferior
(remote)Lateral
(peri)Anterior
(occluded)time (s)
signal in
ten
sity
(a.u.)
90% enhancement
25
ђ
l Gd
50
ђ
l Gd
efflux influx
LQIODWDQW
control occluded
Chang
e
in SI
/ sec
control
occl
uded
0 1.5 3.0 4.5 6.0 7.5 9.0 10.5 12 13.5 15 16.5
sec
*
*
LQIODWDQW
a
b
c
d
inf
ant
se
p la
[image:4.595.59.541.90.331.2]t
identified areas of perfusion deficit in the region affected by the LAD coronary artery occlusion (Figure 2a, b). The average perfusion delay in infarct and peri-infarct compared with remote tissue was 4.0 ± 0.7 and 1.7 ± 0.4 s at 2 days post infarction and 3.3 ± 0.5 and 0.5 ± 0.3 s at 8 days post infarction.
Late Gadolinium enhancement imaging 2 and 8 days post infarction
LGE-CMR was performed 10-25 min after first-pass imaging. Hyperenhancement was present in 18 ± 2% of
the LV volume and 19 ± 2% of LV endocardial peri-meter at 2 days post infarction, and 11 ± 1% of the LV volume and 16 ± 2% of LV endocardial perimeter at 8 days post infarction (Figure 2c).
[image:5.595.58.540.100.236.2]For the sub-group of infarcted rats (n = 14) in which tail vein canulation was successful at both time points, first-pass CMR and LGE-CMR were performed at both 2 and 8 days post infarction. Perfusion delay (measured using first-pass CMR) and LGE-CMR endocardial scar perimeter were unchanged from 2 to 8 days (Table 2).
Table 1In vivomeasurements of rat heart morphology and function before and at 2, 8 and 42 days after infarction (n = 27)
Pre 2 days 8 days 42 days
Left ventricular mass (mg) 492 ± 35 543 ± 18* 571 ± 15* 586 ± 16*#
End diastolic volume (μl) 265 ± 12 282 ± 11 395 ± 15*# 428 ± 24*#+
End systolic volume (μl) 55 ± 8 108 ± 5* 154 ± 13*# 185 ± 19*#+
Stroke volume (μl) 210 ± 9 174 ± 8* 241 ± 7# 243 ± 11#
Ejection fraction (%) 80 ± 2 62 ± 1* 62 ± 2* 58 ± 2*#+
Akinetic myocardium (mm2) - 16 ± 4* 23 ± 5*# 28 ± 6*#+
Akinetic myocardium (%) - 9 ± 2* 10 ± 2* 11 ± 2*
Heart rate (bpm) 404 ± 11 361 ± 9 344 ± 27 346 ± 26
Cardiac output (ml/min) 85 ± 5 61 ± 3* 83 ± 3# 80 ± 3#
Weight (g) 234 ± 11 214 ± 3 230 ± 5 245 ± 19
* p < 0.05 compared with pre-infarction.#
p < 0.05 compared with 2 days.+
p < 0.05 compared with 8 days,
control
in
farct
0 1.5 3.0 4.5 6.0 7.5 9.0 10.5 12 13.5 15 16.5
sec
0
5
10
15
0
5
10
15
20
time (s)
signal in
ten
sity
(a.u.)
infarct
remote
peri
cine LGE-CMR first-pass
ex vivo
9d
In
fa
rc
t
8d
In
fa
rc
t
2d
sham 2d
90% enhancement
a
b
c
inf
ant
se
p la
t
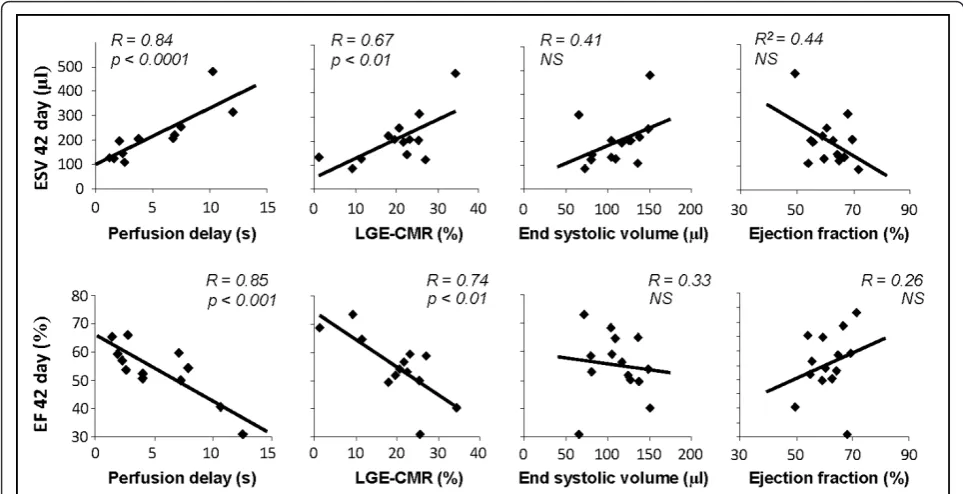
[image:5.595.58.540.396.683.2]However, there was a significant reduction in LGE-CMR scar size (measured as % LV volume) between 2 and 8 days (19 ± 3 and 10 ± 2% respectively, p< 0.01; Figure 3 and Table 2) and in absolute scar size (100 ± 18μl at 2 days vs. 56 ± 11 μl at 8 days,p< 0.01). Correlations between MRI measurements at 2 and 8 days and ejection fractions and end systolic volumes at 42 days Perfusion delays measured at 2 days post infarction cor-related with left ventricular end systolic volumes (R =
0.84, P < 0.0001) and ejection fractions (R = 0.85, P < 0.001) measured at 42 days (Figure 4), suggesting that rats with acute perfusion deficit went on to develop greater chronic cardiac impairment. As anticipated, infarct size measured using LGE-CMR at 2 days post infarction correlated with left ventricular end systolic volumes (R = 0.67, P < 0.01) and ejection fractions (R =
0.74, P < 0.01) measured at 42 days (Figure 4). However, correlations between infarct size and EF or ESV were lower than those found using first-pass CMR. At 2 days, perfusion delay gave a better prediction of outcome than cine MRI measurements of morphology and func-tion, with no correlation between 2 day end systolic volumes and ejection fractions and the end systolic
volumes and ejection fractions measured at 42 days. Perfusion delay measured at 8 days post infarction also correlated with ESV (R = 0.76, P < 0.05) and EF (R =
0.63, P< 0.05) at 42 days. Again, these correlations were stronger than those between LGE-CMR, ESV and EF at 8 days and the resulting ejection fractions and end sys-tolic volumes measured at 42 days (data not shown). First-pass cardiac perfusion imaging in isolated, perfused infarcted rat hearts
Nine days after infarction, 7 rat hearts were excised, perfused in Langendorff mode and imaged. Infusion of 25μl Gd into the perfusate proximal to the aorta gave uniform signal enhancement throughout the remote myocardium, whereas infarcted regions showed only limited enhancement (Figure 2c). Signal intensity/time curves plotted from images acquired at the same loca-tion in vivo andex vivo showed similar characteristics and resulted in similar measurements of perfusion delay (in vivo = 2.9 ± 2.1s, ex vivo = 2.8 ± 0.8s, correlation;
R2 = 0.7. p < 0.05). The gradient of signal intensity
increase was significantly lower in the infarcted and peri infarcted regions compared with remote tissue (infarct, 0.38 ± 0.03, peri 2.36 ± 0.42, remote 4.31 ± 0.91, p < 0.01), while the rate of Gd clearance was significantly lower in infarcted regions compared with remote (infarct, 0.05 ± 0.04, peri 0.25 ± 0.08, remote 0.44 ± 0.05). These experiments also indicated that the volume of reduced perfusion measured ex vivo matched the volume of LGE measured in vivo (Additional file 1). Interestingly, saturated gradient echo images performed 10 to 50 minutes after Gd infusion found no evidence of LGE in the perfused infarcted hearts. This probably occurred because Gd was infused as a single 25μl bolus and heart perfusate was not circulated, preventing accu-mulation of Gd in the infarcted tissue
Discussion
[image:6.595.56.292.122.186.2]Clinical studies have demonstrated that the extent of myocardial perfusion deficit after infarction is a strong predictor of functional outcome, with patients who pre-sent with large microvascular obstructions (MVO) hav-ing poor prognosis [10]. MR imaghav-ing of the first-pass of a bolus infusion of Gd is now a well established techni-que for accurate identification and localisation of MVOs [5,11-13,30]. Despite its importance, first-pass MR ima-ging has only very recently been used in small animal models of myocardial infarction [24,25]. Here we devel-oped a CMR method which acquired one image every heart cycle and was sensitive to the inflow of Gd into the myocardium, thus providing a rapid technique for assessing tissue perfusion.
Several methods have been used to assess myocardial perfusion in small animal models. Arterial spin labelling and T1 mapping can provide quantitative measurement
Table 2In vivomeasurements of cardiac perfusion and
viability in infarcted rat hearts (n = 14) at 2 and 8 days after infarction
2 days 8 days
Perfusion delay (s) 3.57 ± 0.71 3.51 ± 0.58
LGE-CMR % perimeter 18 ± 3 15 ± 3
LGE-CMR % volume 19 ± 3 10 ± 2#
LGE-CMR volume (μl) 100 ± 18 56 ± 11#
#
[image:6.595.55.291.510.680.2]p < 0.01 compared with 2 days.
of blood flow post infarction in rats and mice [20-23]. However, the accuracy of these techniques is decreased by rapid and variable heart rates, artefacts produced by respiratory motion during acquisition and a single slice acquisition takes tens of minutes. PET imaging of radio-tracers can be used to measure myocardial perfusion, but low spatial resolution, attenuation artefacts and the need for a local cyclotron to produce tracers, such as 82
Rb or H215O, limit the application of this technology, especially when applied to small animals [5,11-13,30,31].
We initially developed and optimised the first-pass method using isolated perfused rat hearts. This prepara-tion permitted repeated contrast infusions in the same heart so that Gd bolus volume, concentration and infu-sion time could be optimised in a controlled environ-ment. Repeated infusions indicated good reproducibility and uniform enhancement in anterior, lateral and infer-ior myocardial regions. To determine the sensitivity of the first-pass technique to regional perfusion deficits the LAD coronary artery was occluded and first-pass ima-ging was repeated. Signal intensity was measured in regions of interest placed in infarcted, peri-infarcted and remote tissue of all 128 images acquired during bolus infusion. Two methods were used to quantify regional perfusion changes. Firstly, perfusion delay was calculated as the time delay, in seconds, between 90% max enhancement in infarcted regions compared with remote regions. Secondly, in ex vivo perfused hearts it was
possible to assess contrast influx rate from the linear portion of the positive gradient of the signal intensity/ time curve and contrast efflux rate from the signal intensity/time curve 10-15 seconds after infusion. As both of these analysis methods relate changes in infarcted regions with those of remote regions of the same infusion any effects of slight differences in bolus transit time and volume can be reduced, providing more reproducible data.
[image:7.595.56.538.89.336.2]seconds between 90% max enhancement in infarcted regions compared with remote regions. Perfusion delay in the infarcted regions was significantly longer than in remote tissue. Owing to the need for acquisition of high temporally resolved images, thein vivospatial resolution of the first-pass technique is limited. Although regions of interest could be selected within the infarct territory, it was not possible to accurately assess the area of the per-fusion deficit. This is augmented in the thinned scar tis-sue of the chronically infarcted heart and can make delineation of the endocardial border problematic. A further limitation of the method is that it cannot be per-formed at multiple slice positions during a single Gd bolus, while repeated bolus imaging is complicated by LGE in infarcted regions.
The severity of perfusion delay and extent of delayed enhancement measured at 2 and 8 days strongly corre-lated with cardiac function measured in the same rats 42 days after infarction. These correlations were stronger than those between ejection fraction and end systolic volume measured at 2 or 8 days and ejection fraction or end systolic volume at 42 days. Acutely after infarction, myocardial stunning, edema, and elevated catecholamine levels can strongly influence EF and ESV, masking the extent of systolic dysfunction. A combination of these factors, coupled with the variability of infarct size typi-cally induced by experimental myocardial infarction, makes acute measurement of EF and ESV a poor early predictor of outcome and suggests that the common practice of dividing infarcted animals into experimental groups based on EF measured made principle by echo-cardiography in the first week post infarction can lead to wide variability in extent of functional impairment between groups. The first-pass and LGE-CMR techni-ques presented here gave better predictors of outcome cine-MRI, provided a more accurate assessment of myo-cardial viability acutely after infarction and may offer a useful baseline measure of infarct severity prior to administration of the therapeutic agent.
Ex vivofirst-pass imaging was performed on isolated, perfused infarcted rat hearts that had undergonein vivo imaging at 2 and 8 days post infarction.In vivoandex vivo measurements of perfusion delay correlated, as did
in vivo LGE-CMR volume and ex vivo low perfusion
volume and Gd clearance time. This supports the hypoth-esis that LGE-CMR is due to reduced washout and hence greater retention of Gd in infarcted regions [32].
The volume of LGE significantly decreased from 2 days to 8 days post infarction, and was unquantifiable at 42 days. Similar results were reported in canine models [33] and in two recent clinical studies which found a decrease in LGE from 12 to 8% of the left ventricle between 1 and 8 days after infarction [34] and from 27 to 22% between 24 hours to 6 months [35]. This decrease is probably due
to hyperenhancement of oedematous, inflamed, viable tissue within the infarct border zone at 2 days post infarction, and thinning of the scar, infarct resorption and hypertrophy of remote tissue at 8 days [33,34]. How-ever, it draws attention to possible limitations of using LGE-CMR in small animal models of chronic infarction where transmurality and tissue remodelling can make infarct assessment difficult. Few studies have used LGE-CMR chronically after infarction, and those that have did not study animals with large transmural infarcts [36], The first-pass CMR measurements of perfusion delays measured in this study did not change from 2 to 8 days post infarction, but we predict that the spatial resolution of the technique may be inadequate for measuring perfu-sion in established transmural scar tissue.
The resolution of the first-pass method may be improved through parallel imaging using multi channel phase array coils and accelerated image acquisitions. Schneider et al recently demonstrated the feasibility of using parallel imaging to achieve threefold acceleration of cine image acquisition in mice [37]. By using similar stra-tegies, it may be possible to perform multi slice first-pass imaging with a spatial resolution that permits accurate delineation of underperfused areas of myocardium, or to assess changes in perfusion in peri-infarct areas in response to dobutamine stress or after experimental apy with angiogenic cytokines or stem cells. A novel ther-apeutic strategy for replacing myocardium lost during infarction is grafting of engineered heart tissue [38,39]. It is currently difficult to assessin vivowhether the graft is incorporated into the host’s vasculature. First-pass CMR may be able to detect contrast agent inflow into the engi-neered tissue and determine successful integration.
Conclusions
In summary, we have presented a novel, simple and use-ful MR method for identification of under-perfused tis-sue in the infarcted rat heart and demonstrate the high prognostic value of the technique compared with other non-invasive measures of cardiac function and viability. This method is a useful tool for assessing the severity of myocardial ischemia acutely after infarction and could provide important data on treatment strategies designed to revascularise and regenerate the infarcted heart.
Additional material
Abbreviations
LGE-CMR: late gadolinium enhancement cardiac magnetic resonance; EF: ejection fraction; EDV: end diastolic volume; ESV: end systolic volume; FLASH: fast low angle shot; Gd-DTPA: gadolinium diethylenetriaminepentaacetate; LAD: left anterior descending coronary artery; LV: left ventricle; MVO: microvascular obstruction; PD: pefusion delay.
Acknowledgements
This work was supported by The British Heart Foundation (grant number PG/07/059/23259).
Author details
1Department of Physiology, Anatomy and Genetics, University of Oxford,
Parks Road, Oxford, UK.2Biological Imaging Centre, Imperial College,
Hammersmith Hospital, Du Cane Road, London W12 0NN, UK.
Authors’contributions
DJS conceived and designed the study, performed all MRI and analysis, and drafted the manuscript; CAC performed all surgical procedures and assisted with MRI; SJM and MAC assisted with perfused heart experiments, DJT assisted with MRI; KC assisted with study design, manuscript preparation and funding. All authors read and approved the final manuscript
Competing interests
The authors declare that they have no competing interests.
Received: 21 February 2011 Accepted: 3 August 2011 Published: 3 August 2011
References
1. Saeed M:New concepts in characterization of ischemically injured myocardium by MRI.Exp Biol Med (Maywood)2001,226:367-376. 2. Schinkel AF, Poldermans D, Elhendy A, Bax JJ:Assessment of myocardial
viability in patients with heart failure.J Nucl Med2007,48:1135-1146. 3. Wu KC, Lima JA:Noninvasive imaging of myocardial viability: current
techniques and future developments.Circ Res2003,93:1146-1158. 4. Nijveldt R, Beek AM, Hirsch A, Stoel MG, Hofman MB, Umans VA, Algra PR,
Twisk JW, van Rossum AC:Functional recovery after acute myocardial infarction: comparison between angiography, electrocardiography, and cardiovascular magnetic resonance measures of microvascular injury.
J Am Coll Cardiol2008,52:181-189.
5. Plein S, Younger JF, Sparrow P, Ridgway JP, Ball SG, Greenwood JP: Cardiovascular magnetic resonance of scar and ischemia burden early after acute ST elevation and non-ST elevation myocardial infarction.
J Cardiovasc Magn Reson2008,10:47.
6. Orn S, Manhenke C, Anand IS, Squire I, Nagel E, Edvardsen T, Dickstein K: Effect of left ventricular scar size, location, and transmurality on left ventricular remodeling with healed myocardial infarction.Am J Cardiol 2007,99:1109-1114.
7. Ingkanisorn WP, Rhoads KL, Aletras AH, Kellman P, Arai AE:Gadolinium delayed enhancement cardiovascular magnetic resonance correlates with clinical measures of myocardial infarction.J Am Coll Cardiol2004,43:2253-2259. 8. Kim RJ, Wu E, Rafael A, Chen EL, Parker MA, Simonetti O, Klocke FJ,
Bonow RO, Judd RM:The use of contrast-enhanced magnetic resonance imaging to identify reversible myocardial dysfunction.N Engl J Med2000, 343:1445-1453.
9. Atkinson DJ, Burstein D, Edelman RR:First-pass cardiac perfusion: evaluation with ultrafast MR imaging.Radiology1990,174:757-762. 10. Gerber BL, Raman SV, Nayak K, Epstein FH, Ferreira P, Axel L, Kraitchman DL:
Myocardial first-pass perfusion cardiovascular magnetic resonance: history, theory, and current state of the art.J Cardiovasc Magn Reson2008,10:18. 11. Lombardo A, Rizzello V, Galiuto L, Natale L, Giordano A, Rebuzzi A,
Loperfido F, Crea F, Maseri A:Assessment of resting perfusion defects in patients with acute myocardial infarction: comparison of myocardial contrast echocardiography, combined first-pass/delayed contrast-enhanced magnetic resonance imaging and 99mTC-sestamibi SPECT.Int
J Cardiovasc Imaging2006,22:417-428.
12. Lund GK, Stork A, Saeed M, Bansmann MP, Gerken JH, Muller V, Mester J, Higgins CB, Adam G, Meinertz T:Acute myocardial infarction: evaluation with first-pass enhancement and delayed enhancement MR imaging compared with 201Tl SPECT imaging.Radiology2004,232:49-57.
13. Nagel E, Klein C, Paetsch I, Hettwer S, Schnackenburg B, Wegscheider K, Fleck E:Magnetic resonance perfusion measurements for the noninvasive detection of coronary artery disease.Circulation2003, 108:432-437.
14. Schwitter J, Nanz D, Kneifel S, Bertschinger K, Buchi M, Knusel PR, Marincek B, Luscher TF, von Schulthess GK:Assessment of myocardial perfusion in coronary artery disease by magnetic resonance: a comparison with positron emission tomography and coronary angiography.Circulation2001,103:2230-2235.
15. Epstein FH:MRI of left ventricular function.J Nucl Cardiol2007, 14:729-744.
16. Pfeffer MA, Pfeffer JM, Steinberg C, Finn P:Survival after an experimental myocardial infarction: beneficial effects of long-term therapy with captopril.Circulation1985,72:406-412.
17. Nahrendorf M, Wiesmann F, Hiller KH, Hu K, Waller C, Ruff J, Lanz TE, Neubauer S, Haase A, Ertl G, Bauer WR:Serial cine-magnetic resonance imaging of left ventricular remodeling after myocardial infarction in rats.
J Magn Reson Imaging2001,14:547-555.
18. Carr CA, Stuckey DJ, Tatton L, Tyler DJ, Hale SJ, Sweeney D, Schneider JE, Martin-Rendon E, Radda GK, Harding SE,et al:Bone marrow-derived stromal cells home to and remain in the infarcted rat heart but fail to improve function: an in vivo cine-MRI study.Am J Physiol Heart Circ
Physiol2008,295:H533-542.
19. Bohl S, Lygate CA, Barnes H, Medway D, Stork LA, Schulz-Menger J, Neubauer S, Schneider JE:Advanced methods for quantification of infarct size in mice using three-dimensional high-field late gadolinium enhancement MRI.Am J Physiol Heart Circ Physiol2009,296:H1200-1208. 20. Kober F, Iltis I, Cozzone PJ, Bernard M:Myocardial blood flow mapping in
mice using high-resolution spin labeling magnetic resonance imaging: influence of ketamine/xylazine and isoflurane anesthesia.Magn Reson Med2005,53:601-606.
21. Nahrendorf M, Streif JU, Hiller KH, Hu K, Nordbeck P, Ritter O, Sosnovik DE, Bauer L, Neubauer S, Jakob PM,et al:Multimodal functional cardiac MR imaging in creatine kinase deficient mice reveals subtle abnormalities in myocardial perfusion and mechanics.Am J Physiol Heart Circ Physiol2006. 22. Bauer WR, Hiller KH, Galuppo P, Neubauer S, Kopke J, Haase A, Waller C,
Ertl G:Fast high-resolution magnetic resonance imaging demonstrates fractality of myocardial perfusion in microscopic dimensions.Circ Res 2001,88:340-346.
23. Waller C, Engelhorn T, Hiller KH, Heusch G, Ertl G, Bauer WR, Schulz R: Impaired resting perfusion in viable myocardium distal to chronic coronary stenosis in rats.Am J Physiol Heart Circ Physiol2005,288: H2588-2593.
24. Makowski M, Jansen C, Webb I, Chiribiri A, Nagel E, Botnar R, Kozerke S, Plein S:First-pass contrast-enhanced myocardial perfusion MRI in mice on a 3-T clinical MR scanner.Magn Reson Med2010,64:1592-1598. 25. Coolen BF, Moonen RP, Paulis LE, Geelen T, Nicolay K, Strijkers GJ:Mouse
myocardial first-pass perfusion MR imaging.Magn Reson Med2010. 26. Stuckey DJ, Carr CA, Martin-Rendon E, Tyler DJ, Willmott C, Cassidy PJ,
Hale SJ, Schneider JE, Tatton L, Harding SE,et al:Iron particles for noninvasive monitoring of bone marrow stromal cell engraftment into, and isolation of viable engrafted donor cells from, the heart.Stem Cells 2006,24:1968-1975.
27. Cassidy PJ, Schneider JE, Grieve SM, Lygate C, Neubauer S, Clarke K: Assessment of motion gating strategies for mouse magnetic resonance at high magnetic fields.J Magn Reson Imaging2004,19:229-237. 28. Stuckey DJ, Carr CA, Tyler DJ, Aasum E, Clarke K:Novel MRI method to
detect altered left ventricular ejection and filling patterns in rodent models of disease.Magn Reson Med2008,60:582-587.
29. Protti A, Sirker A, Shah AM, Botnar R:Late gadolinium enhancement of acute myocardial infarction in mice at 7T: cine-FLASH versus inversion recovery.J Magn Reson Imaging2010,32:878-886.
30. Heller GV, Calnon D, Dorbala S:Recent advances in cardiac PET and PET/ CT myocardial perfusion imaging.J Nucl Cardiol2009,16:962-969. 31. Schelbert HR, Inubushi M, Ross RS:PET imaging in small animals.J Nucl
Cardiol2003,10:513-520.
32. Mahrholdt H, Wagner A, Judd RM, Sechtem U, Kim RJ:Delayed enhancement cardiovascular magnetic resonance assessment of non-ischaemic cardiomyopathies.Eur Heart J2005,26:1461-1474. 33. Fieno DS, Hillenbrand HB, Rehwald WG, Harris KR, Decker RS, Parker MA,
and differing patterns of ventricular remodeling following myocardial infarctions of varying size.J Am Coll Cardiol2004,43:2124-2131. 34. Engblom H, Hedstrom E, Heiberg E, Wagner GS, Pahlm O, Arheden H:
Rapid initial reduction of hyperenhanced myocardium after reperfused first myocardial infarction suggests recovery of the peri-infarction zone: one-year follow-up by MRI.Circ Cardiovasc Imaging2009,2:47-55. 35. Dall’armellina E, Karia N, Lindsay AC, Karamitsos TD, Ferreira V, Robson MD,
Kellman P, Francis JM, Forfar C, Prendergast BD,et al:Dynamic changes of edema and late gadolinium enhancement after acute myocardial infarction and their relationship to functional recovery and salvage index.Circ Cardiovasc Imaging2011,4:228-236.
36. Gnyawali SC, Roy S, McCoy M, Biswas S, Sen CK:Remodeling of the ischemia-reperfused murine heart: 11.7-T cardiac magnetic resonance imaging of contrast-enhanced infarct patches and transmurality.Antioxid
Redox Signal2009,11:1829-1839.
37. Schneider JE, Lanz T, Barnes H, Stork LA, Bohl S, Lygate CA, Ordidge RJ, Neubauer S:Accelerated cardiac magnetic resonance imaging in the mouse using an eight-channel array at 9.4 Tesla.Magn Reson Med2011, 65:60-70.
38. Stuckey DJ, Ishii H, Chen QZ, Boccaccini AR, Hansen U, Carr CA, Roether JA, Jawad H, Tyler DJ, Ali NN,et al:Magnetic resonance imaging evaluation of remodeling by cardiac elastomeric tissue scaffold biomaterials in a rat model of myocardial infarction.Tissue Eng Part A2010,16:3395-3402. 39. Zimmermann WH, Melnychenko I, Wasmeier G, Didie M, Naito H,
Nixdorff U, Hess A, Budinsky L, Brune K, Michaelis B,et al:Engineered heart tissue grafts improve systolic and diastolic function in infarcted rat hearts.Nat Med2006,12:452-458.
doi:10.1186/1532-429X-13-38
Cite this article as:Stuckeyet al.:First-pass perfusion CMR two days after infarction predicts severity of functional impairment six weeks later in the rat heart.Journal of Cardiovascular Magnetic Resonance2011
13:38.
Submit your next manuscript to BioMed Central and take full advantage of:
• Convenient online submission
• Thorough peer review
• No space constraints or color figure charges
• Immediate publication on acceptance
• Inclusion in PubMed, CAS, Scopus and Google Scholar
• Research which is freely available for redistribution