N A N O E X P R E S S
Open Access
Effect of variation of average pore size and
specific surface area of ZnO electrode (WE) on
efficiency of dye-sensitized solar cells
Nitin A Jadhav
1,2*, Pramod K Singh
1,3, Hee Woo Rhee
4and Bhaskar Bhattacharya
1Abstract
Mesoporous ZnO nanoparticles have been synthesized with tremendous increase in specific surface area of up to 578 m2/g which was 5.54 m2/g in previous reports (J. Phys. Chem. C 113:14676-14680, 2009). Different mesoporous ZnO nanoparticles with average pore sizes ranging from 7.22 to 13.43 nm and specific surface area ranging from 50.41 to 578 m2/g were prepared through the sol-gel method via a simple evaporation-induced self-assembly process. The hydrolysis rate of zinc acetate was varied using different concentrations of sodium hydroxide. Morphology, crystallinity, porosity, andJ-Vcharacteristics of the materials have been studied using transmission electron microscopy (TEM), X-ray diffraction (XRD), BET nitrogen adsorption/desorption, and Keithley instruments.
Keywords:Mesoporous ZnO; EISA; Copolymer; DSSC
Background
Zinc oxide is one of the principal multifunctional mate-rials due to its unique characteristics having applications in catalysis [1,2], actuators and sensors [3,4], drug deliv-ery [5], and optoelectronics [6,7]. ZnO nanostructures varying from nanoparticles, nanorods, and nanotriangles to nanoribbons [8-10] have already been developed. The particle size in nano-range shows tremendous increase in specific surface area with low dimensions which re-sults in a wider range and efficient application in a var-iety of fields.
For efficient device applications, nanomaterials having a large specific surface area are the prime need of the present scenario, and nanomaterials with porous morph-ology are an additional important feature for device appli-cation. Very recently, nanostructures with a highly ordered porous network and having a large specific surface area with an optimum pore size such as TiO2 [11-13], ZnO [14-16], SiO2 [17], and SnO2 [18] have been developed, and most crystalline mesoporous metal oxides such as Co3O4, NiO, and MnO2[19,20] were synthesized using a
hard template like Al2O3 mesoporous silica, mesoporous carbon [21], SBA-15, and KIT-6, which require high-temperature synthesis. Recently, reports on the synthesis of mesoporous metal oxides such as the highly ordered network of porous TiO2and SiO2using soft templates like block copolymers have also been found, which need low-temperature synthesis. Synthesis of ZnO structures also available in the literature. Bhattacharyya and Gedanken have reported the synthesis of mesoporous ZnO and Ag-ZnO nanocomposites by microwave-assisted and sonochemical routes. Gao and Wang [22] have also recently reported the synthesis of cage- and shell-like porous ZnO structures grown by self-assembly of ZnO nanocrystals. Very recently, Pal et al. have reported the ultrasound-assisted synthe-sis of mesoporous ZnO nanostructures of different po-rosities [14].
Nowadays, dye-sensitized solar cell (DSSC) technology based on the ZnO photoelectrode has been explored exten-sively. Due to the advanced photocatalytic property of ZnO, some efforts are also found on the fabrication of a DSSC using ZnO as the working electrode. ZnO is a wide-band gap semiconductor that possesses an energy band structure and physical properties similar to those of TiO2 but has higher electronic mobility that would be favorable for fast electron transport, with reduced recombination loss when used in DSSCs. Many studies have already reported on the
* Correspondence:[email protected] 1
Materials Research Laboratory, School of Basic Sciences and Research, Sharda University, Greater Noida 201310, India
2
Post-graduate Department of Chemistry, Tuljaram Chaturchand College, Baramati, Pune 413102, India
Full list of author information is available at the end of the article
use of a ZnO material for application in DSSCs. Although the conversion efficiencies of ZnO are much lower than those of TiO2, ZnO is still a distinguished alternative to TiO2 due to its ease of crystallization and anisotropic growth. These properties allow ZnO to be produced in a wide variety of nanostructures, thus possessing unique properties for electronics, optics, or photocatalysis [23]. Recent studies on ZnO nanostructure-based DSSCs have delivered many new concepts, leading to a better under-standing of photoelectrochemically based energy conver-sion. This, in turn, would speed up the development of DSSCs that are associated with TiO2. One of the defining features of nanostructures is their size in the nanometer scale. This, first of all, provides the nanostructures with a large specific surface area. It may also result in many par-ticular behaviors in electron transport or light propagation
in view of the surface effect. Those nanostructural forms of ZnO which were developed during the past several de-cades mainly include nanowires (or nanorods), nanotubes, nanobelts, nanosheets, nanotips, and nanoparticles [24].
In the present article, we report on crystalline mesopo-rous ZnO with the highest surface area of up to 578 m2/g as compared with previous reports, with variation of pore size ranging from 7.22 to 13.43 nm. We have shown that photoelectrode films with nanostructured ZnO can signifi-cantly enhance solar cell performance by an increase in average pore size for direct transport pathways of photo-excited electrons and with efficient scattering centers for enhanced light-harvesting efficiency. It is shown that spe-cific surface area plays an important role in increasing solar cell performance, but pore size is also a significant factor which affects the cell parameter; also, the size of the
A B
C D
E F
[image:2.595.59.540.294.706.2]G H
nanocrystallite can alter the electrode-electrolyte junction which affects the open-circuit voltage Voc of DSSCs. In the present work, we have used a solid polymer electro-lyte, since an liquid electrolyte has much more limitations like evaporation leakage and decrease in efficiency, but for the solid polymer electrolyte, it is very significant as the efficiency remains constant for more than a year.
Methods
Materials
Zinc acetate (Thermo Fisher Scientific, Waltham, MA, USA), Pluronic F-127 (extra pure, Sigma-Aldrich, St. Louis, MO, USA), methyl alcohol, (CH2OH; Rankem Chemicals, Faridabad, India), and sodium hydroxide (NaOH; Thermo Fisher Scientific, Waltham, MA, USA) were used as re-ceived without further purification.
Synthesis
The synthesis of mesoporous ZnO was carried out using the triblock copolymer-templated sol-gel method via an evaporation-induced self-assembly (EISA) process. Zn sol can be prepared by adding 0.38 M of zinc acetate to 15 ml of already-prepared 0.001 M F-127 copolymer template methanolic solution under vigorous magnetic stirring for 3 h. NaOH solutions were prepared by add-ing different amounts of NaOH in 5 ml of methanol under vigorous magnetic stirring for 3 h. The amount of the NaOH was varied in the final mixture solution as 0.15, 0.2, 0.25, 0.3, 0.35, 0.4, 0.45, and 0.5 M. Then, it was dropwise added to the previously prepared template zinc acetate solution under magnetic stirring. The stir-ring process was continued for 12 h until the mixture initially forms a colorless sol and then white gel.
Fabrication of a DSSC
[image:3.595.304.539.280.665.2]The resulting paste was then used to fabricate the working electrode using the well-known doctor blade method as reported in [25]. The synthesized paste was employed on a cleaned and blocking layer-coated fluorine-doped tin oxide (FTO) glass and calcinated at 315°C for 12 h at a heating rate of 1°C/min. The calcinated working electrode was then soaked in (0.5 mM in ethanol) dye solution over-night and washed with ethanol to remove excess of the dye adsorbed on the surface of the electrode. The solid polymer electrolyte was prepared by dissolving the poly-ethylene oxide (PEO)/PEG blend in acetonitrile and add-ing NaI and I2 (75:25 w/w%) and iodine (10 w/w%), respectively. The platinum counter electrode was prepared by spin coating the H2PtCl6solution on a clean FTO glass
Figure 2Variation of average particle size versus the mesoporous ZnO samples synthesized using different concentrations of NaOH. The concentrations used were 0.15, 0.2, 0.25, 0.3, 0.35, 0.4, 0.45, and 0.5 M. The samples were calcinated at 315°C for 12 h.
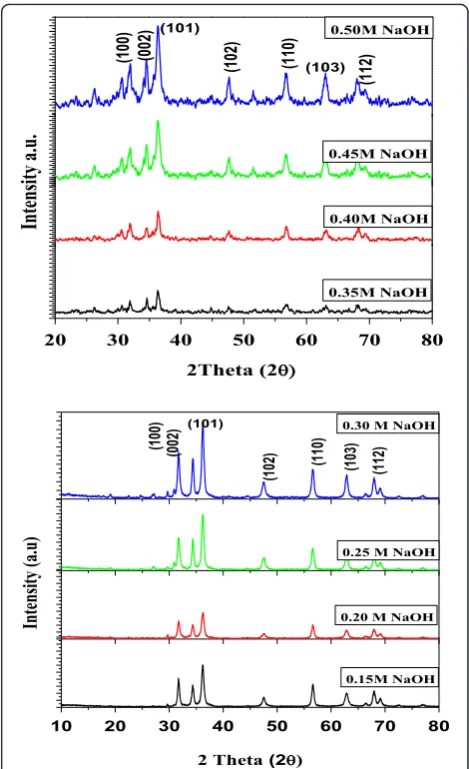
Figure 3XRD spectra of the mesoporous ZnO samples synthesized using different concentrations of NaOH.The concentrations used were 0.15, 0.2, 0.25, 0.3, 0.35, 0.4, 0.45, and 0.5 M. The samples were calcinated at 315°C for 12 h. The diffraction peaks are identified using the standard JCPDS data (card
[image:3.595.57.292.510.684.2]and heated at 400°C for 30 min. A drop of the above pre-pared electrolyte was sandwiched between the fabricated working electrode and counter electrode and used to record the current density-voltage (J-V) curve using a Keithley 2400 sourcemeter (Keithley Instruments Inc., Cleveland, OH, USA).
Characterizations
The structure, texture, and morphology of the synthesized samples were examined using transmission electron mi-croscopes (TEM; models JEM-2010 and JEOL JEM 2100 F, JEOL Ltd., Akishima, Tokyo, Japan) operating at 200 kV. For the TEM analysis, a small amount of the sample was dispersed in 95% ethanol. For the structural determination, powder X-ray diffraction (XRD) patterns were recorded with a Rigaku X-ray diffractometer (Rigaku Corporation, Tokyo, Japan) using CuKα radiation (λ =1.5405 Å). Sur-face area, pore volume, pore size distribution, and pore diameter were measured by a BET Quantachrome Auto-sorb AS1WIN instrument (Quantachrome Instruments, Boynton Beach, FL, USA). To analyze the pore size, the sample is outgassed at 300°C for 7 h. The DSSC parameters like open-circuit voltage (Voc), short-circuit current density (Jsc),fill factor (FF), and conversion efficiency (η) were mea-sured by a Keithley sourcemeter (model no. 4200, Keithley Instruments Inc., Cleveland, OH, USA).
[image:4.595.305.540.89.253.2]Results and discussion
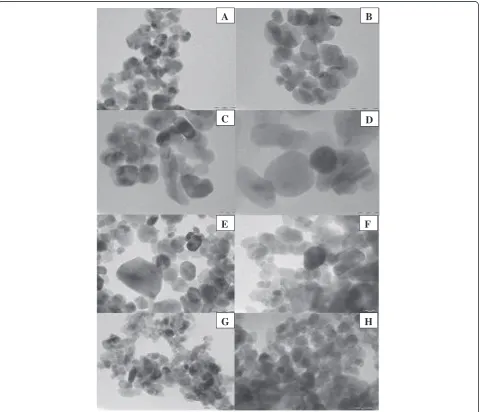
Figure 1 shows the typical TEM images of the mesoporous ZnO samples synthesized using different concentrations of NaOH: (A) 0.15 M, (B) 0.2 M, (C) 0.25 M, (D) 0.3 M, (E) 0.35 M, (F) 0.4 M, (G) 0.45 M, and (H) 0.5 M. The samples were calcinated at 315°C for 12 h. Particles with rod shape or cylindrical shape were obtained which can be
clearly seen from the TEM images. Change in shape could be due to the variation of NaOH concentration. The rate of nucleation and growth depends upon the rate of hy-drolysis by NaOH. We know that the rate of nucleation and growth is the deciding factor for the formation of dif-ferent shapes and geometries of the nanoparticles. It also plays a very important role on the average particle size, average pore size, and also on specific surface area which is discussed later. It is well known that as concentration of NaOH varies from lower concentration to higher concen-tration, the hydrolysis varies and the rate of nucleation and growth also varies, resulting in the formation of parti-cles with varied geometries. Due to this variation, partiparti-cles with random size are formed. The TEM images show the
Figure 4Representative nitrogen adsorption/desorption isotherms for the mesoporous ZnO samples synthesized using different concentrations of NaOH.The concentrations used were 0.15, 0.2, 0.25, 0.3, 0.35, 0.4, 0.45, and 0.5 M. The samples were calcinated at 315°C for 12 h.
[image:4.595.56.291.505.675.2]Figure 5Variation of specific surface area versus the mesoporous ZnO samples synthesized using different concentrations of NaOH.The concentrations used were 0.15, 0.2, 0.25, 0.3, 0.35, 0.4, 0.45, and 0.5 M. The samples were calcinated at 315°C for 12 h.
[image:4.595.304.539.512.683.2]average particle size ranging from 23 to 36 nm. Variations of the average particle size of ZnO samples synthesized using different concentrations of NaOH have been pre-sented in Figure 2 as obtained from TEM.
The wide-angle XRD patterns (Figure 3) for all synthe-sized samples revealed good crystallinity of zincite form with perfect hexagonal geometry which is confirmed by exactly matching with standard JCPDS data (card no. 01-071-6424). The zincite for of ZnO is rarely available in na-ture and mostly used in semiconductor technology.
[image:5.595.56.291.88.243.2]Nitrogen adsorption/desorption isotherms for the meso-porous ZnO samples synthesized at 0.15 M NaOH are given in Figure 4. Similar isotherms were obtained for all other samples synthesized at different NaOH concentra-tions. It may be noted that all of these samples were cal-cined at 315°C for 12 h. As can be noticed, all the samples revealed similar and type-IV isotherms (IUPAC classifica-tion) which are associated to a mesoporous structure of better pore size uniformity. The sharp desorption at about P/P0= 0.45 indicates sudden evaporation of the adsorbate from cylindrical-shaped pores.
Figure 5 shows the variation of specific surface area ver-sus the mesoporous ZnO samples synthesized using differ-ent concdiffer-entrations of NaOH: 0.15, 0.2, 0.25, 0.3, 0.35, 0.4, 0.45, and 0.5 M. All the samples were calcinated at 315°C for 12 h. From the figure, it is observed that the specific surface area initially increases with an increase in NaOH concentration. The surface area suddenly increases at optimum NaOH concentration, and then it decreases with increasing NaOH concentration. It is because the rate of nucleation and growth of the mesoporous material which takes place during the reaction is the deciding factor for controlling the surface area pore size and also particle size. The rate of nucleation and growth depends upon the rate of hydrolysis which depends upon the reaction parameters like pH, temperature, and concentration of the precursor and base. In the present case, as the concentration of the base NaOH increases, initially the rate of hydrolysis slowly increases which leads to the gradual increase in specific surface area. But this trend is observed up to a certain concentration, and at optimum concentration of the base, there is a sudden and tremendous increase in specific sur-face area. After this NaOH concentration, the rate of nu-cleation and growth becomes very fast which leads to disordered porous structures and the specific surface area decreases. However, the specific surface area remains con-stant with increasing NaOH concentration. In the present work, we could observe the highest specific surface of upto 578 m2/g. This is much higher than the other reports found to date [14].
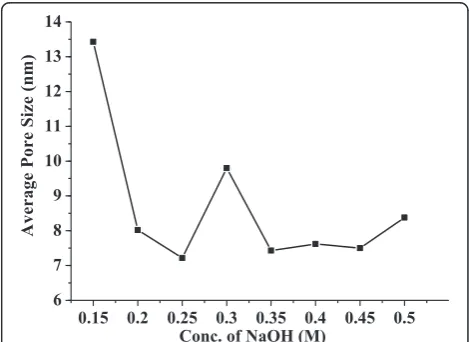
Figure 6 shows the variation of average pore size ver-sus the mesoporous ZnO samples synthesized using dif-ferent concentrations of NaOH: 0.15, 0.2, 0.25, 0.3, 0.35, 0.4, 0.45, and 0.5 M. The samples were calcinated at 315°C for 12 h. It was noticed that at lower base concen-tration, larger pore size formation takes place, but as the concentration of the base increases, there is a sudden decrease in pore size. This happens due to the increase in hydrolysis rate, and faster nucleation and growth of ZnO take place. As discussed earlier, as the concentra-tion of NaOH increases, there is increase in hydrolysis rate which leads to increase in nucleation and growth Figure 7RepresentativeJ-Vcurves for mesoporous ZnO
[image:5.595.56.539.599.725.2]samples synthesized using different concentrations of NaOH. The concentrations used were 0.15 M (sample A), 0.2 M (sample B), 0.25 M (sample C), 0.3 M (sample D), 0.35 M (sample E), 0.4 M (sample F), 0.45 M (sample G), and 0.5 M (sample H). The samples were calcinated at 315°C for 12 h.
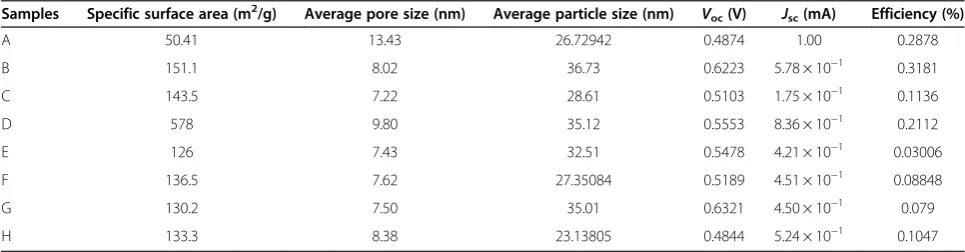
Table 1 Comparison of specific surface area, average pore size, average particle size, and DSSC parameters
Samples Specific surface area (m2/g) Average pore size (nm) Average particle size (nm) V
oc(V) Jsc(mA) Efficiency (%)
A 50.41 13.43 26.72942 0.4874 1.00 0.2878 B 151.1 8.02 36.73 0.6223 5.78 × 10⁻¹ 0.3181 C 143.5 7.22 28.61 0.5103 1.75 × 10⁻¹ 0.1136 D 578 9.80 35.12 0.5553 8.36 × 10⁻¹ 0.2112 E 126 7.43 32.51 0.5478 4.21 × 10⁻¹ 0.03006 F 136.5 7.62 27.35084 0.5189 4.51 × 10⁻¹ 0.08848 G 130.2 7.50 35.01 0.6321 4.50 × 10⁻¹ 0.079 H 133.3 8.38 23.13805 0.4844 5.24 × 10⁻¹ 0.1047
rate. But in the case of the porous structure, the hy-drolysis as well as nucleation and growth rate plays a very important role as the porous structure is very much sensitive to these parameters. As the hydrolysis rate as well as nucleation and growth rate increases, the porous structure collapses which leads to a decrease in pore size. Hence, with increase in NaOH concentration, there is a decrease in average pore size.
Dye-sensitized solar cells
The synthesized ZnO samples from different concentra-tions of NaOH were used to fabricate the working elec-trode of DSSCs. The photocurrent J-V characteristics of the DSSCs fabricated with the different morphologies of ZnO photoanodes are shown in Figure 7, and all the parameters are summarized in Table 1.
Jscobtained from different cells is plotted against sam-ples synthesized with different morphologies as shown in Figure 8, and it is observed that the obtained Jsc values follow the same trend followed by pore size (see the pore size plot in Figure 6), i.e., for the cells fabricated using the photo-electrode, which have higher pore size, the value of Jsc is high, and at lower pore size, the value of Jsc is low; as pore size decreases, Jsc also decreases. This is attributed to the radius of gyration of polymers used in the electrolyte (the PEO radius of gyration is 13.7 nm). As pore size increases more than the radius of gyration of the polymer, there are lot of chances for the polymer chain to penetrate into the pores of the elec-trode and exchange electrons with the dye molecule adsorbed on the surface of the electrode as well as the dye molecule inside the pore, which get reduced through the polymer electrolyte, hence resulting in the increase of photocurrent. As pore size decreases, it is difficult for
the polymer chain to penetrate into the pore and exchange electrons with the dye molecule adsorbed inside the pores, resulting to a possible decrease of the photocurrent.
Figure 9 shows the variation of open-circuit voltage (Voc) for different ZnO samples synthesized as detailed above. It is observed that theVocfollows the trend of particle size, i. e., as particle size increases, theVocincreases and vice versa (see the particle size plot in Figure 2).
[image:6.595.306.539.89.252.2]It is known thatVocis the potential difference between the redox potential at the counter electrode and the con-duction band of the semiconductor layer. It may be noted that at smaller sizes of the particle, the band structure does not prevail inside these particles. It is only the com-pact structure (cluster) of these particles which is taken
Figure 8Variation of short-circuit current density (Jsc) versus
mesoporous ZnO samples synthesized using different concentrations of NaOH.The concentrations used were 0.15, 0.2, 0.25, 0.3, 0.35, 0.4, 0.45, and 0.5 M. The samples were calcinated at 315°C for 12 h.
Figure 9Variation of open-circuit voltage (Voc) versus the
mesoporous ZnO samples synthesized using different concentrations of NaOH.The concentrations used were 0.15, 0.2, 0.25, 0.3, 0.35, 0.4, 0.45, and 0.5 M. The samples were calcinated at 315°C for 12 h.
0.15 0.2 0.25 0.3 0.35 0.4 0.45 0.5 0.00
0.05 0.10 0.15 0.20 0.25 0.30 0.35
Photo-Cur
re
n
t
E
ffic
ie
nc
y
(%)
[image:6.595.304.539.506.674.2]Conc. of NaOH (M)
[image:6.595.57.291.513.675.2]as equivalent to the band structure. In such condition, smaller particles will result in incomplete band structure, and hence, the flat band potential will become lower [26]. Any increase in particle size will lead to better band for-mation, proper band bending, and higher flat band poten-tial. Such change will not only affect on theVoc, but also lead to varied overlapping of the bands of ZnO and the ex-cited level of the dye and hence a change in photocurrent. From all of the above discussion, we could identify that at 0.3 M NaOH concentration, the highest specific surface area of up to 578 m2/g is obtained, but the highest pore size of 13.43 nm is obtained at 0.15 M NaOH concentra-tion. This shows that the highestJscis 1 mA.
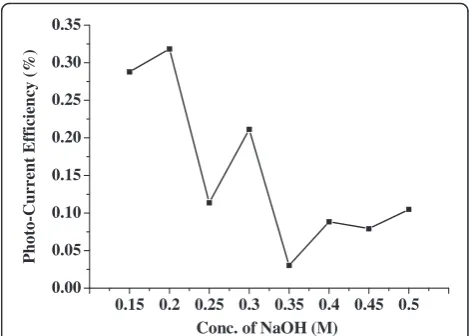
[image:7.595.304.538.225.735.2]Changes in Voc and Jsc are reflected on the photo-conversion efficiency of the DSSC. Variation in photo-conversion efficiency for all synthesized samples has been shown in Figure 10 which is in accordance with the change in par-ticle size andVocas discussed above.
Conclusions
We present a synthesis strategy of preparing mesoporous ZnO powder in bulk amount through the triblock copolymer-templated sol-gel method via an EISA process. We have successfully modified the working electrode of DSSCs. Additionally, we have been able to produce the modified structure, texture, morphology, pore size, as well as surface area. Direct co-relation has been established be-tween increase/decrease in pore size on the short-circuit current of DSSCs and increase or decrease in particle size on the open-circuit voltage of DSSCs. We have success-fully synthesized mesoporous ZnO with the highest spe-cific surface area of upto 578 m2/g available in the literature. Also, we have successfully achieved the highest short-circuit current density of up to 1 mA with 13.47-nm pore size. These findings open up new challenges for modifying the other components of DSSCs to improve the cell performance.
Abbreviations
DSSC:dye-sensitized solar cell;Jsc: short-circuit current density;Voc: open-circuit voltage; WE: working electrode; XRD: X-ray diffraction.
Competing interests
The authors declare that they have no competing interests.
Authors' contributions
NAJ carried out all the synthesis and DSSC fabrication work. HWR
contributed to this work by helping in the characterization through TEM and BET. PKS and BB participated in the sequence alignment, helped in the discussion and in predicting the conclusion of the obtained results, and drafted the whole manuscript. All authors read and approved the final manuscript.
Acknowledgements
Mr. Nitin A Jadhav is grateful to the Council of Scientific and Industrial Research (CSIR), Govt. of India, for providing financial support for his doctoral research through CSIR-SRF (S/1078(0001)/12 EMR-1). Also, we acknowledge the Department of Science & Technology (DST), Govt. of India, and Global Frontier R&D Program on Center for Multiscale Energy System funded by the
National Research Foundation under the Ministry of Science, ICT & Future Planning, Korea (2011-0031570) for funding.
Author details
1Materials Research Laboratory, School of Basic Sciences and Research,
Sharda University, Greater Noida 201310, India.2Post-graduate Department of Chemistry, Tuljaram Chaturchand College, Baramati, Pune 413102, India.
3
Institute for Microsystems Technology, Vestfold University College, Tonsberg 3103, Norway.4Department of Chemical and Biomolecular Engineering,
Sogang University, Seoul, South Korea.
Received: 1 April 2014 Accepted: 2 October 2014 Published: 14 October 2014
References
1. Evgenidou E, Fytianos K, Poulios I:Semiconductor-sensitized photodegradation of dichlorvos in water using TiO2and ZnO as catalysts.Appl Catal B2005,59:81–89.
2. Wang Y, Muhler M, Woll C:The identification of hydroxyl groups on ZnO nanoparticles by infrared spectroscopy.Phys Chem Chem Phys2006, 8:1521.
3. Fan Z, Lu JGL:Gate-refreshable nanowire chemical sensors.Appl Phys Lett
2005,86:123510.
4. Gao T, Wang TH:Synthesis and properties of multipod-shaped ZnO nanorods for gas-sensor applications.Appl Phys: Mater Sci Process A2005, 80:1451–1454.
5. Wang Z, Song L:Piezoelectric nanogenerators based on zinc oxide nanowire arrays.J. Science2006,312:242–246.
6. Huang MH, Mao S, Feick H, Yan H, Hu Y, Kind H, Weber E, Russo R: Room-temperature ultraviolet nanowire nanolasers.Science2001, 292:1897–1899.
7. Zhu YW, Zhang HZ, Sun XC, Feng SQ, Xu J, Zhao Q, Xiang B, Wang RM, Yu DP:Efficient field emission from ZnO nanoneedle arrays.Appl Phys Lett
2003,83:144–146.
8. Santiago PU:Controlling the morphology of ZnO nanostructures in a low-temperature hydrothermal process.J Phys Chem B2005, 109:15317–15321.
9. Zhang XL, Qiao R, Qiu R, Kim JC, Kang YS:Fabrication of hierarchical ZnO nanostructures via a surfactant-directed process.Cryst Growth Des2009, 9:2906–2910.
10. By Qifeng Z, CS D, Zhou X, Cao G:ZnO nanostructures for dye-sensitized solar cells.Adv Mater2009,21:4087–4108.
11. Nitin A, Jadhav A, Kim CW, Kim UPJ, Kang YS:Concentration and temperature effect on controlling pore size and surface area of mesoporous titania by using template of F-68 and F-127 co-polymer in the sol–gel process.J Nanosci Nanotechnol2012,12:5638–5643. 12. Crepaldi EL, Soler-Illia GJAA, Grosso D, Cagnol F, Ribot F, Sanchez C:
Controlled formation of highly organized mesoporous titania thin films: from mesostructured hybrids to mesoporous nano-anatase TiO2.J Am
Chem Soc2003,123:9770–9786.
13. Grosso D, Soler-Illia GJAA, Crepaldi EL, Cagnol F, Sinturel C, Bourgeois A, Brunet-Bruneau A, Amenitsch H, Albouy PA, Sanchez C:Highly porous TiO2 anatase optical thin films with cubic mesostructure stabilised at 700°C.
Chem Mater2003,15:4562.
14. Pal U, Kim CW, Jadhav NA, Kim CW, Jadhav NA, Kang YS:Ultrasound-assisted synthesis of mesoporousZnO nanostructures of different porosities.J Phys Chem C2009,113:14676–14680.
15. Bhattacharyya S, Gedanken A:Template-free, sonochemical route to porous ZnO nano-disks.Microporous Mesoporous Mater2008,110:553–559. 16. Bhattacharyya S, Gedanken A:Microwave-assisted insertion of silver
nanoparticles into 3-D mesoporous zinc oxide nanocomposites and nanorods.J Phys Chem C2008,112:659–665.
17. Kleitz F, Liu D, Anilkumar GM, Park I-S, Solovyov LA, Shmakov AN, Ryoo R: Large cage face-centered cubic Fm-3 m mesoporous silica: synthesis and structure.J Phys Chem B2003,10:14296–14300.
18. Ba J, Polleux J, Antonietti M, Niederberger M:Non-aqueous synthesis of tin oxide nanocrystals and their assembly into ordered porous
mesostructures.Adv Mater2005,17:2509–2512.
20. Jiao F, Harrison A, Jumas JC, Chadwick AV, Kockelmann W, Bruce PG: Ordered mesoporous Fe2O3with crystalline walls.J Am Chem Soc2006, 128:5468–5474.
21. Jun S, Joo SH, Ryoo R, Kruk V, Jaroniec M, Liu Z, Ohsuna T, Terasaki OJ: Synthesis of new, nanoporous carbon with hexagonally ordered mesostructure.J Am Chem Soc2000,122:10712–10713.
22. Gao PX, Wang ZL:Mesoporous polyhedral cages and shells formed by textured self-assembly of ZnO nanocrystals.J Am Chem Soc2003, 125:11299–11305.
23. Wang ZL:Zinc oxide nanostructures: growth, properties and applications.
J Phys Condens Matter2004,16:R829.
24. Vafaee M, Ghamsari MS:Preparation and characterization of ZnO nanoparticles by a novel sol–gel route.Mater Lett2007,61:3265–3268. 25. Singh PK, Kim KW, Kim K, Park NG, Rhee HW:Nanocrystalline porous TiO2
electrode with ionic liquid impregnated solid polymer electrolyte for dye sensitized solar cells.J of Nanosci Nanotech2008,8:5271–5274.
26. Bhattacharya B, Lee J, Lee JY, Geng J, Jung HT, Park J-K:Effect of cation size on solid polymer electrolyte based dye-sensitized solar cells.Langmuir
2009,25:3276.
doi:10.1186/1556-276X-9-575
Cite this article as:Jadhavet al.:Effect of variation of average pore size and specific surface area of ZnO electrode (WE) on efficiency of dye-sensitized solar cells.Nanoscale Research Letters20149:575.
Submit your manuscript to a
journal and benefi t from:
7Convenient online submission 7Rigorous peer review
7Immediate publication on acceptance 7Open access: articles freely available online 7High visibility within the fi eld
7Retaining the copyright to your article