http://dx.doi.org/10.4236/psych.2016.76083
The Stability of Dispositional Optimism in
Relation to Receiving or Not Receiving a
Cancer Diagnosis
Inger Schou Bredal1, Øivind Ekeberg2,3
1Cancer Center, Institute for Health and Science, Oslo University Hospital, University of Oslo, Oslo, Norway 2Department of Acute Medicine, Oslo University Hospital Ullevaal, Institute of Clinical Medicine, University of
Oslo, Oslo, Norway
3Department of Behavioural Sciences in Medicine, Institute of Basic Medical Sciences, Faculty of Medicine,
University of Oslo, Oslo, Norway
Received 16 February 2016; accepted 5 June 2016; published 8 June 2016
Copyright © 2016 by authors and Scientific Research Publishing Inc.
This work is licensed under the Creative Commons Attribution International License (CC BY). http://creativecommons.org/licenses/by/4.0/
Abstract
We used the Life Orientation Test-Revised (LOT-R) as a unidimensional scale to investigate the stability of dispositional optimism and compared the results with the stability of anxiety and de-pression. Five hundred and twelve women completed the LOT-R and the Hospital Anxiety and De-pression scale before follow-up mammography and 4 weeks after receiving the result (breast cancer or not). This study shows that dispositional optimism is relatively stable and is not influ-enced by receiving a cancer diagnosis.
Keywords
Anxiety, Depression, Optimism, Personality
1. Introduction
Donnellan, 2012). There is also evidence from the psychiatric literature that indicates that measurement of per-sonality traits can be affected by the presence of depression (Fishbain et al., 2006).
It has been suggested that optimism represents a blend of neuroticism and extraversion (Marshall, Wortman, Kusulas, & Hervig, 1992). However, it has been shown that optimism is distinct from these traits (Alarcon, Bowlin, & Khazon, 2013;Kam & Meyer, 2012), but appears to have some overlap with agreeableness and con-scientiousness (Sharpe, Martin, & Roth, 2011). According to Carver & Scheier (2014), dispositional optimism should be viewed as a personality trait independent of the big five. It is a dimension of generalized expectancy about the occurrence of good versus bad outcomes across important life domains in one’s future (Scheier & Carver, 1985, 1992).
Given the trait-like conceptualization of dispositional optimism, one can assume that optimism, like the big five traits, also has a high degree of stability. Some studies have supported this assumption through test-retest correlations, which were relatively high and ranged from 0.58 to 0.79 (Allison, Guichard, & Gilain, 2000; Atienza, Stephens, & Townsend, 2004; Giltay, Kamphuis, Kalmijin, Zitman, & Kromhout, 2006; Matthews, Raikkonen, Sutton-Tyrell, & Kuller, 2004; Stiegelis et al., 2003). All these studies used the Life Orientation Test-Revised (LOT-R; Scheier, Carver, & Bridges, 1994) to measure optimism. However, the above studies have primarily investigated the stability of optimism over time. Defining optimism as a stable trait requires ag-gregating data both over time and across situations (Epstein, 1983). Thus, the issue related to the stability of op-timism also involves investigating whether people’s expectancies change as a function of specific life events. The extant literature is sparse and findings are mixed regarding this issue.
It has been suggested that negative affect might reduce optimism. One study found that students who antic-ipated negative feedback in the near future declined in their level of optimism (Carroll, Sweeny, & Shepperd, 2006). Dewberry and Richardson (1990) found that anxiety reduced the level of optimism in a sample of stu-dents who were in the midst of examinations. Helgeson (1999) found that the occurrence of a new cardiac event during the six months following angioplasty did not influence the patients’ level of optimism. A study of women with primary breast cancer found that optimism remained stable over time and across situations regardless of negative effects after diagnosis, whereas women’s anxiety levels decreased over the same period (Schou, Eke-berg, Sandvik, & Ruland, 2005). However, one could argue that receiving the cancer diagnosis had already al-tered the women’s outlook for the future. The same can be argued for the cardiac patients.
To receive a diagnosis of breast cancer is a potentially traumatic experience. This provides ambiguity about what will happen in the future to permit individual differences in optimism, anxiety, and depression to be ex-pressed readily at the time of diagnosis. Thus, the question arises whether a major life event, such as receiving a cancer diagnosis, can alter a person’s optimistic expectations of the future regardless of the level of anxiety and depression experienced.
The aim of the present study was to investigate the stability of optimism in relation to receiving or not receiv-ing a cancer diagnosis and in comparison with the stability of anxiety and depression levels.
2. Method
2.1. Participants and Procedures
Women were recruited consecutively at Oslo University Hospital Ullevaal when they came for further investiga-tion after attending the Oslo mammography screening program. They had all received a standard letter inform-ing them that their screeninform-ing mammogram was inconclusive, that further examination was required, and that about one in seven who are recalled have changes in the breast that require treatment. The inclusion criteria were: being recalled after an initial mammogram because of a suspicious finding, the ability to read and write Norwe-gian, no cognitive impairment, and provision of informed written consent.
2.2. Patient Characteristics
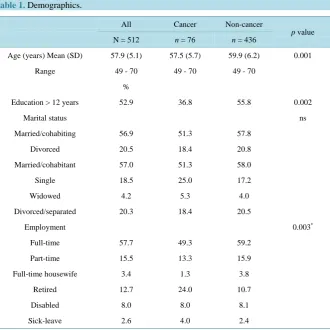
The sample was divided in two groups: the cancer group (n = 76) and the noncancer group (n = 436). As shown in Table 1, the women who received a cancer diagnosis were significantly younger and had less education, and fewer of them were employed.
Of the women who received a cancer diagnosis, 85% received the diagnosis after triple diagnosis and 15% after undergoing a surgical excision. In the noncancer group, the majority (91.3%) were found to be healthy af-ter mammography/ultrasound, 6.0% afaf-ter triple diagnosis, and 2.7% afaf-ter surgical excision.
2.3. Assessment Instruments
Demographic data were obtained by self-report. Medical data (diagnosis of invasive ductal carcinoma, ductal carcinoma in situ, or no cancer) were obtained from each woman’s medical record.
[image:3.595.150.481.363.693.2]The LOT-R(Scheier, Carver, & Bridges, 1994) is currently the most widely used instrument to assess disposi-tional optimism/pessimism(Chiesi, Galli, Borgi, & Bonacchi, 2013; Steca, Monzani, Greco, & Chiesi, 2014; Monzani, Steca, & Greco, 2014). Chiesi et al.’s (2013) and Steca et al.’s (2014) findings were based on item re-sponse theory analyses that provided evidence of the accuracy of the LOT-R. They found that all items could distinguish people with different levels of optimism and adequately covered the spectrum of the latent trait. Furthermore, according to Steca and colleagues (2014), the LOT-R appears to be gender and age invariant. In the present study, the LOT-R was used as a measure of general expectations about positive outcomes (disposi-tional optimism). “The logic behind the optimism construct assumes a bipolar dimension, with “substance” at each end and a neutral point in the middle” (Carver & Scheir, 2014: p. 294). The LOT-R is a 10-item self-report measure; four of the items are filler items that are included to disguise (somewhat) the underlying purpose of
Table 1. Demographics.
All Cancer Non-cancer
p value
N = 512 n = 76 n = 436
Age (years) Mean (SD) 57.9 (5.1) 57.5 (5.7) 59.9 (6.2) 0.001
Range 49 - 70 49 - 70 49 - 70
%
Education > 12 years 52.9 36.8 55.8 0.002
Marital status ns
Married/cohabiting 56.9 51.3 57.8
Divorced 20.5 18.4 20.8
Married/cohabitant 57.0 51.3 58.0
Single 18.5 25.0 17.2
Widowed 4.2 5.3 4.0
Divorced/separated 20.3 18.4 20.5
Employment 0.003*
Full-time 57.7 49.3 59.2
Part-time 15.5 13.3 15.9
Full-time housewife 3.4 1.3 3.8
Retired 12.7 24.0 10.7
Disabled 8.0 8.0 8.1
Sick-leave 2.6 4.0 2.4
*
the test. Of the six scored items, three are phrased in an optimistic and three in a pessimistic direction. Each item was constructed to read in such a way that it did not imply any specific basis for the expectation; that is, whether the reason behind the particular expectation resided in the person, the environment, or luck and change factors. The participants indicated the extent to which they agreed with each of the items on a 5-point scale from 0 (strongly disagree) to 4 (strongly agree). The time frame used was the present. The total score was calculated by adding the optimism raw scores and the inverted pessimism raw scores. Scores can range from zero to 24; higher scores indicate greater optimism and lower scores indicate lower optimism, often referred to as pessimism. The LOT-R was translated into Norwegian using the multiple forward and backward translation technique recom-mended by Guillemin, Bombardier and Beaton, 1993(Schou, Ekeberg, Ruland, & Sandvik, 2005).
There is an ongoing debate regarding the dimensionality of the LOT-R. However, using the LOT-R as a two-factor scale goes against the original authors’ theoretical definition of the scale, which was described as a continuum in which pessimism and optimism are viewed as polar opposites and not as separate dimensions. In a recent review, the original authors continued to recommend that the LOT-R be used as a unidimensional scale in primary analyses (Carver, Scheier, & Segerstrom, 2010). Furthermore, recent studies have given strong support to the one-dimensionality of the LOT-R(Alessandri et al., 2010;Monzani, Steca, & Greco, 2014). Thus, in the present study, the LOT-R is used as a unidimensional scale.
The Hospital Anxiety and Depression Scale (HADS) (Zigmond & Snaith, 1983) was used to assess psycho-logical distress. It is a self-rating questionnaire comprising 14 items: seven measure anxiety and seven measure depression. A score ≥8 gives a sensitivity and specificity for both subscales of about 0.80(Bjelland, Dahl, Haug, & Neckmann, 2002) and indicates clinically significant anxiety and depression. The HADS is available in a range of languages and is considered a reliable scale in assessing the symptom severity and caseness of anxiety disorder and depression in both somatic, psychiatric and primary care patients and in the general population
(Bjelland et al., 2002). Bjelland and colleagues have reported HADS data from the general Norwegian popula-tion, with Cronbach’s α anxiety scale was 0.80 and 0.77 for depression scale. The HADS scores were obtained concurrently with the LOT-R scores.
2.4. Data Analysis
PASW Statistics 18 was used for statistical analyses. Means and standard deviations (SDs) or confidence inter-vals (CIs) were calculated for the whole sample and separately for the two groups at baseline and after receiving the results to assess whether the average optimism/pessimism level of the women had changed. The chi-square test was used to compare categorical measures, and the Students’ t-test was used to compare means of conti-nuous measures between two groups. Pearson’s correlation coefficient was used to analyze the association be-tween two continuous variables. The paired-sample t-test was used to compare means within groups. Effect sizes (Cohen’s d) were used to compare two mean scores (Cohen, 1988). When calculating the effect size for two groups that had the same sample size, the means were subtracted and divided by the pooled standard deviation. When calculating the effect size for two groups with different sample sizes, the calculation of the pooled stan-dard deviation was adjusted with weights for the sample sizes. This approach is identical with Cohen’s d with a correction of a positive bias in the pooled standard deviation (Lenhard & Lenhard, 2015). To calculate the effect sizes for cross-tabs, Cohen’s w was used: this is the square root of the standardized chi-square statistic and w = 0.10 is considered a small effect size, w = 0.30 medium, and w = 0.50 large (Cohen, 1992). The confidence in-tervals for the effect sizes were calculated using the Cumming and Finch (2001) formula. The significance level was set to 0.05.
2.5. Ethics
Permission was obtained from the Norwegian Regional Ethics Committee and the Norwegian Data Inspectorate.
3. Results
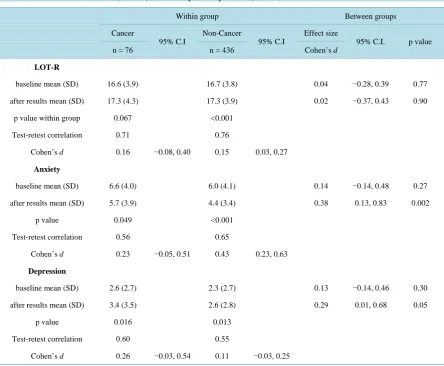
Table 2. General life orientation (LOT-R) and anxiety and depression (HADS) Total N = 512.
Within group Between groups
Cancer
95% C.I
Non-Cancer
95% C.I
Effect size
95% C.I. p value
n = 76 n = 436 Cohen’s d
LOT-R
baseline mean (SD) 16.6 (3.9) 16.7 (3.8) 0.04 −0.28, 0.39 0.77
after results mean (SD) 17.3 (4.3) 17.3 (3.9) 0.02 −0.37, 0.43 0.90
p value within group 0.067 <0.001
Test-retest correlation 0.71 0.76
Cohen’s d 0.16 −0.08, 0.40 0.15 0.03, 0.27
Anxiety
baseline mean (SD) 6.6 (4.0) 6.0 (4.1) 0.14 −0.14, 0.48 0.27
after results mean (SD) 5.7 (3.9) 4.4 (3.4) 0.38 0.13, 0.83 0.002
p value 0.049 <0.001
Test-retest correlation 0.56 0.65
Cohen’s d 0.23 −0.05, 0.51 0.43 0.23, 0.63
Depression
baseline mean (SD) 2.6 (2.7) 2.3 (2.7) 0.13 −0.14, 0.46 0.30
after results mean (SD) 3.4 (3.5) 2.6 (2.8) 0.29 0.01, 0.68 0.05
p value 0.016 0.013
Test-retest correlation 0.60 0.55
Cohen’s d 0.26 −0.03, 0.54 0.11 −0.03, 0.25
LOT-R Life Orientation Test Revised. Anxiety & Depression as measured by the Hospital Anxiety and Depression Scale.
The increase in the LOT-R score was statistically significant in the noncancer group but not in the cancer group, even though they were numerically similar (Table 2). The correlations between the LOT-R scores at baseline and after receiving the results were 0.71 and 0.76 in the cancer and noncancer groups, respectively (p < 0.001).
With regard to anxiety and depression scores, there were no significant differences between the cancer and noncancer group scores at baseline (Table 2). However, after receiving the results, the cancer group scored sig-nificantly higher on both anxiety and depression (5.7 and 3.4, respectively) than the noncancer group (4.4 and 2.6, respectively).
The effect sizes were somewhat higher for the anxiety scores (d = 0.23 for the cancer group and d = 0.43 for the noncancer group) than for the depression scores (d = 0.26 and d = 0.11, respectively).
The correlations between anxiety scores at baseline and after receiving the results were r = 0.56 for the cancer group and r = 0.66 for the noncancer group (p < 0.001). The corresponding figures for depression scores were r
= 0.60 and r = 0.54, respectively (p < 0.001).
4. Discussion
those outcomes (Carroll, Sweeny, & Shepperd, 2006; Taylor & Shepperd, 1998). The increase in the LOT-R scores was significant for the noncancer group, but not for the cancer group. However, the score differences were 0.1 at baseline and zero after receiving the results, so the different statistical significance was caused by the larger sample size in the noncancer group. Accordingly, the difference between groups is not clinically signifi-cant. Neither is the almost similar increase in the LOT–R scores in the two groups with small effect sizes (d < 0.20). According to Ferguson (2009), the recommended minimum effect size representing a practically signifi-cant effect for group difference is d = 0.41. In contrast, more variation was found within the groups for anxiety and depression mean scores as measured by the HADS. However, this was most prominent in the noncancer group’s anxiety score, as reflected in the larger effect size (d = 0.43). The reason for this is probably that all the women initially had received an ambiguous test response (i.e., recalled for new mammography because of a suspect finding).
Our findings are similar to those of three previous studies that have investigated whether people’s optimism changes as a function of specific life events. Schou et al. (2005) found no significant overall changes in optim-ism among breast cancer patients who received additional bad news. Likewise, Helgeson (1999) found that the level of optimism did not change in patients who experienced a new cardiac event during the six months fol-lowing angioplasty. Kivimäki et al. (2005) assessed optimism in a sample of 5007 employees in 1997 and 2000. In 2000, the participants were also asked whether they had experienced the death or severe illness of a family member during the previous year. Among those who had experienced a major life event, the level of optimism remained unaffected. These studies, together with the present study, suggest strong support for the stability of optimism in spite of experiencing major life events.
In contrast to Schou et al.’s (2005) finding, the depression scores increased slightly for both groups, but more so for the cancer group. However, unlike the women in the former study, the women in the present study did not know whether they had cancer at baseline. Most women experience some degree of depression when diagnosed with breast cancer (Stanton et al., 2015). Even though the increases in depression scores were significant, the effect sizes were small (cancer group d = 0.26 and noncancer group d = 0.11) and of little clinical importance. The average depression scores in both the present study and in Schou et al.’s (2005) study are fairly similar to those for the general Norwegian adult female population (mean depression score = 3.2 (SD 3.0) as reported by the Norwegian Health Study, including a general adult female sample (N = 25,791), using the HADS (Haug, Mykeletun, & Dahl, 2004). Thus, it appears that women diagnosed with breast cancer are not more depressed as a group than the general female population.
Overall, our findings support the idea that dispositional optimism is rather stable and not influenced by nega-tive life events such as receiving a cancer diagnosis. In view of Helgeson’s (1999), Kivimäki et al.’s (2005),
Schou et al.’s (2005), and our findings of stability across situations and others’ findings of stability over time
(Giltay et al., 2006), we consider that optimism as measured by the LOT-R is well suited for use in research. We also recommend the use of the LOT-R in clinical settings to identify patients with generally negative life expec-tations (pessimism). There is a growing literature indicating that people who are optimists respond to difficulty and adversity in more adaptive ways than pessimists (Colby & Shifren, 2013;Hirsch, Walker, Chang, & Lyness, 2012; Nes & Segerstrom, 2006;Schou, Ekeberg, Ruland, Sandvik, & Karesen, 2004). Pessimists often expe-rience negative feelings such as anxiety, sadness, and despair because they expect negative outcomes (Scheier et al., 1994). Thus, by identifying pessimists, intervention can be offered to help them cope with their illness.
According to the literature, optimists live better lives than pessimists in many ways. However, because dispo-sitional optimism appears to be trait-like, the question arises whether a person’s level of optimism can be changed. According to Segerstrom (2006), change is possible, but it is unknown to what extent, nor is it known how permanent it can be. Further research is required to answer these questions. The question also remains whether an optimistic view induced by an intervention will have the same beneficial effects as one that is natu-rally occurring. Even though it may be difficult to change a personality trait such as pessimism, awareness of this trait may induce more motivating and encouraging measures to be undertaken by clinicians.
Furthermore, to maintain mental health, trying to increase optimism may be just as important as reducing pes-simism after a patient receives a diagnosis of a life-threatening illness.
used for anxiety and depression was based on a well-established scale with demonstrated psychometric proper-ties.
Although the response rate was high, the present study is not without limitations. These data were collected in a sample of Norwegian women aged 49 to 70 years who were generally well educated and Caucasian, and therefore the data may not be generalizable to other populations or to men. Cancer is a potentially life-threaten- ing disease, but the prognosis for women with early stage cancer is relatively good. However, diagnosis and treatment for breast cancer are traumatic experiences. Thus, receiving a cancer diagnosis provides considerable ambiguity about what will happen in the future, and therefore allows for individual differences in optimism to be expressed readily.
The mean age in our sample was 57.9 years, and one could debate whether the role of optimism changes over the life course for some people. It seems reasonable that, as people age, some would gradually accept the possi-bility of adverse events occurring regardless of their basic level of optimism. Although the cohort was large, the number of women receiving a cancer diagnosis was relatively small (n = 76). Future studies with larger, more diverse populations and of both sexes are needed to evaluate the generalizability of the present findings. In addi-tion, measures using the LOT-R later in the process of cancer treatment are also indicated.
5. Conclusion
This study shows that dispositional optimism is relatively stable and is not influenced by receiving a cancer di-agnosis.
Acknowledgements
We express our gratitude to the patients for their participation and to the staff of the mammography unit for their assistance with the data collection.
References
Alarcon, G. M., Bowlin, N. A., & Khazon, S. (2013). Great Expectations: A Meta-Analytic Examination of Optimism and Hope. Personal and Individual Differences, 54, 821-827. http://dx.doi.org/10.1016/j.paid.2012.12.004
Alessandri, G., Vechone, M., Fagnani, C., Bentler, P. M., Barbaranelli, C., Medda, E., et al. (2010). Much More than Model Fitting? Evidence for the Heritability of Method Effect Associated with Positively Worded Items of the Life Orientation Test Revised. Structural Equation Modeling,4, 642-653. http://dx.doi.org/10.1080/10705511.2010.510064
Allison, P. J., Guichard, C., & Gilain, L. (2000). A Prospective Investigation of Dispositional Optimism as a Predictor of Health-Related Quality of Life in Head and Neck Cancer Patients. Quality of Life Research, 9, 951-960.
http://dx.doi.org/10.1023/A:1008931906253
Atienza, A. A., Stephens, M. A. P., & Townsend, A. L. (2004). Role Stressors as Predictors of Changes in Women’s Opti-mistic Expectations. Personality and Individual Differences,37, 471-484. http://dx.doi.org/10.1016/j.paid.2003.09.016 Bjelland, I., Dahl, A. A., Haug, T. T., & Neckelmann, D. (2002). The Validity of the Hospital Anxiety and Depression Scale:
An Updated Literature Review. Journal of Psychosomatic Research,52, 69-77. http://dx.doi.org/10.1016/S0022-3999(01)00296-3
Carcer, S. C., & Scheier, M. F. (2014) Dispositional Optimism. Trends in Cognitive Sciences, 18, 293-299. http://dx.doi.org/10.1016/j.tics.2014.02.003
Carroll, P., Sweeny, K., & Shepperd, J. A. (2006). Forsaking Optimism. Review of General Psychology, 10, 56-73. http://dx.doi.org/10.1037/1089-2680.10.1.56
Carver, S. C., Scheier, M. F., & Segerstrom, S. C. (2010). Optimism. Clinical Psychology Review,30, 879-889. http://dx.doi.org/10.1016/j.cpr.2010.01.006
Chiesi, F., Galli, S., Primi, C., Borgi, P. I., & Bonacchi, A. (2013). The Accuracy of the Life Orientation Test-Revised (LOT-R) in Measuring Dispositional Optimism: Evidence from Item Response Theory Analyses. Journal of Personality Assessment,95, 523-529. http://dx.doi.org/10.1080/00223891.2013.781029
Cohen, J. (1988). Statistical Power Analysis for the Behavioral Sciences (2nd ed.). Hillsdale, NJ: Lawrence Erlbaum Asso-ciates, Inc.
Cohen, J. (1992). A Power Primer. Psychological Bulletin,112, 155-159. http://dx.doi.org/10.1037/0033-2909.112.1.155 Colby, D. A., & Shifren, K. (2013). Optimism, Mental Health, and Quality of Life: A Study among Breast Cancer Patients.
Conley, J. J. (1984). Longitudinal Consistency of Adult Personality: Self-Reported Characteristics across 45 Years. Journal of Personality and Social Psychology,47, 1325-1333. http://dx.doi.org/10.1037/0022-3514.47.6.1325
Cumming, G., & Finch, S. (2001). A Primer on the Understanding, Use and Calculation of Confidence Intervals That Are Based on Central and Noncentral Distributions. Educational and Psychological Measurement, 61, 532-574.
http://dx.doi.org/10.1177/0013164401614002
Dewberry, C., & Richardson, S. (1990). Effect of Anxiety on Optimism. Journal of Social Psychology, 130, 731-738. http://dx.doi.org/10.1080/00224545.1990.9924625
Epstein, S. (1983). Aggregation and Beyond: Some Basic Issues on the Prediction of Behavior. Journal of Personality,51,
360-392. http://dx.doi.org/10.1111/j.1467-6494.1983.tb00338.x
Ferguson, C. J. (2010). A Meta-Analysis of Normal and Disordered Personality across the Life Span. Journal of Personal and Social Psychology,98, 659-667. http://dx.doi.org/10.1037/a0018770
Fishbain, D. A., Cole, B., Cutler, R. B., Lewis, J., Rosomoff, H. L., & Rosomoff, R. S. (2006). Chronic Pain and the Meas-ure of Personality: Do States Influence Traits? Pain Medicine,6, 509-529.
http://dx.doi.org/10.1111/j.1526-4637.2006.00239.x
Giltay, E. J., Kamphuis, M. H., Kalmijin, S., Zitman, F. G., & Kromhout, D. (2006). Dispositional Optimism and the Risk of Cardiovascular Death. Archives of Internal Medicine,166, 431-436. http://dx.doi.org/10.1001/archinte.166.4.431
Guillemin, F., Bombardier, C., & Beaton, D. (1993). Cross-Cultural Adaptation of Health-Related Quality of Life Measures: Literature Review and Proposed Guidelines. Journal of Clinical Epidemiology,46, 1417-1432.
http://dx.doi.org/10.1016/0895-4356(93)90142-N
Hampson, S. E., & Goldberg, L. R. (2006). A First Cohort Study of Personality Trait Stability over the 40 Years between Elementary School and Midlife. Journal of Personality and Social Psychology, 91, 763-779.
http://dx.doi.org/10.1037/0022-3514.91.4.763
Haug, T. T., Mykeletun, A., & Dahl, A. A. (2004). The Association between Anxiety, Depression and Somatic Symptoms in a Large Population Study: The HUNT-II Study. Psychosomatic Medicine, 66, 845-851.
http://dx.doi.org/10.1097/01.psy.0000145823.85658.0c
Helgeson, V. S. (1999). Applicability of Cognitive Adaptation Theory to Predicting Adjustment to Heart Disease after Co-ronary Angioplasty. Health Psychology,18, 561-569. http://dx.doi.org/10.1037/0278-6133.18.6.561
Hirsch, J. K., Walker, K. L., Chang, E. C., & Lyness, J. M. (2012). Illness Burden and Symptoms of Anxiety in Older Adults: Optimism and Pessimism as Moderators. International Psychogeriatrics,24, 1614-1621.
http://dx.doi.org/10.1017/S1041610212000762
Kam, C., & Meyer, J. P. (2012). Do Optimism and Pessimism Have Different Relationships with Personality Dimensions? A Re-Examination. Personalityand Individual Differences, 52, 123-127. http://dx.doi.org/10.1016/j.paid.2011.09.011 Kivimäki, M., Vahtera, J., Elovainio, M., Helenius, H., Singh-Manoux, A., & Pentti, J. (2005). Optimism and Pessimism as
Predictors of Change in Health after Death or Onset of Severe Illness in Family. Health Psychology, 24, 413-421. http://dx.doi.org/10.1037/0278-6133.24.4.413
Lenhard, W. & Lenhard, A. (2015). Calculation of Effect Sizes. Psyhometrica, Bibergau (Germany). http://www.psychometrica.de/effect_size.htlm
Lucas, R. E., & Donnellan, M. B. (2009). Age Differences in Personality: Evidence from a Nationally Representative Sam-ple of Australians. Developmental Psychology,45, 1353-1363. http://dx.doi.org/10.1037/a0013914
Marshall, G. N., Wortman, C. B., Kusulas, J. W., & Hervig, L. K. (1992). Distinguishing Optimism from Pessimism: Rela-tionships to Fundamental Dimensions of Mood and Personality. Journal of Personality and Social Psychology, 62, 1067- 1074. http://dx.doi.org/10.1037/0022-3514.62.6.1067
Matthews, K. A., Raikkonen, K., Sutton-Tyrell, K., & Kuller, L. H. (2004). Optimistic Attitudes Protect against Progression of Carotid Atherosclerosis in Healthy Middle-Aged Women. Psychosomatic Medicine,66, 640-644.
http://dx.doi.org/10.1097/01.psy.0000139999.99756.a5
Monzani, D., Steca, P., & Greco, A. (2014). Brief Report: Assessing Dispositional Optimism in Adolescence—Factor Struc-ture and Concurrent Validity of the Life Orientation Test-Revised. Journal of Adolescence,37, 97-101.
http://dx.doi.org/10.1016/j.adolescence.2013.11.006
Nes, L. S., & Segerstrom, S. C. (2006). Dispositional Optimism and Coping: A Meta-Analytic Review. Personality and So-cial Psychology Review,10, 235-251. http://dx.doi.org/10.1207/s15327957pspr1003_3
Roberts, B. W., & Del Vecchio, W. F. (2000). The Rank-Order Consistency of Personality Traits from Childhood to Old Age: A Quantitative Review of Longitudinal Studies. Psychological Bulletin,126, 3-25.
Scheier, M. F., & Carver, C. S. (1985). Optimism, Coping, and Health: Assessment and Implications of Generalized Out-come Expectancies. Health Psychology, 4, 219-247. http://dx.doi.org/10.1037/0278-6133.4.3.219
Scheier, M. F., & Carver, C. S. (1992). Effects of Optimism on Psychological and Physical Well-Being: Theoretical Over-view and Empirical Update. Cognitive Therapy and Research,16, 201-228. http://dx.doi.org/10.1007/BF01173489 Scheier, M. F., Carver, C. S., & Bridges, M. W. (1994). Distinguishing Optimism from Neuroticism (and Trait Anxiety,
Self-Mastery, and Self-Esteem): A Reevaluation of the Life Orientation Test. Journal of Personality and Social Psychol-ogy, 67, 1063-1078. http://dx.doi.org/10.1037/0022-3514.67.6.1063
Schou, I., Ekeberg, O., Ruland, C. M., Sandvik, L., & Karesen, R. (2004). Pessimism as a Predictor of Emotional Morbidity One Year Following Breast Cancer Surgery. Psycho-Oncology,13, 309-320. http://dx.doi.org/10.1002/pon.747
Schou, I., Ekeberg, O., Sandvik, L., & Ruland, C. M. (2005). Stability in Optimism-Pessimism in Relation to Bad News: A Study of Women with Breast Cancer. Journal of Personality Assessment, 84, 148-154.
http://dx.doi.org/10.1207/s15327752jpa8402_04
Segerstrom, S. C. (2006). Breaking Murphy’s Law. New York: Guilford.
Sharpe, J., Martin, N., & Roth, K. (2011). Optimism and the Big Five Factors of Personality: Beyond Neuroticism and Extraversion. Personaland Individual Differences, 51, 946-951. http://dx.doi.org/10.1016/j.paid.2011.07.033
Stanton, A. L., Wiley, J. F., Krull, J. L., Crespi, C. M., Hammen, C. et al. (2015). Depressive Episodes, Symptoms, and Tra-jectories in Women Recently Diagnosed with Breast Cancer. Breast Cancer Research and Treatment, 154, 105-115. http://dx.doi.org/10.1007/s10549-015-3563-4
Steca, P., Monzani, D., Greco, A., Chiesi, F., & Primi, C. (2014). Item Response Theory Analysis of the Life Orientation Test-Revised: Age and Gender Differential Item Functioning Analyses. Assessment,22, 341-350.
http://dx.doi.org/10.1177/1073191114544471
Stiegelis, H. E., Hagedoorn, M., Sanderman, R., van der Zee, K., Buunk, B. P., & van den Bergh, A. C. M. (2003). Cognitive Adaptation: A Comparison of Cancer Patients and Healthy References. British Journal of Health Psychology,8, 303-318. http://dx.doi.org/10.1348/135910703322370879
Taylor, K. M., & Shepperd, J. A. (1998). Bracing for the Worst: Severity, Testing and Feedback as Moderators of Optimistic Bias. Personality and Social Psychology Bulletin, 24, 915-926. http://dx.doi.org/10.1177/0146167298249001
Wortman, J., Lucas, R. E., & Donnellan, M. B. (2012). Stability and Change in the Big Five Personality Domains: Evidence from a Longitudinal Study of Australians. Psychology and Aging, 27, 867-874. http://dx.doi.org/10.1037/a0029322 Zigmond, A. S., & Snaith, R. P. (1983). The Hospital Anxiety and Depression Scale. Acta Psychiatrica Scandinavica,67,