Munich Personal RePEc Archive
Methodology of process models creation
when using the software tool enterprise
architect
Máchal, Pavel
10 November 2009
Online at
https://mpra.ub.uni-muenchen.de/18519/
METHODOLOGY OF PROCESS MODELS CREATION WHEN USING THE SOFTWARE TOOL ENTERPRISE ARCHITECT
Pavel MÁCHAL
ACTA TECHNOLOGICA AGRICULTURAE ročník 12, číslo 2-3, 2009, ISSN 1335-255
Abstrakt
Zlepšování podnikových procesů je dnes nezbytností pro udržení firmy na trhu. Podniky
jsou nuceny svými zákazníky, kteří žádají stále lepší produkty a služby, soustavně uvažovat
o zlepšování svých procesů. Tento přístup je založen na porozumění a měření stávajícího
procesu a z toho přirozeně vyplynuvších podnětů k jeho zlepšování. SW nástroj Enterprise
Architect. Umožňuje mimo jiné modelování obchodních procesů.
Hlavním účelem modelování obchodních procesů je vytvoření korektní specifikace
procesů a analýzy jejich vlastností. Smyslem modelování obchodních procesů je vytvořit
takovou abstrakci procesu, která umožňuje pochopení všech jeho aktivit, souvislostí mezi
těmito aktivitami a rolemi reprezentovaných schopnostmi lidí a zařízení zapojených
do daného procesu.
Cílem příspěvku je vytvořit jednotnou metodiku techniky modelování procesů pomocí
nástroje Enterprise Architect.
Klíčová slova
Procesní model, metodika modelování, činnost, proces, modelovací plocha
Abstract
A continuous improvement of business processes is a must for any company that wants to stay in the market. Customers requiring better and better products and services force all enterprises to think continuously about improving of their business processes. Such an approach is based on a good understanding and measuring of an existing process and, thus, from the resulting stimuli of its improvement. A software (SW) tool called Enterprise Architect enables, among others, to model individual business processes.
activities and all relationships existing between these activities on the one hand and roles represented by capabilities of people and facilities involved in a given process.
The objective of this paper is to create a uniform methodology of business processes modelling when using the SW tool Enterprise Architect.
Key words
Process model; methodology of modeling; activity; process; modelling area
Introduction
Process modelling is basically a dynamic image of real business activities displayed via the methods and approaches used for specifying and analysing these processes. Enterprise Architect (hereafter referred to as EA) is a CASE type tool developed by Australian company Sparx Systems. Versions are currently available for MS Windows and Linux platforms. Enterprise Architect is based upon UML version 2.1 support but, along with the ability to define other elements and their features, comes practically unlimited potential for designing the user’s own models. It is a tool which can support and greatly facilitate the entire phase of software development, from defining the system requirements and designing, to preparing test and system documentation. Furthermore, EA supports Business Process Modelling, which is surely an advantage against other CASE tools that support only UML based modelling.
Creating a unified methodology for the process modelling technique designed using EA can subsequently help to provide efficient business process modelling.
Materials and methods
Business process modelling has experienced a rapid growth over the past few years. It has brought success where previous approaches failed as it provided business strategists and technologists with a unified set of tools and strategies for achieving common goals. The future promises even more expansive growth and development, mainly due to the global economic crisis and the subsequent need for re-engineering enterprises, businesses and all manner of other institutions.
Results and discussion
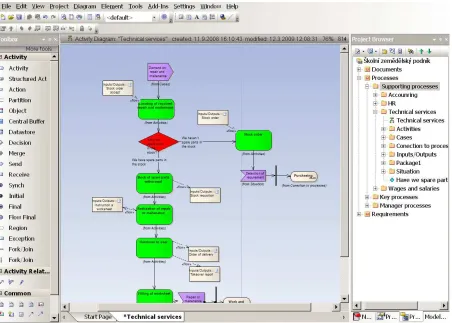
After the opening of the EA tool a basic screen appears. It is useful to separate the basic screen into three graphic areas. Each of them has a name describing its functions. The areas are as follows: Toolbox, placed on the left hand side of the screen, Diagram, placed in the
middle, and finally the third area, Project Browser, on the right hand side of the screen.
The Toolbox contains tabs with elements that can be dragged into the “Modelling Area” in the middle of the screen. The „Modelling Area“, though, serves mainly to display the graphic representation of the constituent processes. A storage site for elements is then automatically created within the “Project Browser“. The database content is created in this manner as the elements are filed under the active Package.
[image:4.595.74.526.337.660.2]These three areas can be switched on, off, widened or narrowed, depending on which area of a model is currently being processed.
Figure 1: The basic screen of the EA tool
When creating a process model this methodology works with the following practices.
• Colouring the elements
This method uses colour distinction of elements. In the final state, the colours improve the legibility and arrangement of diagrams. Colours can be chosen (bottom left corner of the screen) when the cursor is placed on the corresponding element. It is also possible to choose them accumulatively - in the “Modelling Area” by dragging the mouse while holding the left button.
• Rectangular convention
To arrange the diagrams neatly it is necessary to use the rectangular convention for the sequence of activities and situations. Since the system does not support this convention, it must be done manually. The rectangular convention improves the legibility of diagrams.
• Element alignment
After choosing the elements to align (using the right hand mouse button), the alignment possibilities appear on screen (up, down, right, left). Alternatively the alignment can be carried out automatically by creating even spaces between the elements - downwards or upwards.
• One name practice
In EA each established element is assigned a unique identification number. This is necessary for the purpose of copying multiple elements into diagrams. The identification number is assigned to each element automatically, unlike the name that is assigned by the user. When changing the name of an element in the database, all its copies within diagrams are renamed. However, a danger exists in creating (by establishing or copying) an element with the same name but different identification number. In such a case, when used in diagrams, the advantage is lost. Therefore, any element should have only one name and one unique identification number.
• The principle behind creating packages
When modelling, it is necessary to create the structure of packages (in the “Project Browser”) first, so the established elements can be filed within these packages.
Elements filed in such a direct way can be easily and systematically used after the process analysis is finished.
◊ Elements filed in a package carry their text into the diagrams (“From....”); ◊ It is possible to import/export whole packages;
◊ Documentation (HTML, RTF) can be created only from the active package - the
package on which the cursor is placed. Only what is saved in the active package will be transferred into the documentation. When creating documentation of the whole model, the highest-level package must be highlighted.
◊ Creating Hyperlink
Graphs can be linked to documents filed in a defined package by dragging the Hyperlink element from the top tool bar and placing it on the relevant element (Output). Double clicking on a file will open it (MS WORD, MS EXCEL…). This is useful for a more detailed description of activities. Furthermore, a relevant document or template can be opened directly when entering/leaving an activity.
◊ Creating package
A new package can be created by clicking the New package icon and giving it a name. Deleting is done by the right hand mouse button and choosing Delete. The entire methodology used in process modelling is based on the package structure.
◊ Diagram
Double clicking on the “New Diagram“ icon will create a diagram. However, a package will be created first and will be assigned the name of the future process. Afterwards a diagram is established in the empty “Modelling Area”. A diagram established this way would carry the package name.
◊ Element
An element can be created either from the Toolbox, in the case of its being a unique incidence, or from the Project Browser, in the case of its being a repeated incidence. Creating from the Project Browser enables the establishment of a set of diagram elements without their presence in a diagram. These elements can be dragged into the “Modelling Area” using the mouse.
This is how it is established and subsequently placed into the “Modelling Area”:
The most commonly used elements in process modelling using EA software.
Activity
act Test Activ ity1
Figure 2: Activity
Source: Author
The element “Activity“ is used for an activity description. It is established by dragging the mouse from the Toolbox on the “Activity“ tab into the “Modelling Area”. The activity is marked green. The heading can contain a short name activity.
Actor
Figure 3: Actor
Source: Author
The yellow „Actor“ element is used to define a process participant, i.e. the person who carries out the activity. It is placed to the left of the „Activity“ and is linked with the activity it does via “Relation“.
It is necessary to differentiate between a position in an organization chart and a “Role“. One position can have many defined roles within one process (e.g. employee, leader). The “Role“ is established within “Project Browser“ and can be dragged into the “Modelling Area“ by mouse. Individual roles can be dragged by mouse, placed one beneath the other and form a structure of “roles” , which does not appear in the diagram.
act Test
Actor
act Test
Actor
Used application
[image:8.595.72.316.123.239.2]
Figure 4: Used application
Source: Author
The blue “Actor“ element is used to describe the application used for the document related to the activity. It is placed to the right of the “Activity“ and is linked via “Relation“.
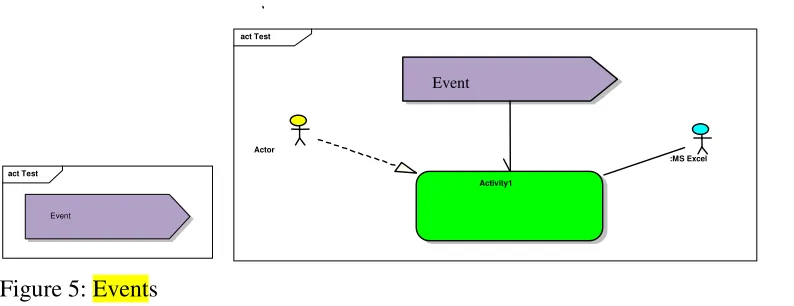
Events
Figure 5: Events
Source: Author
The “Send“ element from the “Analysis” tab can be used to express an event (the external activity initiative). Its colour is purple. Such highlighting improves the legibility of the diagram.
Status
act Technical serv...
Repair or maitenance
ending
(from Situation)
Figure 6: Status
Source: Author act Test
Actor
Activity1
:MS Excel
Event act Test
MS Excel
act Test
:Actor
Activity1
MS Excel
act Test
[image:8.595.71.468.363.516.2]The “Receive” element from the “Analysis” tab can be used to express status (the internal activity initiative). Its colour is brown. Such highlighting improves the legibility of the diagram.
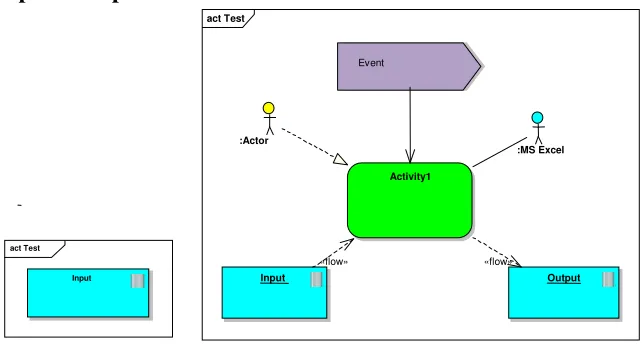
Input / Output
[image:9.595.73.395.163.337.2]Figure 7: Input/Output
Source: Author
The “Artefact“ element is used for documents and data objects. It is created by establishing it within the “Project Browser” and can be dragged into the “Modelling Area” by mouse. The colour of this element is blue. The input is to the left and the output to the right. The relation is “Information Flow”.
Requirement
Figure 8: Requirement
Source: Author
When the goal of the project is to define for example the requirements for IS/IT, the element “Requirement“ is established within the “Project Browser“. The element can be dragged by mouse onto the desktop and linked with an activity. The requirement is assigned to a specific (concrete) activity in this manner.
The structure of the output document will be formed by moving into other packages and sorting all the requirements prior to creating the documentation.
act Test
:Actor
Activity1
:MS Excel
Event
Input Output
«flow» «flow»
act Test
Input
act Test
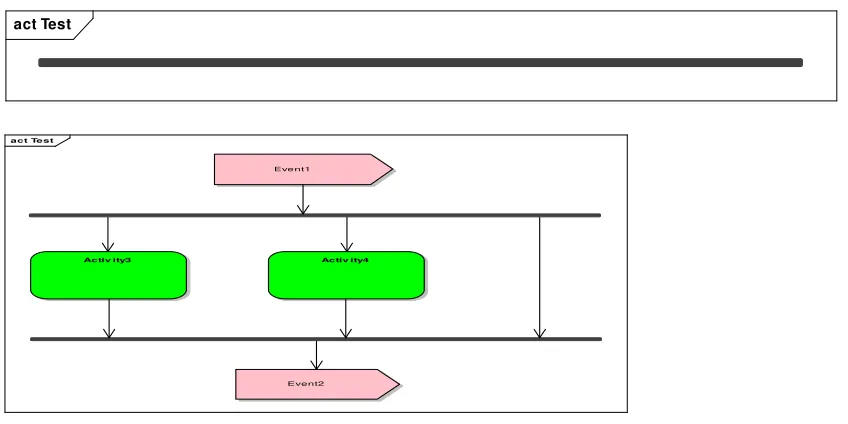
Parallel processes
act Test
act Test
Eve nt1
Activ ity3 Activ ity4
[image:10.595.70.494.101.313.2]Event2
Figure 9 Parallel processes
Source: Author
Parallel processes can be represented by a horizontal or vertical line “Fork/Join“ from the “Activity“ tab. The “Fork/Join“ line represents parallel processes that are independent from each other but must be executed before the process continues. The line can be extended to the necessary length by placing the cursor on the end and pulling with the left mouse button.
Decision-making activities
act Test act Test
a c t Te s t
Ac tiv ity2 :Ve doucí
[Po d m ín ka ]
Figure 10: Decision-making activities
Source: Author
The “Decision“ element from the “Activity“ tab is used to bifurcate the process when there is a known condition and the process continues accordingly along one branch or the other. The red colour is used for this condition. The bifurcation condition is placed into the name of the “Control Flow“ by double clicking on the line and entering the name. To bend the line it is necessary to click on the line with the right button and choose “Bend Line at Cursor“. The black “Merge“ element from the “Activity“ tab is used to merge processes when the dynamic link returns into the logical flow of the diagram.
to another (e.g. status - activity). An arrow on the line will respect the direction of drag (logic).
Connecting diagrams
act Technical serv ices
Wages and Salaries
(from Conection to processes)
Figure 11: Process
Source: Author
After dragging a process symbol (from the “Project Browser”) into the “Modelling Area” and choosing Hyperlink, the symbol, representing the process of the given name, will appear. Clicking it enables switching between processes within the diagram and also within the subsequently created HTML documentation.
General rules for process modelling via EA software
Deleting unused objects
During modelling one element can be established both in the “Modelling Area“ and in the “Project Browser“. When the element is deleted from the “Modelling Area“ it remains in the “Project Browser“.
EA does not have a function for deleting unused elements. It is necessary to use the following procedure:
• open process,
• right click on all the elements, one after the other,
• open the drop down menu and when the text “Locate in Current Diagram“ is black, the element also exists in the “Modelling Area“. When it is grey, the element does not exist in the “Modelling Area“. The “Delete“ function deletes the element.
Packages system
Events, Activities, Statuses,
Linking to processes, Inputs/Outputs.
Filing up elements into packages
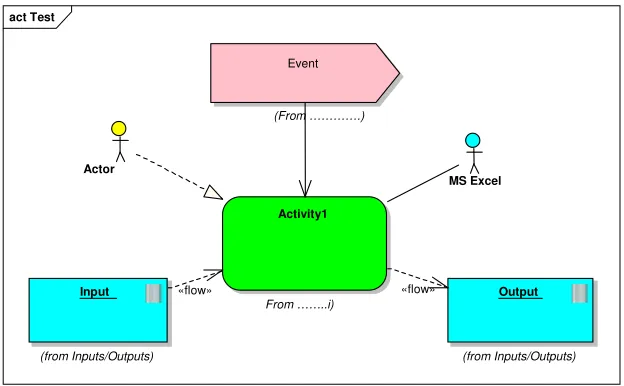
[image:12.595.71.383.339.532.2]Elements can be dragged into packages with the mouse. This makes the established elements look neater. The sign “From...” then appears beneath the graphic symbol in the “Modelling Area”. This improves the legibility of the diagram.
Figure 11: A part of the process after the insertion of elements into packages
Source: Author
Documentation
Icons in the top left corner of the “Project Browser“ are used to create the documentation. The documentation can be in the following formats:
• HTML
Clicking on a package in the “Project Browser“ highlights the target package in which the documentation will be created. When the documentation concerns the whole model, the highest-level package should be selected. The generation then begins. The documentation acts in a similar manner to a live system: it is possible to switch between applications and so on.
act Test
Actor
Activity1
From ……..i)
MS Excel Event
(From ………….)
Input
(from Inputs/Outputs)
Output
(from Inputs/Outputs)
• RTF
The same rules concerning the work with packages apply to an export into MS WORD - RTF. The difference is that it is necessary to choose a template - the form of the output report. The templates provided can be altered to suit.
Export / Import
When creating a copy of a process or a model, it is best to export into “XLM“ followed by import from the newly created file. Copies contain all the graphics and are the same as the original.
Export/Import is done by clicking the right mouse button on the relevant package and choosing Export/Import function.
Conclusions
The purpose of business process modelling is to create a precise specification of processes and to analyse their features. The intent of business process modelling is to create process abstraction that enables understanding of all its activities, the connections between these activities and roles represented by the abilities of the people and devices involved in the process.
There are many approaches and methodologies concerning business process modelling. These are usually created in connection with a software product designated for process modelling.
The aim of creating this methodology for modelling techniques was to provide the users of Enterprise Architect s/w with the basic set of terms and rules for their use, so the process model maker could describe all the real behaviour and features in an easy way that does not change.
References
LINHARTOVÁ, D. Vysokoškolská psychologie (University psychology). Brno: MZLU v
Brně, 2008, 151 s. ISBN 78-80-7375-172-2
MÁCHAL, P., LIŠKA, S. Utilization attribute in procedural simulation at optimum assignation of production process In SKOUPÝ, A., MÁCHAL, P., MAREČEK, L. Proceedings of the 3rd ISC Fortechenvi 2008. Brno: Mendelova zemědělská
ŘEPA,V. Podnikové procesy - procesní řízení a modelování. (Business processes – process
management and modelling): Praha: Grada, 2007, 281 s. ISBN 78-80-247-2252-8
Internet sources
ARIS Architecture of Integrated Information System. 2003, http://www.pera.net/
Methodologies /ARIS/ARIS.HTML.
BPMI Business Process Modeling Notation. Version 1.0 - May 3, 2004, Business Process
Management Initiative, http://www.bpmi.org
Contact address
Ing. Pavel Máchal, CSc.
Institute of the Lifelong Education, Mendel University of Agriculture and Forestry in Brno, Zemědělská 1, 613 00 Brno, Czech Republic, e-mail: [email protected]
Institut celoživotního vzdělávání Mendelovy zemědělské a lesnické univerzity v Brně,