http://dx.doi.org/10.4236/cs.2016.710242
How to cite this paper: Venkatasami, A. and Latha, P. (2016) Application of Extreme Learning Machine in Fault Classifica-tion of Power Transformer. Circuits and Systems, 7, 2837-2845. http://dx.doi.org/10.4236/cs.2016.710242
Application of Extreme Learning Machine in
Fault Classification of Power Transformer
Athikkan Venkatasami
1*, Pitchai Latha
21Department of EEE, Einstein College of Engineering, Tirunelveli, India 2Department of CSE, Government College of Engineering, Tirunelveli, India
Received 9 May 2016; accepted 20 May 2016; published 4 August 2016
Copyright © 2016 by authors and Scientific Research Publishing Inc.
This work is licensed under the Creative Commons Attribution International License (CC BY). http://creativecommons.org/licenses/by/4.0/
Abstract
Reliability of power system is very essential for every nation to generate and transmit power without interruption. Power transformer is one of the most significant electrical apparatus and hence it must be kept in good health. Identification and classification of faults in power transfor-mer is a major research area. Conventional method of fault classification in transfortransfor-mer uses gas concentrations data and interprets them using international standards. These standards are not able to classify the faults correctly under certain conditions. To overcome this limitation, several soft computing tools namely artificial neural network (ANN), Support Vector Machine (SVM) etc. are used to automate the process of classification of faults in transformers. However, there is a scope exists to improve the classification accuracy. Hence, this research work focuses to design Extreme Learning Machine (ELM) method for classifying fault very accurately using enthalpy of dissolved gas content in transformer oil as an input feature. The ELM method is tested with two databases: one based on IEC TC10 database (DB1) and the other one based on data collected from utilities in India (DB2). The application of ELM to Power Transformer fault classification based on enthalpy as input feature outperforms over the conventional classification based on gas concen-tration as input feature.
Keywords
Transformer, Dissolved Gas Analysis, Machine Learning
1. Introduction
Power transformer is one of the critical equipments in a power system. Hence, it is very essential to keep the
power transformer in good health. Generally gases are produced during its operation and they get dissolved in transformer oil. These gases are extracted from oil and measured using gas chromatograph. Alternatively they are measured through gas sensors fitted in the power transformer. Dissolved gas analysis (DGA) is one of the oldest and reliable methods to evaluate whether there is any abnormality inside a power transformer or not [1] [2]. A number of methods are in use for the interpretation of dissolved gas analysis. Key Gas method, Roger’s ratio method, IEC ratio method, Dual triangle etc. are the methods used. The individual concentrations of six fault gases are used in key gas method. Four common fault conditions are distinguished by the quoted percen-tage concentrations of the six gases. The Roger’s ratio method use four gas ratios resulting into 12 proposed di-agnosis. In the revised standard, only six diagnoses are used. In the IEC ratio method, the same three ratios as per the revised Roger’s ratio method is used but it suggests different ranges and interpretations. However, there is no universally accepted interpretation method for the DGA. To overcome the limitations of the conventional diagnostic methods, soft computing tools are used to develop automated transformer fault classification.
Artificial neural network (ANN) can be trained to acquire knowledge. However, lots of training data are re-quired for proper training. ANN also has universal approximation property and it enables to approximate any given continuous function with required level of accuracy. These networks are considered as a “black box” models and hence it is very difficult to interpret in their trained state [3]. Among various learning algorithms, the support vector machine (SVM) is one of the most important and widely used algorithms for transformer fault classifications. Yan Zhang [4] has reported the use of online DGA data using SVM. Four types of SVM models are used to classify transformer faults. Out of 60 dataset, 35 datasets are used for training and 25 for testing. Cross-validation method is used to calculate the free parameters of the SVM.
The state of art Extreme Learning Machine method offers a competitively good solution for complex tasks. The Extreme learning Machine is a recent second generation neural network algorithm. It is identified as the one which can give high performance in multifaceted problems and takes less computation time compared with other machine learning algorithms [5]. The ELM based model proposed by Huang et al. [6] performs quite fast with high learning phase for problems of relatively large dataset which does not require iterative tuning used in other neural networks. ELM based model is used for classification of images in medical applications [7]. The paper focuses on classification of tumour using three segment classifications of MR brain images in 3 dimensions. Using 60 neurons in the hidden layer, ELM model achieves 93.2% accuracy. The ELM is successfully applied to face recognition using Yale face database and Carnegie Mellon University face images database [8]. It is shown that the state preserving extreme learning machine used for face recognition gives best performance than the other known classifiers.
Single layer feed forward Neural Network is modeled with hidden neurons and activation function by Guang- Bin et al. [9]. Extreme learning machine for RBF (Radial Basis Function) network produces faster results. Huang et al. [10] proved that single layer feed-forward neural network with randomly assigned input weights and hidden layer biases and with any nonzero activation function can approximate any continuous functions. Thermodynamic estimation of fault severity is suggested in [11] for transformer fault energy dissipated within the transformer. It is based on the enthalpy of forming one substance from another substance. When a thermo-dynamic system undergoes transformation, change in enthalpy takes place.The enthalpy [12] for forming one substance from another is the amount of energy required to produce from one mole of one substance to form another expressed in grams per mole.
This research paper focuses on six segment classifications model with dissolved gas analysis data of DB1 da-tabase and four segment classifications model with DB2 dada-tabase. One method based on the conventional ap-proach using gas concentration and the other improved method based on the enthalpy of the gas concentration is used. Section 2 covers the various ELM models for transformer fault classification. Application of ELM for fault classification in transformer using DB1 database is elaborated in Section 3. Section 4 details the application of ELM for fault classification in transformer using DB2 database. Conclusions based on the present study are given in Section 5.
2. ELM Models
radial basis function (RBF) for the output neurons. Two databases (DB1 and DB2) are used. DB1 database con-tain 151 records published by IEC TC10 working group, whereas DB2 has 219 records based on data collected from utilities in INDIA. Four models namely ELM-I, ELM-II, ELM-III and ELM-IV are developed. ELM-I and ELM-III models are based on conventional approach using gas concentrations as input features. In ELM-II and ELM-IV, instead of gas concentrations as input features, enthalpy of the gas concentrations are used. Enthalpy is calculated from the gas concentrations as per the Table 1.
2.1. ELM Models Using DB1 Database
The database DB1 contains 151 records of IEC TC10 database. It contains methane, ethane, ethylene, hydrogen and acetylene carbon monoxide and carbon dioxide. The gas data are obtained from gas sensors fitted in the Power transformer or from gas chromatograph. Out of seven gases as shown in Figure 1, five gases namely acetylene, ethylene, ethane, methane and hydrogen are selected for ELM-I and ELM-II models. ELM-I model uses gas concentrations in parts per million (ppm) as input features.
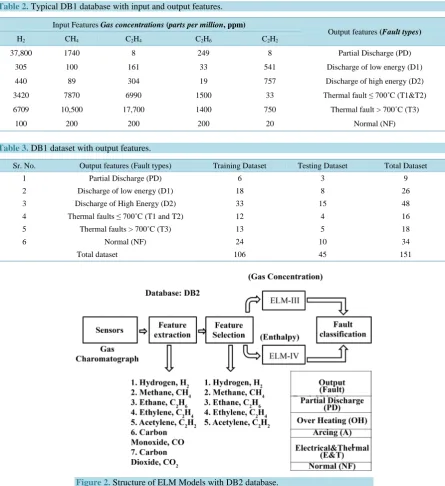
Typical dataset of DB1 database showing input and output features are shown in Table 2. Partial discharge, discharges of low and high energy (D1 and D2), thermal faults (T1, T2 and T3) and normal (NF) form the out-put features.
For ELM-II model, the gas concentrations are converted into enthalpy and used as input feature. Table 3 shows the training and testing dataset used for each output feature. Partial discharge has only 9 dataset whereas discharge of high energy has total 48 dataset.
Both ELM-I and ELM-II models use total 151 dataset. Out of 151 dataset, 106 dataset is used for training and 45 dataset is used for testing.
2.2. ELM Models Using DB2 Database
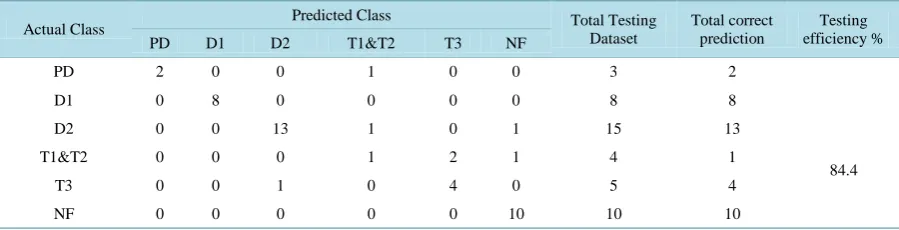
[image:3.595.157.489.406.710.2]Figure 2 shows the methodology of using DB2 database. DB2 has seven extracted features.
Table 1. Enthalpy of Transformer fault gases.
Sr. No. Fault Gas Chemical formula Enthalpy (kJ/mol)
1 Methane CH4 77.70
2 Ethane C2H4 93.50
3 Ethylene C2H6 104.1
4 Hydrogen H2 128.5
5 Acetylene C2H2 278.3
Table 2. Typical DB1 database with input and output features.
Input Features Gas concentrations (parts per million, ppm)
Output features (Fault types)
H2 CH4 C2H4 C2H6 C2H2
37,800 1740 8 249 8 Partial Discharge (PD)
305 100 161 33 541 Discharge of low energy (D1)
440 89 304 19 757 Discharge of high energy (D2)
3420 7870 6990 1500 33 Thermal fault ≤ 700˚C (T1&T2)
6709 10,500 17,700 1400 750 Thermal fault > 700˚C (T3)
[image:4.595.89.535.84.571.2]100 200 200 200 20 Normal (NF)
Table 3. DB1 dataset with output features.
Sr. No. Output features (Fault types) Training Dataset Testing Dataset Total Dataset
1 Partial Discharge (PD) 6 3 9
2 Discharge of low energy (D1) 18 8 26
3 Discharge of High Energy (D2) 33 15 48
4 Thermal faults ≤ 700˚C (T1 and T2) 12 4 16
5 Thermal faults > 700˚C (T3) 13 5 18
6 Normal (NF) 24 10 34
Total dataset 106 45 151
Figure 2. Structure of ELM Models with DB2 database.
Five features are selected for ELM-III and ELM-IV model. Model ELM-III is based on the gas concentrations in ppm and Model-IV is based on the enthalpy of gases. Four types of faults namely partial discharge, overheat-ing, arcing and electrical and thermal faults are taken as output features as in Table 4.
Out of 219 dataset in DB2 database, 179 dataset is used for training and 40 dataset is used for testing. Total dataset used for partial discharge, overheating, arcing and Electrical & thermal (E&T) classes are 29, 120, 58 and 12 respectively.
Table 5 shows the training and testing dataset used for each output feature. Electrical and thermal fault as output feature has only 12 dataset.
3. Application of ELM on DB1 Database
ELM-II models. In ELM-I model, transformer fault classification is based on the gas concentration present in the transformer from DB1 database. Five gases namely hydrogen, methane, ethane, ethylene and acetylene forms the input features for the model. The performance of the model is analyzed with unipolar, bipolar and radial basis function (RBF) as activation functions. The training and testing efficiencies are calculated as shown in Table 6.
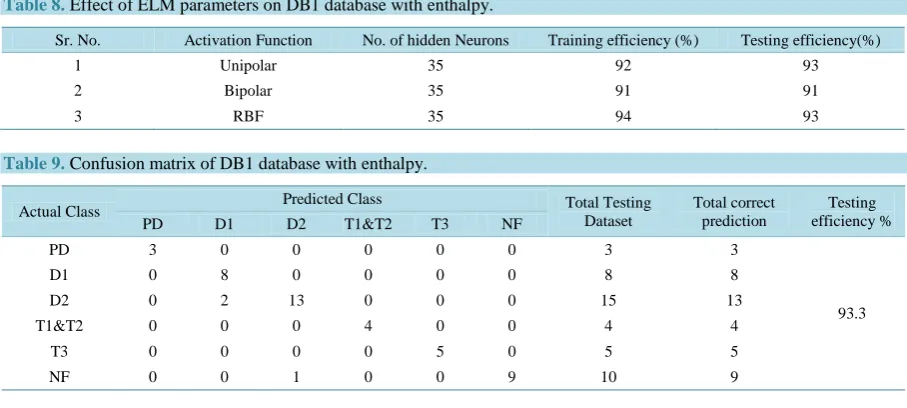
ELM classifier displays a confusion matrix showing the actual and predicted class. In the confusion matrix shown in Table 7, of the 3 cases of actual PD class, the system predicted 2 cases as PD and one case as class T1&T2. The system predicted all D1 class correctly. Of the 15 D2 class, 1 is classified as (T1&T2) class and 1 is classified as NF. With total 4 actual class of T1&T2, the system predicted 1 case as class of T1&T2 and 2 case as class T3 and 1 case as class NF. Out of five actual class of T3, 1 case is wrongly classified as class D2. All 10 actual class of NF is classified correctly. The overall testing efficiency is 84.4% using ELM with DB1 database and gas content as input.
[image:5.595.92.538.283.728.2]The energy dissipated within the transformer is directly related to the enthalpy of hydrocarbon gases. The gas concentrations are converted to the enthalpy. The enthalpy of hydrogen, methane, ethane, ethylene and acetylene are input features for the ELM-II model. The model is evaluated with different activation functions and number
Table 4. Typical DB2 database with input and output features.
Input Features Gas concentrations (parts per million, ppm)
Output features (Fault types )
H2 CH4 C2H4 C2H6 C2H2
169 16 6 2 0 Partial Discharge (PD)
577 3541 2928 521 7 Over Heating (OH)
116 50 50 2 284 Arcing (A)
100 722 450 31 360 Electrical &Thermal (E&T)
Table 5. DB2 dataset with output features.
Sr. No. Output features (Fault types) Training Dataset Testing Dataset Total Dataset
1 Partial Discharge (PD) 24 5 29
2 Over Heating (OH) 99 21 120
3 Arcing (A) 47 11 58
4 Electrical &Thermal (E&T) 9 3 12
Total dataset 179 40 219
Table 6. Effect of ELM parameters on DB1 database with gas concentration.
Sr. No. Activation Function No. of hidden Neurons Training efficiency (%) Testing efficiency (%)
1 Unipolar 35 92 93
2 Bipolar 35 91 91
[image:5.595.85.539.289.512.2]3 RBF 35 94 93
Table 7. Confusion matrix of DB1 database with gas concentration.
Actual Class Predicted Class Total Testing
Dataset
Total correct prediction
Testing efficiency %
PD D1 D2 T1&T2 T3 NF
PD 2 0 0 1 0 0 3 2
84.4
D1 0 8 0 0 0 0 8 8
D2 0 0 13 1 0 1 15 13
T1&T2 0 0 0 1 2 1 4 1
T3 0 0 1 0 4 0 5 4
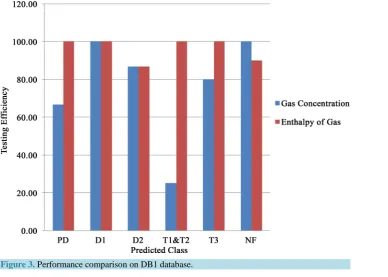
[image:5.595.88.538.605.720.2]Table 8.Effect of ELM parameters on DB1 database with enthalpy.
Sr. No. Activation Function No. of hidden Neurons Training efficiency (%) Testing efficiency(%)
1 Unipolar 35 92 93
2 Bipolar 35 91 91
[image:6.595.85.539.88.292.2]3 RBF 35 94 93
Table 9. Confusion matrix of DB1 database with enthalpy.
Actual Class Predicted Class Total Testing
Dataset
Total correct prediction
Testing efficiency %
PD D1 D2 T1&T2 T3 NF
PD 3 0 0 0 0 0 3 3
93.3
D1 0 8 0 0 0 0 8 8
D2 0 2 13 0 0 0 15 13
T1&T2 0 0 0 4 0 0 4 4
T3 0 0 0 0 5 0 5 5
NF 0 0 1 0 0 9 10 9
of neurons in the hidden layer and the results are tabulated in Table 8.
The simulation results are analyzed based on activation function, number of hidden neurons and gas concen-tration with enthalpy of gas. With gas concenconcen-tration as input feature, the activation function using unipolar and radial basis function perform better than the bipolar activation function. Similar results are obtained with en-thalpy of gas as input features. Optimum results are obtained with 35 neurons in the hidden layer.
In the example confusion matrix shown in Table 9, of the 3 cases of actual class of PD, the system predicted all correctly as class PD. Similarly, the system predicted all cases of class D1 also correctly. However for 15 cases of actual D2 class, the system predicted 13 cases as D2 class and 2 cases are wrongly classified as class D1. Similarly for 10 cases of actual class NF, 9 cases are predicted correctly as class NF and one wrongly predicted as class D2. The overall testing efficiency is 93.3% using DB1 database and enthalpy of gas as input feature.
With gas concentration as input feature, the activation function using unipolar and radial basis function per-form better than the bipolar activation function. Similar results are obtained with enthalpy of gas as input fea-tures. Optimum results are obtained with 35 neurons in the hidden layer. The simulation results obtained on DB1 database using enthalpy of gas as input feature is compared with conventional gas concentration as input feature and the results are shown in Figure 3. The overall testing efficiency is 84.4% using ELM with DB1 database and gas content as input feature. The testing efficiency improves to 93.3% using DB1 database and enthalpy of gas as input feature.
4. Application of ELM on DB2 Database
The DB2 database contains 219 records. Transformer fault classification of DB2 database is analyzed using MATLABTM software on ELM-III and ELM-IV models. In the ELM-III model, gas concentration (ppm) is tak-en as input features and partial discharge, over hating, arcing and thermal and electrical faults are taktak-en as out-put features.
The performance of the ELM model is evaluated using different activation functions and number of neurons in the hidden layer. The results showing training and testing efficiencies are shown in Table 10. Confusion ma-trix constructed for ELM-III model is given in Table 11.
The model predicted PD, OH, E&T class correctly whereas with 11 cases of actual class A (Arcing) , the sys-tem predicted 10 cases as class A and 1 case wrongly predicted as class E&T.
Model ELM-IV uses DB2 database and the enthalpy of gases are taken as input features. Partial discharge, overheating, arcing and electrical and thermal faults are treated as output features. The performance of ELM-IV is analyzed by varying the activation function and the number of neurons in the hidden layer and the results are shown in Table 12.
Figure 3. Performance comparison on DB1 database.
Table 10.Effect of ELM parameters on DB2 database with gas concentration.
Sr. No. Activation Function No. of hidden Neurons Training efficiency (%) Testing efficiency (%)
1 Unipolar 35 95 97
2 Bipolar 35 95 97
[image:7.595.86.541.80.728.2]3 RBF 35 94 95
Table 11. Confusion matrix of DB2 database with gas concentration.
Actual Class
Predicted Class Total Testing
Dataset
Total correct
prediction Testing efficiency %
PD OH A E&T
PD 5 0 0 0 5 5
97.5
OH 0 21 0 0 21 21
A 0 0 10 1 11 10
[image:7.595.138.527.84.361.2]E&T 0 0 0 3 3 3
Table 12. Effect of ELM parameters on DB2 database with enthalpy.
Sr. No. Activation Function No. of hidden Neurons Training efficiency (%) Testing efficiency (%)
1 Unipolar 35 95 100
2 Bipolar 35 95 100
3 RBF 35 95 97
Table 13. Confusion matrix of DB2 database with enthalpy.
Actual Class Predicted Class Total Testing
Dataset
Total correct prediction
Testing efficiency %
PD OH A E&T
PD 5 0 0 0 5 5
100
OH 0 21 0 0 21 21
A 0 0 11 0 11 11
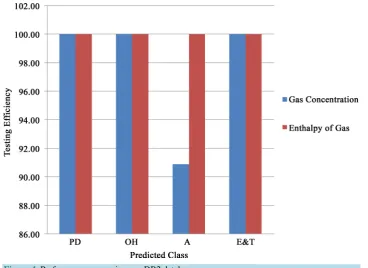
[image:7.595.87.542.380.434.2]Figure 4. Performance comparison on DB2 database.
The simulation results are analyzed based on the activation function, number of hidden neurons, gas concen-tration and enthalpy of gas. With gas concenconcen-tration as input features, the unipolar as well as bipolar activation function perform better than the radial basis function activation function. Also, when enthalpy of gas is used as input features, the unipolar, bipolar activation function perform better than radial basis activation function. Op-timum results are obtained with 35 neurons in the hidden layer. The simulation results obtained on DB2 data-base using enthalpy of gas as input feature is compared with conventional gas concentration as input feature and the results are shown in Figure 4.
ELM testing efficiency of 97.5% is achieved with gas concentration as input features and 100% with enthalpy of gas concentration as input features.
5. Conclusion
This research paper presented the application of ELM approach to transformer fault classification. The proposed method is simulated in MATLABTM Software. ELM method is validated on DB1 and DB2 database using four models. Conventional transformer fault classification based on gas concentration as input features is compared with fault classification using enthalpy of gas as input feature. The simulation carried out using DB1 database shows 84.4% testing efficiency with gas concentration as input feature and 93.3% with enthalpy as input feature. Results on DB2 database show 97.5% testing efficiency with gas concentration and 100% with enthalpy as input feature. The results show that ELM with enthalpy as input feature in fault classification of power transformer outperform over the conventional approach. It is proposed to use IEC gas ratios using enthalpy of gas in place of gas concentration as input feature in the future research work.
Acknowledgements
The authors would like to acknowledge the Principal, Dr. K. Ramar, Einstein College of Engineering, for sup-porting this research. The authors are also thankful to Mr. A. Amudhavanan, Managing Trustee, Einstein Col-lege of Engineering for granting permission to publish this paper.
References
[2] (2007) IEC Publication 60599, Mineral Oil-Impregnated Electrical Equipment in Service: Guide to the Interpretation of Dissolved and Free Gas Analysis.
[3] Kloppel, S., Stonnington, C.M., Dragnasski, C.C. and Scahill, R.I. (2008) Automatic Classification of MR Scans in Alzheimer’s Disease. Brain. http://dx.doi.org/10.1093/brain/awm319
[4] Yan, H. and Zhang, B. (2010) Transformer Fault Diagnosis Based on Support Vector Machine. IEEE International Conference on Computer Science and Information Technology, 2, 681-689.
[5] Huang, G.B., Zhu, Q.Y. and Siew, C.K. (2006) Extreme Learning Machine Theory and Applications. Neuro Compu-ting, 70, 489-501. http://dx.doi.org/10.1016/j.neucom.2005.12.126
[6] Gulloway, M.M. Texture Analysis Using Grey Level Run Lengths. Elsevier Inc.
[7] Deepa, S.N. and Arunadevi, B. (2013) Extreme Learning Machine for Classification of Brain Tumor in 3D MR Images.
Informatol, 46, 111-121.
[8] Zahangir Alam, M., Sidike, V.K. and Taka, T.M. (2015) State Preserving Extreme Learning Machine for Face Recog-nition. International Joint Conference on Neural Networks, 1-7.http://dx.doi.org/10.1109/ijcnn.2015.7280788
[9] Guang, B., Huang, A. and Siew, C.K. (2004) Extreme Learning Machine with Randomly Assigned RBF Kernels. The Proceedings of the Eighth International Conference on Control, Automation, Robotics and Vision.
[10] Mustapha, B., Abdelhakim, H. and Abderrahim, B. (2009) High Accuracy Localization Method Using AOA in Sensor Networks. Computer Networks, 53, 3076-3088. http://dx.doi.org/10.1016/j.comnet.2009.07.015
[11] Jakob, F. and James, J.D. (2015) Thermodynamic Estimation of Transformer Fault Severity. IEEE Transactions on Power Delivery, 39, 1941-1948.
[12] Jacob, F., Noble, P. and Dukarm, J. (2012) A Thermodynamic Approach to Evaluation of the Severity of Transformer Faults. IEEE Transactions on Power Delivery, 27, 554-560.http://dx.doi.org/10.1109/TPWRD.2011.2175950
Submit or recommend next manuscript to SCIRP and we will provide best service for you:
Accepting pre-submission inquiries through Email, Facebook, LinkedIn, Twitter, etc. A wide selection of journals (inclusive of 9 subjects, more than 200 journals) Providing 24-hour high-quality service
User-friendly online submission system Fair and swift peer-review system
Efficient typesetting and proofreading procedure
Display of the result of downloads and visits, as well as the number of cited articles Maximum dissemination of your research work