© 2017, IRJET | Impact Factor value: 5.181 | ISO 9001:2008 Certified Journal
| Page 612
Effect of Orientation on Response Spectrum Analysis of Plan Irregular
Building
Mohammad Usman Alvi, M-Tech (Structural and Foundation Engineering)
Rizwanullah, Assistant Professor
Department of Civil Engineering, Al-Falah University, Faridabad, India
---***---Abstract -Now a days high rise buildings have become a common trend to accommodate the increasing population in urban areas. These high rise buildings are most commonly are made up of Reinforced concrete. The Reinforced concrete multi storey buildings are subjected to most dangerous earthquakes. The behavior of a building during an earthquake depends on several factors, stiffness, adequate lateral strength and ductility, simple and regular configurations. It was found that main reason for failure of RC building is irregularity in its plan dimension and its lateral force resisting system. At the time of any earthquake, failure of structure starts at points of weakness. This weakness arises due to discontinuity in mass, stiffness and geometry of structure. The structures having this discontinuity are termed as irregular structures. Irregularities are one of the major reasons of failures of structures during earthquakes. Among all the factors configuration of a building is an important feature which has huge influence on the damage during the earthquake shaking. The feature of the regularity and symmetry in the overall shape of the building both in plan and elevation enormously affects the response of the building under static and dynamic loading. But nowadays the need and demand of the modern era and growing population has made the architects or engineers forced towards planning of Buildings with Plan Irregularity. So if a structure has to perform well in earthquake means it should possess adequate strength, stiffness, ductility and simple configuration. Therefore these types of structures should be well designed under earthquake loading accounting the specified seismic design philosophies so that they can sustain moderate to strong earthquakes. The structures are carefully analyzed by using methods Equivalent static method of analysis and Dynamic method of analysis.
Key Words-ETABs, Response Spectrum Analysis, Irregular Building, Non-Parallel Lateral Force Resisting System, Time Period, Static Base Shear, Story Stiffness, Story Drift, Over Turning Moments, Design Forces.
1 .INTRODUCTION
IS-1893-2016 (part 1) states that if a building possesses any of the following irregularity, the structure is to be considered as an irregular structure.
1) Torsional Irregularity 2) Re-entrant Corners
3) Floor Slabs having Excessive Cutouts or openings
4) Out of Plane offsets in vertical elements 5) Non-Parallel Lateral Force Resisting System 6) Stiffness Irregularity (Soft Storey)
7) Mass Irregularity
8) Vertical Geometric Irregularity
9) In-Plane Discontinuity in Vertical Elements Resisting Lateral Force
10)Strength Irregularity (Weak Storey) 11)Floating or Stub Column
12)Irregular Modes of Oscillation in Two Principal Plan Directions
Irregularities 1-5 are known as plan irregularities and when the lateral load resisting system is not oriented along mutually orthogonal horizontal directions, the structure shall be designed for the simultaneous effects due to full design earthquake load plus 30 percent of design earthquake along the other direction. Further if, effects due to vertical earthquake shaking are considered, 30 percent of vertical design earthquake load is also included while making load combinations of earthquake effects.
Regular building where the structure are formed by sub-systems which are perpendicular among other and parallel with the global axes, the principal direction of the earthquake loads is parallel with that global axes. However, for the irregular building structure, mostly the direction of the principal axes could not be determined in advance. In this case, the principal direction of earthquake loads shall be calculated using trial & error for a number of possibilities. Hence, it is quite often the Structural Engineer has to perform quite a number of structural analyses of the building, applying static lateral loads in incremental direction angles, e.g. every 5 or 10 degrees to obtain the “maximum” results using a “trial and error” method.
© 2017, IRJET | Impact Factor value: 5.181 | ISO 9001:2008 Certified Journal
| Page 613
Analysis. Behavior of building will be carefully studied in the light of IS-1893-2016 (part1) and comparing responses in the form of time period, static base shear, modal directional factors, modal participating mass ratios, stiffness, story displacement and design forces in an irregular structure having non-parallel lateral force resisting system with different orientation of the structure.
1.1 MODEL CONFIGURATION
Seismic Zone- V
Response Reduction Factor, R- 5 Importance Factor, I- 1
Soil Type- Type II
Height of the Building- 64 m
Column Dimensions- (300X750) mm Beam Dimensions- (300X450) mm Slab Thickness- 200 mm
Figure 1.1(a) - Plan View of Tower 1
[image:2.595.324.546.100.287.2]Figure 1.1(b) – Plan View of Tower 2
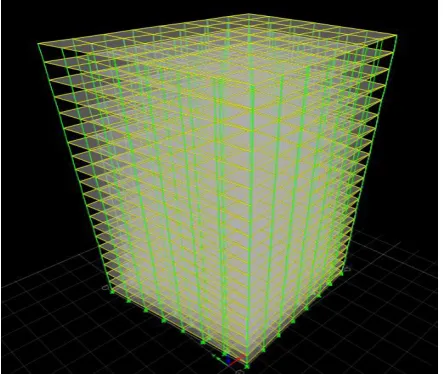
Figure 1.2- 3D View of Tower
1.2 TIME PERIOD
IS-1893-2016 defines different Sa/g values for different values of approximate time period (T).
The natural time period (T) for building with non-structural walls made up of masonry can be calculated by the following formula.
[image:2.595.52.273.334.483.2]Base dimension in the direction along the considered direction on shaking (Global X and Global Y) vary with the change in orientation of the building.
Table 1.1- Time Period for Tower 1 and Tower 2
Time Period Tower 1 Tower 2 Global X 0.9107 sec 0.9076 sec Global Y 0.9736 sec 0.9776 sec
1.3 DESIGN BASE SHEAR
The design base shear (VB) of any building can be calculated
by using the formula given in IS-1893-2016:
Where Ah = Design horizontal seismic coefficient
W = Seismic weight of the building
The Design horizontal seismic coefficient (Ah) is a function of
peak ground acceleration (z), Importance Factor (I), Response Reduction Factor (R) and Design acceleration coefficient (Sa/g) for different types of soil normalized
corresponding to 5 % damping.
[image:2.595.52.271.517.673.2]© 2017, IRJET | Impact Factor value: 5.181 | ISO 9001:2008 Certified Journal
| Page 614
Table 1.2- Design Base Shear of Tower 1 and Tower 2 for Equivalent Static Load
Design Base
Shear Tower 1 Tower 2
Global X(KN) 32026.0058 32144.9979 Global Y(KN) 29956.9033 29843.2493
1.4 STIFFNESS
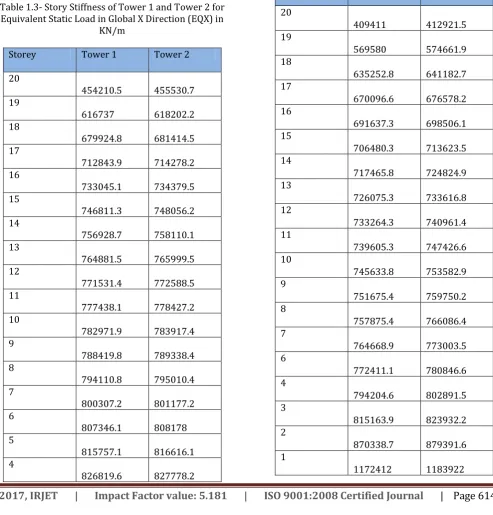
Table 1.3- Story Stiffness of Tower 1 and Tower 2 for Equivalent Static Load in Global X Direction (EQX) in
KN/m
Storey Tower 1 Tower 2
20
454210.5 455530.7 19
616737 618202.2
18
679924.8 681414.5 17
712843.9 714278.2 16
733045.1 734379.5 15
746811.3 748056.2 14
756928.7 758110.1 13
764881.5 765999.5 12
771531.4 772588.5 11
777438.1 778427.2 10
782971.9 783917.4 9
788419.8 789338.4 8
794110.8 795010.4 7
800307.2 801177.2 6
807346.1 808178 5
815757.1 816616.1 4
826819.6 827778.2
3
845663.3 846799.8 2
897228 898557.2
1
1193802 1195242 Ground Floor
14679896 14714969
Base 0 0
Table 1.4- Story Stiffness of Tower 1 and Tower 2 for Equivalent Static Load in Global Y Direction (EQY) in
KN/m
Storey Tower 1 Tower 2
20
409411 412921.5
19
569580 574661.9
18
635252.8 641182.7 17
670096.6 676578.2 16
691637.3 698506.1 15
706480.3 713623.5 14
717465.8 724824.9 13
726075.3 733616.8 12
733264.3 740961.4 11
739605.3 747426.6 10
745633.8 753582.9 9
751675.4 759750.2 8
757875.4 766086.4 7
764668.9 773003.5 6
772411.1 780846.6 4
794204.6 802891.5 3
815163.9 823932.2 2
870338.7 879391.6 1
© 2017, IRJET | Impact Factor value: 5.181 | ISO 9001:2008 Certified Journal
| Page 615
14432196 14555365 Base
0 0
1.5 MODAL DIRECTIONAL FACTORS
Table 1.5- Modal Direction Factors of Tower 1 for 1-10 Mode
Table 1.6- Modal Direction
Factors of Tower 2 for 1-10 Mode
[image:4.595.30.257.217.419.2] [image:4.595.308.530.418.611.2]Table 1.7- Modal Participating Mass Ratios of Tower 1 for 1-10 Modes
TABLE: Modal Participating Mass Ratios
Mode Period UX UY sec
1 4.982 0.0987 0.6138
2 4.835 0.6387 0.1221
3 4.499 0.0338 0.0331
4 1.633 0.0152 0.0749
5 1.587 0.0768 0.0192
6 1.482 0.0049 0.0041
7 0.943 0.0074 0.023
8 0.917 0.0241 0.0094
9 0.866 0.0024 0.0017
10 0.656 0.0048 0.0111
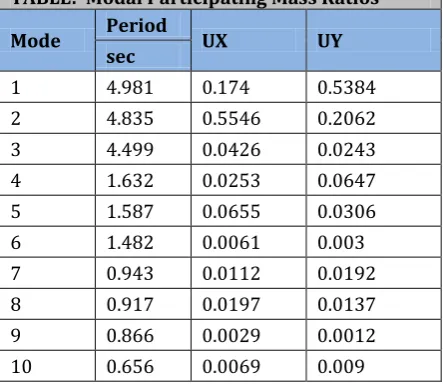
Table 1.8- Modal Participating Mass Ratios of Tower 2 for 1-10 Modes
TABLE: Modal Participating Mass Ratios
Mode Period UX UY sec
1 4.981 0.174 0.5384
2 4.835 0.5546 0.2062
3 4.499 0.0426 0.0243
4 1.632 0.0253 0.0647
5 1.587 0.0655 0.0306
6 1.482 0.0061 0.003
7 0.943 0.0112 0.0192
8 0.917 0.0197 0.0137
9 0.866 0.0029 0.0012
10 0.656 0.0069 0.009
1.7 MAXIMUM STORY DISPLACEMENTS
Table 1.9- Maximum Story Displacements of Tower 1 for 1st Mode
TABLE: Max Story Displacement
Story Elevation X-Dir Y-Dir
m mm mm
20 65 0.004129 0.007718
19 61.8 0.004085 0.007625
18 58.6 0.00402 0.007496
TABLE: Modal Direction Factors
Mode Period UX UY UZ RZ sec
1 4.982 0.128 0.798 0 0.074 2 4.835 0.828 0.159 0 0.013 3 4.499 0.044 0.043 0 0.913 4 1.633 0.157 0.763 0 0.08 5 1.587 0.792 0.195 0 0.014 6 1.482 0.052 0.042 0 0.906
7 0.943 0.22 0.673 0 0.107
8 0.917 0.711 0.277 0 0.012
9 0.866 0.069 0.05 0 0.881
10 0.656 0.274 0.619 0 0.107
TABLE: Modal Direction Factors
Mode Period UX UY UZ RZ sec
1 4.981 0.226 0.7 0 0.074
2 4.835 0.719 0.268 0 0.013 3 4.499 0.055 0.032 0 0.913 4 1.632 0.261 0.658 0 0.08 5 1.587 0.675 0.311 0 0.013
6 1.482 0.064 0.03 0 0.906
7 0.943 0.332 0.56 0 0.107
© 2017, IRJET | Impact Factor value: 5.181 | ISO 9001:2008 Certified Journal
| Page 616
17 55.4 0.003933 0.007325
16 52.2 0.003823 0.007114
15 49 0.003691 0.006861
14 45.8 0.003537 0.00657
13 42.6 0.003364 0.006241
12 39.4 0.00317 0.005876
11 36.2 0.002959 0.005478
10 33 0.00273 0.00505
9 29.8 0.002487 0.004594
8 26.6 0.002229 0.004114
7 23.4 0.00196 0.003612
6 20.2 0.001681 0.003092
5 17 0.001393 0.002558
4 13.8 0.001099 0.002015
3 10.6 0.000802 0.001467
2 7.4 0.000507 0.0009254
1 4.2 0.000226 0.0004122
Ground
Floor 1 1.70E-05 3.09E-05
[image:5.595.53.549.227.797.2]Base 0 0 0
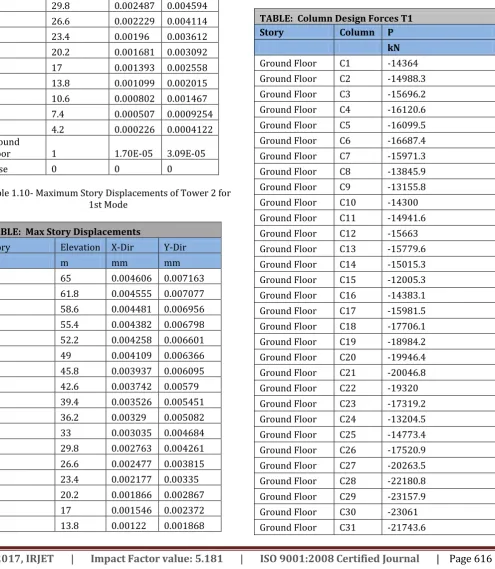
Table 1.10- Maximum Story Displacements of Tower 2 for 1st Mode
TABLE: Max Story Displacements
Story Elevation X-Dir Y-Dir
m mm mm
20 65 0.004606 0.007163
19 61.8 0.004555 0.007077
18 58.6 0.004481 0.006956
17 55.4 0.004382 0.006798
16 52.2 0.004258 0.006601
15 49 0.004109 0.006366
14 45.8 0.003937 0.006095
13 42.6 0.003742 0.00579
12 39.4 0.003526 0.005451
11 36.2 0.00329 0.005082
10 33 0.003035 0.004684
9 29.8 0.002763 0.004261
8 26.6 0.002477 0.003815
7 23.4 0.002177 0.00335
6 20.2 0.001866 0.002867
5 17 0.001546 0.002372
4 13.8 0.00122 0.001868
3 10.6 0.00089 0.00136
2 7.4 0.000563 0.000857
1 4.2 0.000252 0.000382
Ground Floor 1 1.89E-05 2.87E-05
Base 0 0 0
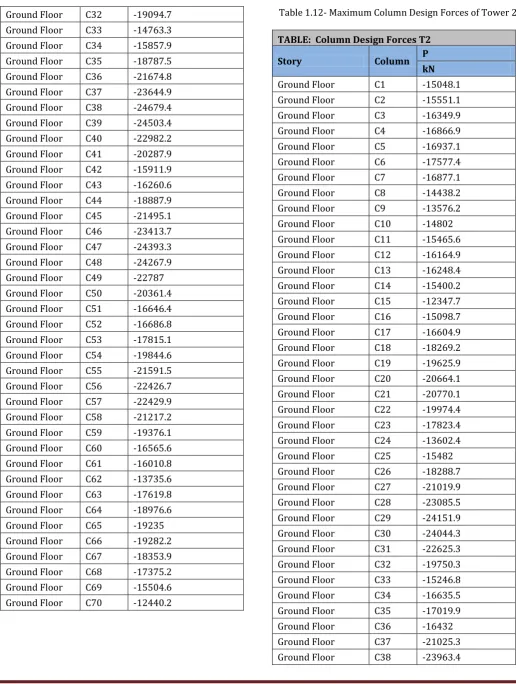
1.8 COLUMN DESIGN FORCES
[image:5.595.303.555.239.774.2]Table 1.11- Maximum Column Design Forces of Tower 1
TABLE: Column Design Forces T1 Story Column P
kN
© 2017, IRJET | Impact Factor value: 5.181 | ISO 9001:2008 Certified Journal
| Page 617
[image:6.595.35.552.93.778.2]Ground Floor C33 -14763.3 Ground Floor C34 -15857.9 Ground Floor C35 -18787.5 Ground Floor C36 -21674.8 Ground Floor C37 -23644.9 Ground Floor C38 -24679.4 Ground Floor C39 -24503.4 Ground Floor C40 -22982.2 Ground Floor C41 -20287.9 Ground Floor C42 -15911.9 Ground Floor C43 -16260.6 Ground Floor C44 -18887.9 Ground Floor C45 -21495.1 Ground Floor C46 -23413.7 Ground Floor C47 -24393.3 Ground Floor C48 -24267.9 Ground Floor C49 -22787 Ground Floor C50 -20361.4 Ground Floor C51 -16646.4 Ground Floor C52 -16686.8 Ground Floor C53 -17815.1 Ground Floor C54 -19844.6 Ground Floor C55 -21591.5 Ground Floor C56 -22426.7 Ground Floor C57 -22429.9 Ground Floor C58 -21217.2 Ground Floor C59 -19376.1 Ground Floor C60 -16565.6 Ground Floor C61 -16010.8 Ground Floor C62 -13735.6 Ground Floor C63 -17619.8 Ground Floor C64 -18976.6 Ground Floor C65 -19235 Ground Floor C66 -19282.2 Ground Floor C67 -18353.9 Ground Floor C68 -17375.2 Ground Floor C69 -15504.6 Ground Floor C70 -12440.2
TABLE: Column Design Forces T2
Story Column P kN
Ground Floor C1 -15048.1
Ground Floor C2 -15551.1
Ground Floor C3 -16349.9
Ground Floor C4 -16866.9
Ground Floor C5 -16937.1
Ground Floor C6 -17577.4
Ground Floor C7 -16877.1
Ground Floor C8 -14438.2
Ground Floor C9 -13576.2
Ground Floor C10 -14802
Ground Floor C11 -15465.6 Ground Floor C12 -16164.9 Ground Floor C13 -16248.4 Ground Floor C14 -15400.2 Ground Floor C15 -12347.7 Ground Floor C16 -15098.7 Ground Floor C17 -16604.9 Ground Floor C18 -18269.2 Ground Floor C19 -19625.9 Ground Floor C20 -20664.1 Ground Floor C21 -20770.1 Ground Floor C22 -19974.4 Ground Floor C23 -17823.4 Ground Floor C24 -13602.4
Ground Floor C25 -15482
Ground Floor C26 -18288.7 Ground Floor C27 -21019.9 Ground Floor C28 -23085.5 Ground Floor C29 -24151.9 Ground Floor C30 -24044.3 Ground Floor C31 -22625.3 Ground Floor C32 -19750.3 Ground Floor C33 -15246.8 Ground Floor C34 -16635.5 Ground Floor C35 -17019.9
Ground Floor C36 -16432
[image:6.595.37.282.99.703.2]© 2017, IRJET | Impact Factor value: 5.181 | ISO 9001:2008 Certified Journal
| Page 618
Ground Floor C39 -25636.9 Ground Floor C40 -25822.8
Ground Floor C41 -24692
Ground Floor C42 -22583.4 Ground Floor C43 -19677.6 Ground Floor C44 -17438.4 Ground Floor C45 -17175.1 Ground Floor C46 -21084.2 Ground Floor C47 -23749.2
Ground Floor C48 -25394
Ground Floor C49 -25518.1
Ground Floor C50 -24456
Ground Floor C51 -22428.7 Ground Floor C52 -19812.7 Ground Floor C53 -16686.9 Ground Floor C54 -17090.2
Ground Floor C55 -20042
Ground Floor C56 -22047.8
Ground Floor C57 -23400
Ground Floor C58 -23392.1 Ground Floor C59 -22488.5 Ground Floor C60 -20639.7 Ground Floor C61 -18680.2
Ground Floor C62 -13060
Ground Floor C63 -16084.1 Ground Floor C64 -18074.5 Ground Floor C65 -19165.2 Ground Floor C66 -20198.4 Ground Floor C67 -20170.9 Ground Floor C68 -19880.1 Ground Floor C69 -18425.5 Ground Floor C70 -14465.7 Ground Floor C69 -18425.5 Ground Floor C70 -14465.7
RESULT, ANALYSIS AND CONCLUSIONS
1) Approximate Time Period of Tower 1 and Tower 2 are different due to different base dimension in the direction of earthquake shaking.
For the Tower 1, base dimension along Global X is 40 m and 35 m in Global Y direction. For the Tower 2, base dimension along Global X is 40.3 m and 34.7 m in the Global Y direction. The Time period for Tower 1 in the Global X direction is 0.9107 seconds and in the Global Y direction is 0.9736
seconds. For the Tower 2, the Global X direction is 0.9076 seconds and in the Global Y direction is 0.9776 seconds.
2) Design Base Shear (VB) is dependent on the Sa/g values. It
is observed that the values of Sa/g are different for Tower 1
and Tower 2 in the Global X and Global Y directions.
Base Shear changes from 32026 KN in Tower 1 to 32144 KN in Tower 2 in the Global X direction. Also Base Shear changes from 29957 KN in Tower 1 to 29843 KN in Tower 2 in the Global Y direction.
3) It has been observed that Story Stiffness of Tower 2 is more than the Story Stiffness of Tower 1 as shown in Table 1.3 and 1.4. Story stiffness is calculated by the formula 12EI/h3 and moment of Inertia, I changes along its axis of
consideration.
4) Impact of Orientation of building on Response Spectrum Analysis can be seen by Modal Direction Factors in Table 1.5 and 1.6. It is clear from Modal Direction Factors that the building behaves differently when it is rotated by 7º as in Tower 2, than its normal configuration as in Tower 1.
The first two modes are translational and third mode is rotational in nature. For the Tower 1, directional factors of the fundamental mode of oscillation are 0.128 in Global X and 0.798 in Global Y direction. However for the Tower 2, the directional factors of the fundamental mode of oscillation are 0.226 in Global X and 0.7 in Global Y direction.
5) Also from the Figure 1.5 and 1.6, it can be seen that the Time Period for the fundamental mode of oscillation changes for Tower 1 and Tower 2.
For the Tower 1, the Time Period for the fundamental mode of oscillation is 4.982 seconds whereas for the Tower 2, the Time Period for the fundamental mode of oscillation is 4.981 seconds.
6) Similarly variation is also observed in Modal Participating Mass Ratios as seen in the Table 1.7 and 1.8. In the fundamental mode of oscillation, participating mass ratio is 9.87% in Global X direction, whereas in Global Y direction the participating mass ratio is 61.38% in Tower 1.
For Tower 2, the modal participating mass ratio in Global X is achieved about 17.4% and 53.84% in Global Y direction.
7) Maximum Story Displacement is more in Tower 1 as compared to Tower 2 in the first mode of oscillation as shown in Table 1.9 and 1.10.
© 2017, IRJET | Impact Factor value: 5.181 | ISO 9001:2008 Certified Journal
| Page 619
1) Toshihiko Hisada, Masamitsu Miyamura “Studies on the Orthogonal Effects in Seismic Analyses” presented at the proceedings of Ninth World Conference on Earthquake Engineering (August 2-9, 1988).
2) Edward L. Wilson, Iqbal Suharwardy, and Ashraf Habibullah (1995) “A Clarification of the Orthogonal Effects in a Three‐Dimensional Seismic Analysis”.