© 2018, IRJET | Impact Factor value: 6.171 | ISO 9001:2008 Certified Journal | Page 488
STABILIZATION OF BLACK COTTON SOIL USING GROUNDNUT SHELL ASH
A.PARVATHY KARTHIKA¹, MUTHUKUMAR²
¹BE student, Dept of Civil Engineering, Dr. Sivanthi aditanar college of engineering, Tiruchendur. ²Assistant Professor, Dept of Civil Engineering, Dr. Sivanthi aditanar college of engineering, Tiruchendur. ---***---
Abstract- Therefore this study is to find the use of
Groundnut shell ash as a stabilizing agent for improving the properties of soil. Groundnut shell is an agricultural waste obtained from the milling groundnut. Groundnut shell ash generated from the burning of groundnut in open air for 4 hours. Few attempts have been made with groundnut shell ash with the combination of other materials on soil stabilization, but very scanty attempts have been made to work on only with groundnut shell ash on soil stabilization. %. In our project, groundnut shell ash was added from 2% to12% at 2% interval to soil and examining the optimum percentage of groundnut shell ash. The index properties of the soil are liquid limit, plastic limit, shrinkage limit, free swell index and specific gravity are done. The optimum usage of groundnut shell ash added to the soil is 6%.
Key words: Groundnut shell ash, soil stabilization, index properties, optimum usage.
1. INTRODUCTION
Black cotton soil is highly clayey soil. The black colour in the black cotton soil is due to presence of titanium oxide in small concentration. The black cotton soil has more montmorillonite in structure and black or blackish grey in structure. It is the main reason for expansive characteristics of soil. It has very low bearing capacity high swelling and shrinkage characteristics.
Problem Associated with Black cotton soil High Compressibility
Black cotton soils are highly plastic and compressible, when they are saturated. Footing, resting on such soils undergoes consolidation settlements of high magnitude.
Swelling
A structure built in a dry season, when the natural water content is low shows different movement as result of soil during subsequent wet season. This causes structures supported by such swelling soils to lift up and crack. Restriction on having developed swelling pressure making the structure suitable.
Shrinkage
A structure built at the end of the wet season when the natural water content is high, shows settlement and shrinkage cracks during subsequent dry season.
2. MATERIALS USED
2.1 Material collection
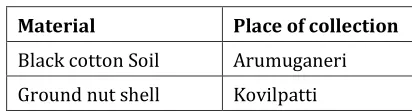
[image:1.612.340.546.344.400.2]The following table represents the place of collection of materials for soil stabilization.
Table -1: Material collection
Material Place of collection
Black cotton Soil Arumuganeri Ground nut shell Kovilpatti
2.2 Groundnut shell ash
Groundnut shell were spread on the ground and air dried for 2 days to facilitate easy milling. After air drying the groundnut shells were manually broken and milled into normal temperature (37◦c) ash forms which were collected in polythene bags. The groundnut shell ash was finally sieved through 425µ sieve.
2.3. Properties of groundnut shell ash
The following are some of the properties of powder. Groundnut shell ash is odourless.
Groundnut shell ash contains of CaO and remaining consists of Al2O3, SiO2, Fe2O3,MnO and MgO
3. MIX PROPORTIONS
© 2018, IRJET | Impact Factor value: 6.171 | ISO 9001:2008 Certified Journal | Page 489
4. RESULTS AND DISCUSSIONS
[image:2.612.334.564.129.272.2]4.1.1 Determination of specific gravity of soil
Table -2: Specific gravity of soil
Average specific gravity = 2.54
[image:2.612.30.296.157.348.2]4.1.2 Determination of free swell index of soil
Table -3: Free swell index limit of soil
Differential free swell Degree of expansiveness
< 20 Low
20 – 35 Moderate
35 – 50 High
>50 Very high
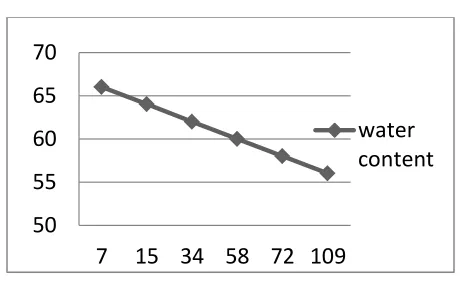
4.1.3 Determination of liquid limit of soil
Table- 4: Liquid limit of soil
S.No Weight
of soil(g) Water added (ml) Water content
(%)(W)
No of
blows(N)
1 150 84 58 109
2 150 87 56 72
3 150 90 60 58
4 150 93 62 34
5 150 96 64 15
6 150 99 66 7
Liquid limit (wL) = Water content corresponding to 25
blows
= 63.5%
Figure -1: Liquid limit of soil
4.1.4 Determination of plastic limit of soil
Weight of empty pan(W1) = 13 g
Weight of pan + wet soil(W2) = 25.5 g
Weight of pan + dry soil(W3) = 21.5 g
Plastic limit (wP) = 47%
Plasticity Index (IP)= Liquid limit – Plastic limit
= 63.5 – 47 = 16.5 %
From the A – line chart, the soil is classified as Clay of Intermediate Compressibility.
4.1.5 Determination of shrinkage limit of soil
Weight of shrinkage cup W1 = 30 g
Weight of shrinkage cup + wet pat W2 = 62.5 g
Weight of shrinkage cup + dry pat W3 = 47 g
Weight of dry pat Wd = 17 g
Weight of water Ww = W2 – W3 = 15.5
g
Weight of mercury filling shrinkage cupW1= 582.5g
Volume of shrinkage dish V = W1 / 13.6
= 337.5 / 13.6
= 24.82 ml Weight of mercury displaced by dry pat W2 = 142 g
50
55
60
65
70
7
15 34 58 72 109
water
content
S. No Description Trial
1
Trial 2
Trial 3
1 Weight of
pycnometerW
1(g)
44.5 44.5 44.5
2 Weight of
pycnometer+soilW
2(g)
75 76 68.5
3 Weightofpycnometer+so il+waterW
3(g)
76 119.5 116
4 Weight of
pyconometer+waterW
4(
g)
101.5 101.5 101.5
[image:2.612.31.290.418.501.2]© 2018, IRJET | Impact Factor value: 6.171 | ISO 9001:2008 Certified Journal | Page 490
Volume of mercury displaced Vd = 142 / 13.6
= 10.44 cm3
Shrinkage limit (wS) = ( ) ( )
= 12 %
4.1.6 Standard proctor compaction test for soil
Diameter of mould = 10 cm
Height of mould = 13 cm Weight of mould = 2136 g
Volume of mould = 1021.02cm3
Figure -2: Compaction curve for soil From the compaction curve,
Maximum dry density = 1.260 g/cc
Optimum moisture content = 18%
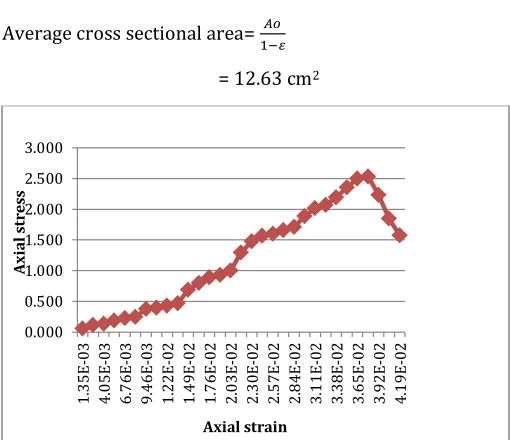
4.1.7 Unconfined compressive strength test for soil
Initial length of specimen = 7.4 cm
Initial diameter of specimen = 3.9 cm Initial weight of specimen = 148 g
Final weight of specimen = 147g Final length of specimen = 7.0 cm
Final diameter of specimen = 4.1 cm Initial area of specimen A0 = (π/4) × 3.92
= 11.945 cm2
Axial strain ( ) =
= 0.05405
Average cross sectional area=
= 12.63 cm2
Figure -3: Stress strain curve for soil Unconfined compressive strength = 252.9kN/m 2
[image:3.612.323.578.94.314.2]The following table represents the index and engineering properties of soil
Table -5 : Properties of soil
1.18 1.2 1.22 1.24 1.26 1.28
10 12 14 16 18 20 22
Dry density
Water content (%)
0.000 0.500 1.000 1.500 2.000 2.500 3.000
1.
35
E-03
4.
05
E-03
6.
76
E-03
9.
46
E-03
1.
22
E-02
1.
49
E-02
1.
76
E-02
2.
03
E-02
2.
30
E-02
2.
57
E-02
2.
84
E-02
3.
11
E-02
3.
38
E-02
3.
65
E-02
3.
92
E-02
4.
19
E-02
Axial strain
Axi
al
s
tr
es
s
S.No DESCRIPTION RESULT
1 Colour Black
2 Atterberg limits
i Liquid limit 63.5%
ii Plastic limit 38.5%
iii Shrinkage limit 12%
3 Free swell index 20%
4 Specific Gravity 2.54
5 Compaction
characteristics
i Optimum Moisture
Content 18%
ii Maximum dry density 1.260 g/cc 6 Unconfined compressive
strength 252.9kN/m
2
7 Grain size distribution
i Gravel 0%
ii Sand 12.3%
iii Clay and silt 87.7%
8 Unified soil
© 2018, IRJET | Impact Factor value: 6.171 | ISO 9001:2008 Certified Journal | Page 491
4.2 Properties of soil with the addition of groundnut shell ash
4.2.1 Variation of liquid limit, plastic limit and plasticity index
[image:4.612.332.568.208.361.2]The following table describes about the atterberg limits of soil with the addition of different percentage of groundnut shell ash.
Table -6: Variation of liquid limit, plastic limit and
plasticity index with the addition of groundnut shell ash
S.No Amount of groundnut
shell ash
(%)
Liquid limit (%)
Plastic limit (%)
Plasticity index (%)
1 0 63.5 38.50 25.00
2 2 62.5 41.70 20.80
3 4 62.0 45.45 16.55
4 6 61.0 47.00 14.00
5 8 62.8 50.60 12.20
6 10 67.8 48.67 19.13
7 12 69.5 43.50 26.00
From table 6, it is observed that the value of liquid limit is approximately decreased by 1% with the addition of different percentage of groundnut shell ash to the soil and the value of plastic limit is increased with the addition of different percentage of groundnut shell ash. Thus the plasticity index values are decreased. With the addition of 2% to 12% of groundnut shell ash at 2% interval to the soil reduces the plastic index and change the soil to non-plastic state .After 6% of groundnut shell ash, the liquid limit value is increased and thereby increasing the plasticity index of soil.
Figure -4: Variation of liquid limit with the
addition of groundnut shell ash
[image:4.612.44.282.232.392.2]Figure 4 represents the variation of liquid limit with the addition of groundnut shell ash to the soil. The liquid limit value is decreased gradually when the groundnut shell ash is added from 2% to 6% and it gradually increasesfrom8% at the interval of 2% to the soil. The gradual decrease in the value of liquid limit is due to the porous property of groundnut shell ash. The decrease in the liquid limit was attributed to the flocculation and agglomeration of clay particles and reduction in surface area and increase in strength.
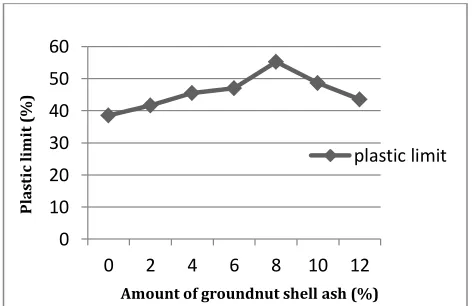
Figure -5: Variation of plastic limit with the addition of
groundnut shell ash
[image:4.612.334.565.533.680.2]Figure 5 represents the variation of Plastic limit with the addition of groundnut shell ash to the soil. The plastic limit value is decreased gradually when the groundnut shell ash is added from 2% to 6% and it gradually increased after 6% at an interval of 2% to the soil.Increase in the addition of groundnut shell ash to the soil sample caused a change in the liquid limits and plastic limits, which consequently affects the plasticity index of the soil. Increase in the plastic limit from 38.5% to 55% is due to increase in the amount of fines amount.
Figure-6: Variation of Plasticity index with the addition of
Groundnut shell ash.
56 58 60 62 64 66 68 70 72
0 2 4 6 8 10 12
Li
q
u
id
li
m
it
(%)
Amount of groundnut shell ash (%)
0 10 20 30 40 50 60
0 2 4 6 8 10 12
plastic limit
Amount of groundnut shell ash (%)
P
la
st
ic
li
m
it
(
%)
0 5 10 15 20 25 30
0 2 4 6 8 10 12
plasticity index
Amount of groundnut shell ash
P
la
st
ic
it
y
in
d
ex
[image:4.612.43.283.540.690.2]© 2018, IRJET | Impact Factor value: 6.171 | ISO 9001:2008 Certified Journal | Page 492 Increase in the addition of groundnut shell ash to the soil
sample caused a change in the liquid limit and plastic limit, which consequently affects the plasticity index of the soil. The plasticity index of the soil is reduced from 25% to 19.3% with the addition of groundnut shell ash. The reduction of plasticity index is an indication improvement of soil property.
4.2.2 Variation of pH value with the addition of Groundnut shell ash
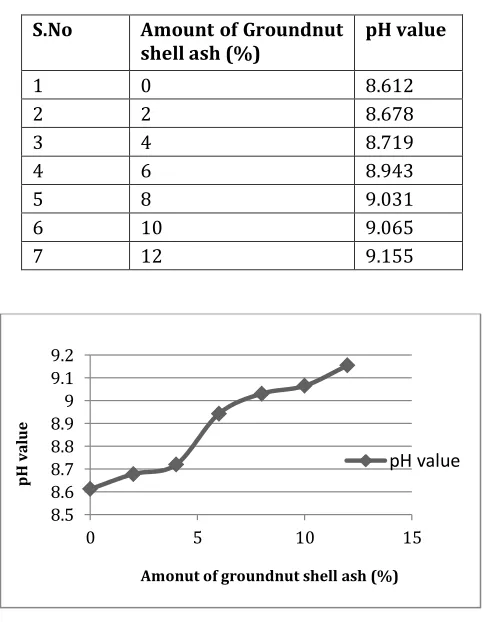
[image:5.612.41.284.256.567.2]The following table describes about the variation of pH value of soil with the addition of groundnut shell ash.
Table -7: pH value of soil
S.No Amount of Groundnut
shell ash (%) pH value
1 0 8.612
2 2 8.678
3 4 8.719
4 6 8.943
5 8 9.031
6 10 9.065
7 12 9.155
Figure -7: Variation of pH value with the addition of
Groundnut shell ash
The pH is the negative log of H+ ion concentration. From fig
7 the pH of the soil is 8.612 on adding groundnut shell ash from 2 to 12% the pH value increases gradually from 8.612 to 9.155.
5. CONCLUSION
The following conclusions were made from this experimental study
1. We can utilize the groundnut shell waste as a useful soil stabilizing material.
2. The optimum usage of groundnut shell ash added to the soil is 6%
REFERENCES
1. Gajera, N.V., Thanki, K.R. (2015)” Stabilization analysis of black cotton soil by using Groundnut shell ash” International Journal for Innovative Research in Science and Technology.,Vol.2,PP 158-162
2. George Rowland Otoko, (2014)”Stabilization of Nigeria Deltaic clay with groundnut shell ash” International Journal of Engineering and Technology Research., Vol.2, pp 1-11
3. Ijimdiya, T.S.,Ashmiyu,A.L., and Abubakar, D.K., (2012)” Stabilization of black cotton soil using groundnut shell ash” Electronic Journal of Geotechnical Engineering., Vol.17, pp 3645-3652.
4. IS 2720 (Part VII-1972), Methods of test for soils,Part XL, Determination of free swell index of soil.
5. IS 2720 (Part XL-1977), Methods of test for soils, Part XL, Determination of free swell index of soils.
6. IS 2720 (Part III-1980), Methods of test for soils, Part III, Determination of Specific gravity.
7. IS 2720 (Part VIII-1983), Methods of test for soils, Part III, Determination of water content-dry density relation using heavy compaction.
8. IS 2720 (Part V-1985), Methods of test for soils, Part V, Determination of liquid and plastic limit.
9. IS 2720 (Part X-1991), Methods of test for soils, Part X, Determination of unconfined compressive strength.
10. Punmia.B.C., Ashok Kumar Jain and Arun Kumar Jain (2005) ‘Soil Mechanics And Foundations’,16th
edition, Laxmi Publications (P) Ltd, 113, Golden House, Daryaganj, New Delhi-110 002.
11. Prakash chavarand Nagakumar,M.S.(2014)”Study on soil stabilization by using Baggage ash” IJSRET, pp 89-94.
8.5 8.6 8.7 8.8 8.9 9 9.1 9.2
0 5 10 15
pH value
Amonut of groundnut shell ash (%)
p
H
v
al
u