2019 International Conference on Information Technology, Electrical and Electronic Engineering (ITEEE 2019) ISBN: 978-1-60595-606-0
Study on Strawberry CO2 Gas Fertilizer in Greenhouse
Based on BP Neural Network
Wei-tao QIAN
1, Yong LIU
1,*, Yan-chao LI
1, Tao-tao SHEN
1, Ting-ting XU
1,
Xin-xin WANG
1, Wen-qing XIE
1, Chao LI
1and Hua-wei SUN
21College of Electronics and Engineering, Heilongjiang University, Harbin 150080, China
2Heilongjiang Eastern Water Saving Equipment Co., Ltd., Suihua 150000, China
*Corresponding author
Keywords: Greenhouse, CO2, BP neural network, Illumination, Photosynthetic rate, Light intensity.
Abstract. This paper takes greenhouse greenhouses in northern regions such as Heilongjiang as the research environment, and takes "Hong yan" strawberries as research objects. According to the non-linear effect of photosynthesis on greenhouse environmental factors, BP neural network was used to identify the nonlinearity, and a CO2 fertilization technology suitable for greenhouse strawberry greenhouse was developed. Combined with the changes of illumination and CO2 concentration in greenhouses and the growth of strawberries in greenhouses, BP neural network was used to establish the photosynthetic rate of strawberry in greenhouse and the quantitative models of the two, and the photosynthesis of strawberry was predicted under different greenhouse conditions. Rate to measure the growth of strawberries, and quantitative control of strawberry yield under greenhouse conditions.
Introduction
Overall Design of the System
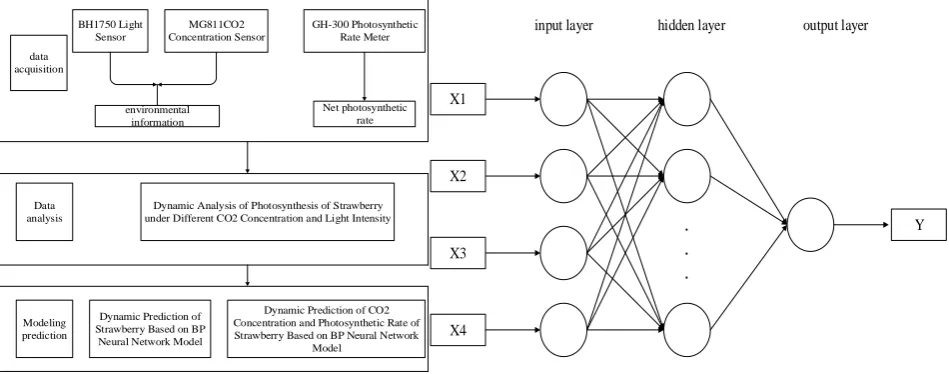
The overall design of the system is shown in Figure 2.1. It consists of three parts: data acquisition, data analysis, model establishment and prediction. Among them, the data acquisition includes using BH1750 illumination sensor and MG811CO2 concentration sensor to dynamically obtain the light intensity and CO2 concentration information in the greenhouse through real-time establishment of the website, and obtain the net photosynthetic rate of strawberry by using GH-300 portable photosynthetic rate meter. In the data analysis part, the effects of long-term application of CO2 on the growth physiology of strawberry crops were studied by analyzing the photosynthesis dynamics of strawberry with different light intensity and different CO2 concentration, which laid a theoretical foundation for the establishment of strawberry photosynthetic rate model. In the model establishment and prediction part, the environmental information of the treated greenhouse is used as the model input parameter, and the BP neural network is used as the main training method to establish the prediction model. The purpose is to change the solar mobilization rate and CO2 of the strawberry crop under variable environment. The relationship between concentration and net photosynthetic rate is accurately predicted[11].
BH1750 Light Sensor MG811CO2 Concentration Sensor GH-300 Photosynthetic Rate Meter environmental information Net photosynthetic rate data acquisition
Dynamic Analysis of Photosynthesis of Strawberry under Different CO2 Concentration and Light Intensity Data
analysis
Modeling prediction
Dynamic Prediction of Strawberry Based on BP
Neural Network Model
Dynamic Prediction of CO2 Concentration and Photosynthetic Rate of Strawberry Based on BP Neural Network
Model
X1
X2
X3
X4
input layer hidden layer output layer
Y
[image:2.595.61.536.291.478.2]. . .
Figure 2.1. Overall system design. Figure 3.1. Topology of a 3-layer BP neural network.
BP Neural Network Prediction Model
Principle of BP Neural Network
BP neural network is a multi-layer feedforward neural system. The main features of the BP network are: signal forward transmission, error back propagation, in the forward transmission, the input signal is processed layer by layer from the output layer through the hidden layer. Until the output layer, the god of each layer will only affect the state of the neurons in the next layer. If the output layer does not get the expected output, it will go to the back propagation and adjust the threshold of the network weight according to the prediction error. The BP neural network predictor output is continually approached to the desired output. The BP neural network is also known as the Back Propagation Neural Network, which is a multi-layered forward neural network. Its main features are forward propagation of signals and back propagation of errors. The topology of the BP neural network is shown in Figure 3.1.
1m m k k
p
C
(1)Where p is the number of samples, m1 is the number of hidden layer nodes, and m is the number of input layer units.km1When, take
m1k
C is 0.
(2) Where y is the number of output nodes, constant b=1 10 .
Kolmogorov's theorem[10], given any continuous function f:Um=>Ry,f(X)=Y, where U is a closed
unit interval [0,1], f can be accurately implemented with a three-layer forward network The first layer of the network has m processing units, the middle layer has 2m+1 processing units, and the third layer has m processing units. Neural network training can also be used to determine the number of hidden layers. Firstly, according to the empirical formula, the range of nodes in the hidden layer is determined. A BP network with a variable number of neurons in the hidden layer is designed, and the best is determined by error comparison. The number of hidden layer neurons.
According to the empirical formulas of (1) and (2), the number of neurons in the hidden layer is 20, and the number of neurons in the output layer is 1.
In this paper[9], the root mean square error RMSE (Root Mean Squared Error) and relative error
RE (Relative Error) are used to analyze the agreement between the simulated value and the measured value. which is
2 1 ( ) n i i i SIM OBS RMSE n
(3) 1 ( ) / 100% ni i i
i
SIM OBS OBS RE n
(4) Where OBSi is the measured value, which refers to the measured photosynthetic rate of strawberry plants in the greenhouse; SIMi is the simulated value of the corresponding strawberry photosynthetic rate; n is the sample capacity. The smaller the value of RMSE and RE, the smaller the deviation between the simulated value and the measured value, indicating that the prediction accuracy of the model is higher.Establishment of Predictive Models
The sample of this experiment is to use two strawberry greenhouses in Suihua County, Heilongjiang Province. Because there are many samples of strawberry seedlings planted, the common cross-validation method is adopted, that is, all the samples are divided into K parts, and the number of each sample is generally equal or similar. Take one copy of the test sample and the remaining K+1 as a training sample. This process is repeated K times, and the final average test results can measure the performance of the model and make data for predicting strawberry growth. In order to achieve better prediction results, the original data before network training is preprocessed, and all input and output data are normalized.
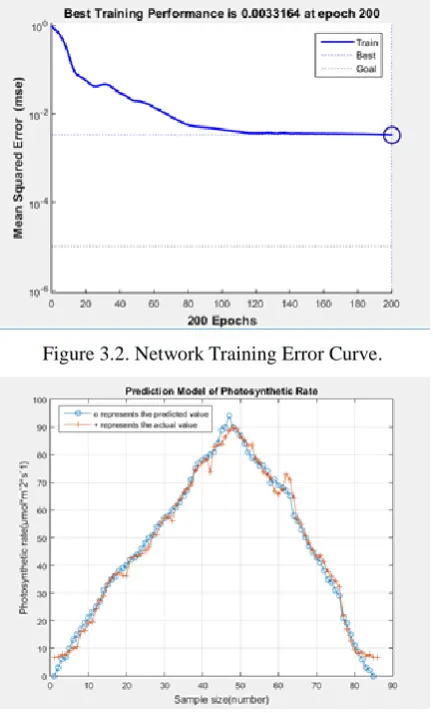
We first use four network training parameters as performance evaluation indicators for model prediction accuracy, namely maximum training times, training requirements accuracy, learning rate and display training iterative process, and use the minmax function to find the range of input samples. In this paper, the photosynthesis rate of 83 strawberries was collected as sample data for training. The training results are shown in Figure 3.2. It can be seen from the figure that after 200
1
Analysis of Prediction Results
[image:4.595.191.408.304.661.2]According to a series of network weights and thresholds obtained by training, input prediction samples are used for network prediction. Figure 3.3 shows the fitting of the simulated and measured values of the photosynthesis rate of strawberry plants in winter sheds. Figure 3.3 shows the strawberry plants in the winter model. The coefficient of determination of the predicted value and the measured value at different time periods are above 0.95, and the relative error of photosynthetic rate is too large, which may be related to the low light intensity in winter. The prediction curve of photosynthetic rate of strawberry plants was basically consistent with the trend of the measured curve. The fitting accuracy of the predicted value and the measured value were higher than the fitting degree of the photosynthetic rate of strawberry plants during training, indicating that the model had certain predictive ability. Can be used for forecasting small environments in greenhouses. Figure 3.4 is the error curve. It can be seen from the figure that the error of this prediction model is small, and the basic control is between (-4, 4). Occasionally, some data will be degraded and negligible, so we can get the conclusion. The established network prediction model has certain practical application ability, which can be used to predict the photosynthetic rate of greenhouse plants and increase the yield of greenhouse crops.
Figure 3.2. Network Training Error Curve.
Figure 3.4. Error curve.
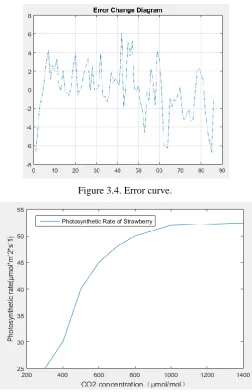
Figure 3.5. Photosynthetic rate corresponding to different CO2 concentrations at 40klx intensity.
Analysis of Photosynthetic Rate Results
According to the research, the CO2 concentration in the greenhouse is between 500~l000 μmol/mol, so the photosynthesis rate of the strawberry with different light intensity in the model C02 concentration value is predicted. In this paper, BP neural network was used for modeling. In MATLAB, the photosynthesis rate of strawberry plants was predicted by different CO2 concentration values under 40klx.As shown in Figure 3.5, similar photosynthetic rates can be predicted for different CO2 concentrations at any given intensity, and finally the best light intensity and appropriate CO2 concentration can be obtained, followed by photosynthesis. It can be seen from Figure 4.5 that the greenhouse cannot be used for CO2 fertilization blindly. According to the reasonable photosynthesis range of strawberry plants, the appropriate CO2 concentration should be applied, which will not cause waste and promote crop growth, but also according to the market demand and Social factors such as price control crop yield and quality by controlling indoor CO2 concentration.
Conclusions and Discussion
that the greenhouse strawberry model was more accurate and could be used as the basis for greenhouse system CO2 fertilization technology and strawberry growth control. The photosynthetic rate of strawberry plants decreased at noon, which may be caused by the “noon break” phenomenon of the plants. The specific reasons should be further analyzed from the aspects of stomatal conductance and stomatal limitation..
The neural network model is based on a large amount of training data. The simulation accuracy depends on the acquisition of training data. The model is manually adjusted and the model of the improved algorithm is used to simulate the greenhouse microclimate. This way, the neural network can reach the physical model. The accuracy achieved, on the other hand, also determines the limitations of the neural network, that is, it can only simulate a specific type of greenhouse in a specific time period, and is not universally representative. The parameters of the prediction model of strawberry plants in winter greenhouses in Heilongjiang Province are only for greenhouses in specific environments, and cannot be directly applied to the simulation of photosynthetic rate in different types of greenhouses in different geographical periods.
Acknowledgement
Project supported by the National Natural Science Foundation of China (Grant No. 61505050, 61501176), Heilongjiang Province Natural Science Foundation (Grant No. F2015015), Outstanding Young Scientist Foundation of Heilongjiang University (Grant No. JCL201504), China Postdoctoral
Science Foundation (Grant No. 2014M561381), Heilongjiang Province Postdoctoral
Foundation(Grant No. LBH-Z14178), Special Research Funds for the Universities of Heilongjiang Province (Grant No. HDRCCX-2016Z10), University Nursing Program for Young Scholars with Creative Talents in Heilongjiang Province(Grant No. UNPYSCT-2017116), Science and Technology Innovation Talent Research Special Fund Project of Harbin(Grant No. RC2017JQ009003), and Postdoctoral research initiation fund project settled in Heilongjiang.
References
[1] He Chaoxing, Zhang Zhibin, Wang Huaisong, et al. Carbon dioxide fertilization technology for vegetable cultivation (2) [J]. Chinese Vegetables, 2000 (5): 51-53.
[2] Tong Yuxin, Cheng Ruifeng, Wang Jun, et al. Influencing factors and control strategies of CO2
utilization efficiency in facility agriculture[J].Journal of Agricultural Mechanization
Research,2008(12):17-20.
[3] Zhang Man, Li Ting, Ji Yuhan, et al. Optimization of CO2 Enrichment Strategy in Greenhouse Tomato Based on BP Neural Network Algorithm[J]. Journal of Agricultural Mechanization, 2015(46):
[4] Jiang Yiqiong, Zhang Man, Li Ting, et al. CO2 concentration monitoring system based on WSN in solar greenhouse[J]. Journal of China Agricultural University. 2014.19(4): 166-171.
[5] Wang Weizhen, Zhang Man, Sha Sha, et al. Prediction of photosynthetic rate of greenhouse tomato based on WSN[J]. Transactions of the Chinese Society of Agricultural Machinery, 2013(10): 192-197.
[6] Jin Zhifeng, Fu Guozhen, Huang Haijing, et al. Study on temperature prediction model in
Yangmei greenhouse based on BP neural network[J].Agrometeorology in China. 2011(08):362-376.
[7] Jie Hea,Paul Thomas Austin, Michale A Nichol, et al. Elevated root-zone CO2 protects lettuce plants from midday depression of pho-tosynthes[J].Environment and Experimental Botany, 2007, 61:94-101.
[9] Catherine FB, Pierre LC. Neural network modeling of organics removal by activated carbon cloths[J].Envir. Engrg. 2001(10):889 -894.
[10] Li Yingxia, Du Shangfeng. Research progress of intelligent control algorithm for greenhouse environment in China [J]. Journal of Agricultural Engineering, 2004 (02): 267-272.
[11] Li Liangchen. Calculation Method of Heat and Humidity in Protected Ground Facilities[J]. Journal of Northwest Agricultural University, 1991, 19(4): 25-32.