TEXTURE CLASSIFICATION USING RANDOM FORESTS
AND SUPPORT VECTOR MACHINES
1MOHAMMED M. AL SAMARRAIE 2MD JAN NORDIN, 3GHASSAN JASIM AL-ANIZY
1
Ministry of Electricity, Iraq
2,3
Faculty of Information Science and Technology,Universiti Kebangsaan Malaysia, UKM, Bangi, Malaysia
E-mail: [email protected], [email protected], [email protected]
ABSTRACT
Texture analysis is considered fundamental and important in the fields of pattern recognition, computer vision and image processing. Texture analysis mainly aims to computationally represent an intuitive perception of texture and to facilitate automatic processing of the texture information for artificial vision systems. In this paper, we have compared between texture classification methods based on the Random Forest (RF) and Support Vector Machine (SVM) classifiers by using various extraction feature methods namely bi-orthogonal wavelet transform, gray level histogram and co-occurrence matrices. Each of these methods has used to classify the image separately at first, and they have combined together secondly. Experiments were conducted on two different databases. The first texture database is CUReT and the second database was collected from Outex database
.
The results have revealed that, RF and SVM have yielded higher classification precision.
Keywords: Supervised Random Forest, Support Vector Machine, Feature Extraction, Texture classification
1. INTRODUCTION
Texture has been defined as incorporating the recurring patterns with a typical frequency, whereas, texture analysis involves classifying or segmenting textural attributes based on the shape of a smaller aspect, solidity and course of persistence [1]. Texture analysis is important in the application of computer image analysis for classification of images based on local spatial variations of its intensity or colour. A successful classification requires an efficient description of image texture. Important applications include industrial and biomedical surface inspection, for example for defects and disease, ground classification and segmentation of satellite or aerial imagery, segmentation of textured regions in document analysis, and content-based access to image databases [2]. The main goal of texture classification is to classify images into homogeneous classes that have the same textural pixels [3]. Ashour et. al used Multidirectional Gabor filter to classify Engineering Machined dataset into six classes based on Principal Components Analysis (PCA) and Artificial Neural Network classifier [4]. Benco et. al has proposed two methods namely GLCM (greylevel
homogenous database.The first type is Outex surface texture database. The second type includes 61 images from Columbia-Utrecht Reflectance and Texture database (CUReT) to select the minimum number features in an input vector to represent an image. The second stage is to classify the input vector of each image using RF and SVM classifiers. This paper has been organized as follows: Section 2 explains our methodology; Section 3 presents the evaluation of the experimental results; and Section 4 presents the conclusions.
2. THE METHODOLOGY
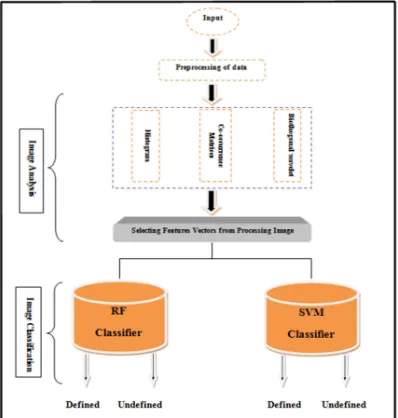
[image:2.595.90.289.441.650.2]The methodology presented in this paper is applied to the textured images to be later on classified in RF and SVM classifiers. The aim is to show the tested image in a vector of features, which is referred to as the input vector, which will then be directed to the RF or SVM classifiers for classification. To achieve this, we begin with the first stage of the algorithm, which is the feature extraction stage using histograms, co-occurrence matrices, and bi-orthogonal wavelet methods and combination method from the tested image as depicted in Figure 1. The second stage is the choice of the input vectors of the extracted features to be classified using RF and SVM classifiers.
Figure 1: Proposed model for image analysis and
classification
A. Databases
The database used consists of two parts; the first part is considered the main part in our work which is Outex database contains a large collection of surface textures and natural scenes and we used
9 classes each class include 9 images both macrotextures and microtextures [11]. The second part the Columbia-Utrecht Reflectance and Texture database (CUReT) and its include 61 class of materials at a frontal viewing angle namely, aluminum foil, artificial grass, plaster, concrete, plaster, concrete, cork, leather, Styrofoam, straw, corduroy, corn husk [12].
B. Extraction Of Feature Extraction
The approach of representing or modifying the original data is known as feature extraction. There is a profound challenge in addressing the issue of accomplishing effective and efficient feature extraction; including strategies, which depends on the visual conception of humans and psychological studies that compute the dimensions of specific perception-based features [13]. In the next subsections we have discussed the feature extraction methods and the means of choosing the input vector from every method.
C. Histogram Computation Method
The histogram in image processing indicates the histogram image density values. Calculating the histogram of an image provides a vector of length 256 that expresses the image. This image is then used as the input vector for the chosen classifier. The output gives 81 input vectors from the Outex surface textures database divided into a nine matrices based on the type of the class. Each of these nine matrices were of a uniform size (9 × 256). Along with these matrices, the output also gives us 61 vectors from the CUReT textures database, which is organized by a matrix of size (61 × 256). These matrices consist of columns that are used as the input vectors in order to train each data set individually and to test them for the classifiers.
D. Co-Occurrence Matrices Method
and gray scale level 256, the angular relationship between pairs at distance d=1 between pixels is at 0° orientations the co-occurrence matrix contains 2Ny (Nx-1) nearest horizontal neighbor pairs. In applying this method the mean and variance of neighbors relationship at 0º and 180º orientations are collected together in one vector has length (1024) for each image produce 81 columns from the Outex surface textures database divided into nine matrices based on type of the class, each of size (9*1024) and 61 vectors from the the CUReT textures database; those are organized by matrices of size (61*1024). These matrices consist of columns which are used as the input vectors in order to train each dataset individually and also to test them out for the classifiers.
E. Biorthogonal Wavelet Method
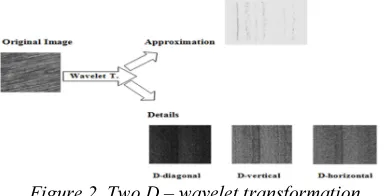
[image:3.595.92.284.482.580.2]Bi-orthogonal wavelets are the most desirable ones in image processing applications. Image contents are prevented from shifting between the sub-bands by these symmetrical wavelets, allowing the image boundaries an extension. To carry out the image application, the two-dimensional wavelets transform and lead to a deterioration of approximate coefficients at level i in four components as shown in Figure 2. The image also shows approximation at level i+1, and the details are only in the orientations that exist (horizontal, diagonal and vertical).
Figure 2 Two D – wavelet transformation
The components with an extremely higher frequency have been extracted from the images, so as to have the ideal precision in the arrangement of the two databases; which offer better performance, and consequently the two dimensional bi-orthogonal makes over the tested images; and then extract the three details (horizontal, diagonal and vertical) with 0º, 90º and 45º being their orientation respectively. Several tests were performed on the various types of selected features. The final selection was formulated with the following: 1. Sum: total number of pixel amount that exist in a detailed component [14].
2. Maximum: the leading component in a varying selection in the line of a myriad of extents.
3. Mean: the total amount of components in a diverse selection.
4. Standard deviation (std): A row vector that comprises of the standard deviations of the components of each column and can be expressed as.
1 2 2
1 1
1 1
( ) .where
n n
i i
i i
s X X x x
n n
= =
= − =
∑
∑
5. Median: this is the median value of components in a wide number of choices.
6. Range: this constitutes the least and most amounts of the components in line with the different extents of selections.
The aforementioned 6 features were cumulated from the 3 details formed by transformation of the image, and then its collection so as to get a final trajectory measuring as long as 18 elements demonstrating each image. Based on each data set, the production courses are separated into mediums. The columns of these matrices are sized at (9×18) and (61×18) for two databases which are utilized for testing and training the classifiers just as how it is usually done with the other methods.
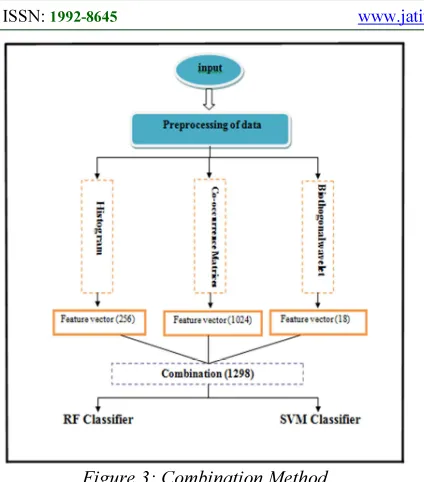
F. Combination Method
Figure 3: Combination Method
G. RF-Based Classification
The supervised classifier used primarily has been based on Random Forest. A collection of tree structured classifiers {h(x,Θk )} exist in a random forest classifier. The {Θk} are the identical distributed random vectors that are independent. Each tree casts a vote for the most popular class of input x; the trees have been built based on the following algorithm [15]:
1. The number of training cases can be N and the number of variables in the classifier can be M. 2. The number M of input variables is used to determine the assessment at a node of the tree; m should be much less than M.
3. A training set is selected or the tree by choosing n times replacing it from all N number of available training cases (i.e., by taking a bootstrap sample). The rest of the cases can be used to estimate the errors by predicting their classes.
4. A random selection of m variable is done for each node of the tree. The best split based on the m variable is calculated.
5. The trees are fully grown and not pruned.
H. SVM- Based Classification
The aim of this second case is to study the effects of applying a supervised SVM classifier on two different databases analyzed using several feature extraction techniques. Vapnik were first discussing the support vector machines in 1992 [16]. there are many applications to solve the various problems such as data mining, Bioinformatics, biomedical signal analysis, face
detection, medical diagnostics, and financial time series prediction. SVM foundations are strongly rooted in the Statistical Learning Theory (SLT): an area of study which addresses the issue of how to control the generalization ability of a classifier. Vapnik and Hervonenkis developed this theory for creating classifiers or discriminant functions that can generalize well. The support vector machine is originally designed for binary classification. So far, there are three popular approaches: one-against-one, one-against-all and directed acyclic graph SVM (DAGSVM) can extend SVM for multi-class classification. We depended the one-against-one approach to classify the test data. Suppose the k is the number of classes, the one-against-one approach will construct k (k-1) /2 classifiers from the training data. In binary classification, every classifier can distinguish from two different classes. Then, we use the voting strategy that each classifier is considered to be a voting. For each binary classification, if the test point is classified to the i’th class, the vote for the i’th class will be incremented by one. So when the test point goes through all classifiers, the test point will be designated for the class with the maximum number of votes. In case that two classes have identical votes, we simply select the one with the smallest index.
3. EXPERIMENT RESULT
In this section, we have presented the overall outcome of our work and rates of precision depending on the RF and SVM classifiers. The analysis and discussions of these results have been illustrated in detail in order to carry out a wide comparison and view about the best texture analysis methods and also the best classification techniques. The first database used in this study comprised 9 classes from Outex database of size (512 × 512). Furthermore, the second database has been prepared by collecting the images (61) of size (200 × 200) from the CUReT database.
A. results Of Rf-Based Texture Classification
composition for classification, since the RF yields a higher precision rate in classification, which means less complexity and less time in training. This is proved by using 81 multi-class Outex database images.
Figure 4: Precision using nine different class databases based on RF
The training and recalling have been performed to all images using the same supervised RF model. As mentioned above, in this work, the CUReT textures images have been used as a second database for verifying and confirming the precision of the results when using the Outex database. Table 1 reveals that the precision of the results of the classified CUReT textures ranges between 97% and 99%, respectively, and it nearly matches the results obtained by our first database.
Table 1: Precision using CUReT Textures Database
Analysis
Method Histo. Co-occu. Wavelet
Defined
Samples 59 60 59
Undefined
Samples 2 1 2
Precision 97 % 99% 98.5%
B. Results Of Svm - Based Texture
Classification
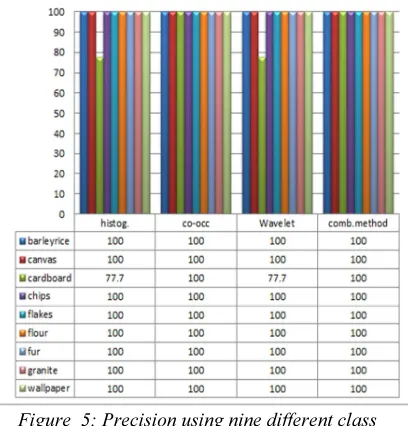
The SVM performance for the three various features extraction methods using the Outex
[image:5.595.308.512.207.420.2]database are shown in Figure 5. Based on this figure, we can note that the experimental results show that using the occurrence matrices, co-occurrence matrices, bi-orthogonal wavelet transformation and combination method for features extraction yields the highest precision rates in classification.
Figure 5: Precision using nine different class databases based on SVM
The training and recalling have been performed to all images using the same supervised SVM model. As mentioned earlier in this work, the CUReT texture images have been used as a second database for verifying and confirming the precision of the results when using the Outex database. Table 2 reveals that the precision of the results of the classified CUReT textures ranges between 98% and 99.5% respectively.
Table 2: Precision using CUReT textures database
Analysis
Method Histo. Co-occu. Wavelet
Defined
Samples 59 60 60
Undefined
Samples 2 1 1
Precision 98% 99.5% 99%
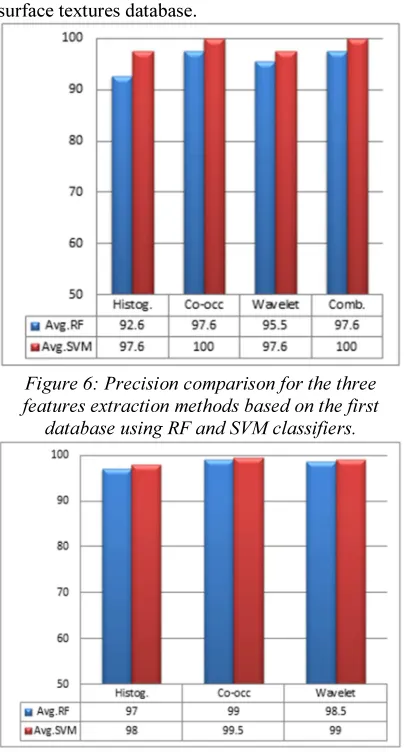
J. Compared Rf Results With Svm Results
extraction methods previously mentioned. By comparing the results in Figure 6. with the results in Figure 7. We can notice that the classification done to the second database confirms the classification results of the Outex surface textures. The comparison of the RF and SVM classifiers regarding the precision rate and complexity have facilitated us to classify and identify the type of materials for the tested image, in terms of the surface textures database.
Figure 6: Precision comparison for the three features extraction methods based on the first
database using RF and SVM classifiers.
Figure 7: Precision comparison for the three features extraction methods based on the second
database using RF and SVM classifiers
4. CONCLUSION
The overall aim of this study is to investigate the possibilities of the texture classification process, which mainly depends on efficient image analysis by features extraction. We had introduced different features extraction approaches for texture classification, based on two of the most recently implemented supervised classifiers.
The histogram, co-occurrence matrices and bi-orthogonal wavelet methods had been used in image analysis for texture features extraction. In order to classify a texture image, a vector that contains a suitable features subset representing this image should be extracted, and then is assigned to a classifier for classification. The supervised classifier had been employed in classification for training the input data. We have conducted experiments on two distinct homogenous gray scale textures databases. The first database consists of nine different classes of surface textures and natural scenes. The second database had been acquired from the CUReT textures. The RF and SVM classifiers have been illustrated from the perspective of precision rate complexity, and processing time.
The results of the analysis had revealed that the SVM classifier gives a higher precision rate in classifying the texture images and much less time in training and SVM is capable of distinguishing and classifying the Outex surface textures type of the tested image. The RF classifier achieved a precision rate between 92.6% and 97.6% in the classification of the Outex surface textures. It achieved between 97% and 99% in classification of the CUReT textures. The precision rate of SVM ranges between 97.6% and 100% in classifying the Outex surface textures database, while the precision rate ranged between 98% and 99.5% for the CUReT textures. Both, RF and SVM classifiers have been proven as successful for studying classification in image processing.
5. ACKNOWLEDGMENT
The first author acknowledgment and very thankful for all the support given by the Ministry of Electricity, Iraq and the authors would like to express their gratitude to the Universiti Kebangsaan Malaysia and Ministry of Education, Malaysia for supporting this work by research grant FRGS/1/2014/ICT07/UKM/02/2.
REFRENCES:
[1] M. Tuceryan and A. K. Jain, “Texture Analysis”, in The Handbook of Pattern Recognition and Computer Vision, World Scientific, 2nd edn., 1998.
[image:6.595.90.292.243.413.2][3] Haozheng Ren, Yihua Lan. and Yi Chen, “An Improved K-view-voting Based Texture Classification Method” Proceeding of the 4th IEEE International Conference on Computational and Information Sciences, 2012, pp 522-525.
[4] Mohammed W. Ashour, Fatimah Khalid, Lili N. Abdullah, Alfian A. Halin, Artificial Neural Network-Based Texture Classification Using Reduced Multidirectional Gabor Features. International Review on Computers and Software. Vol 9, No 6, 2014.
[5] Benco, M., Hudec, R., Kamencay, P., Zachariasoya, M., Matuskal, S., “An advanced approach to extraction ofcolour texture features based on GLCM”, International Journal of Advanced Robotic Systems. University of Zilina, Zilina, Slovakia. Volume 11,Issue 1.
[6] Mahapatra, D. “Analyzing training information from random forests for improved image segmentation”, IEEE Transaction on Image Processing. Dept. of Comput. Sci., ETH Zurich, Zurich, Switzerland. Volume 23, Issue 4, 2014, pp. 1504-1512.
[7] Shu Liao. and Albert C.S. Chung, “Anew Subspace Learning Method in Fourier Domain for Texture Classification”, Proceeding of the 17th IEEE International Conference on Image Processing, 2010, pp. 4589 – 4592.
[8] Rouzbeh Maani, Sanjay Kalra, and Yee-Hong Yang, “Rotation Invariant Local Frequency Descriptors for Texture Classification”, IEEE Transaction on Image Processing, Vol. 22, No. 6, 2013, pp.2409 – 2419.
[9] De Almeida, C.W.D., de Souza, R.M.C.R. and Candeias, A.L.B, “Texture classification based on co-occurrence matrix and self-organizing map”. IEEE International Conference on Systems Man and Cybernetics (SMC). Federal University of Pernambuco Recife, Brazil , 2010, pp. 2487 – 2491.
[10] Marc Simard, Sasan S. Saatchi, and Gianfranco De Grandi, “ The Use of Decision Tree and Multiscale Texture for Classification of JERS-1 SAR Data over Tropical Forest”. IEEE Transactions on Geoscience and Remote Sensing, Jet Propulsion Lab., California Inst. of Technol., Pasadena, CA, USA . Vol. 38, Issue. 5, 2000, pp. 2310 – 2321.
[11] Ojala, T. Mäenpää, M. Pietikäinen, J. Viertola, J. Kyllonen, and S. Huovinen, “Outex-new framework for empirical evaluation of texture analysis algorithms”, Proceding. 16th
International. Conference. Pattern Recognition, Vol. 1. 2002, pp. 701–706.
[12] Columbia-Utrecht Reflectance (CUReT) [25] K. J. Dana, B. van Ginneken, S. K. Nayar, and J. J. Koenderink, “Reflectance and texture of real-world surfaces”, ACM Trans. Graph., Vol. 18, No. 1, Jan. 1999, pp. 1–34.
[13] Yong Fan and Zhengyu Zhang “A Fast Algorithm of Dynamic Background Extraction,” Journal of Communication and Computer, ISSN1548-7709, USA, Jul. 2006.
[14] Taylor Hobson precision “A guide to surface texture parameters,” info@taylor_ hobson.de. [15] Leo Breiman,. “Random Forest”, Statistics
Department University of California Berkeley. 2001.