2017 2nd International Conference on Computer, Network Security and Communication Engineering (CNSCE 2017) ISBN: 978-1-60595-439-4
A Fingerprint Positioning Algorithm Based on Multilevel Manual Definition
Xiao-zhi DU*, Xiao-song LIand Xue WANG
School of software, Xi’an Jiaotong University, Xi’an, 710049, China
*Corresponding author
Keywords: Indoor positioning, Fingerprint database optimization, Multilevel matching.
Abstract. In recent years, more and more attention has been drawn to the indoor positioning algorithm based on fingerprint model. Although, such algorithm is irrelevant to the location of the signal source, it has the drawbacks of low accuracy and poor real-time capability. This paper proposes a fingerprint positioning algorithm based on multilevel manual definition. In the offline phase of the fingerprint positioning algorithm, source data in the fingerprint database is processed by average weighting method, and a high precision fingerprint database is established to improve matching accuracy. In the online phase, multilevel matching algorithm is employed to shorten matching time. Experiments based on ZigBee technology were conducted, and the results showed that the algorithm for establishing a fingerprint database can improve matching precision by 50% and shorten matching time by 50% compared to the mode of RSSI.
Introduction
Recently, wireless sensor network technology and intelligent home are increasingly widespread, resulting in a significance of indoor position. The indoor positioning system mainly includes ultrasonic positioning technology, infrared positioning technology, and the received signal strength indication (RSSI) positioning technology. Wireless signal positioning technology can be classified into two types, namely range-based and range-free. The range-based positioning makes use of the propagation characteristics of signals. According to the nonlinear attenuation properties of the wireless signal, signal strength can be converted to distance by channel model, and then the position of the user is inferred by trilateration. Fingerprint model positioning is based on a large number of actual observed data. After trained by machine learning, the positioning model can be used to estimate the position of the target point.
In the implementation, location fingerprint can be divided into two stages. The first stage is data acquisition, or offline phase; the second stage is matching positioning, or online phase. In the offline phase, the location fingerprints of each reference node in the target area are recorded, such as the position coordinates of the reference node and the received signal strength. Every reference node corresponds to a specific set of location fingerprints, thereby forming a location fingerprint database. In the online phase, the observer uses the characteristics of current position of the target object to match the location fingerprint in the database by matching algorithm in order to determine the location of the target object. This paper mainly discusses how to establish high precision offline fingerprint database and how to improve fingerprint database matching speed.
Fingerprint Positioning Algorithm Based on Multilevel Manual Definition Offline Fingerprint Database Optimization
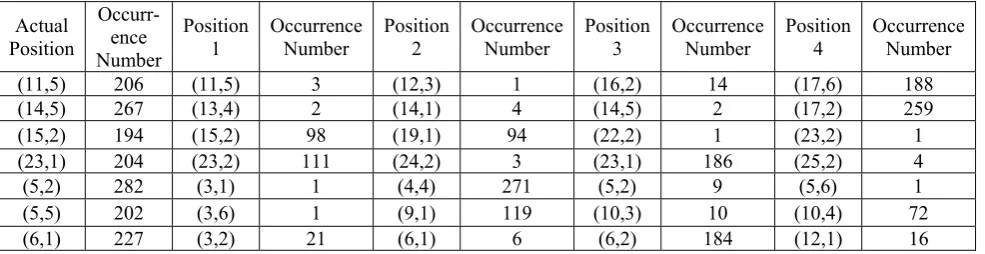
studies often simply used the mean or the mode of RSSI, or even assumed that the RSSI accorded with probability distribution. However, multiple RSSIs instead of one in one location, are needed to synthesize into one fingerprint. This paper takes the following data processing method to improve the accuracy of fingerprint database.
Table 1. Use the Mode of Location Fingerprint to Establish a Fingerprint Database by Nearest Neighbor Algorithm
Actual Position Occurr- ence Number Position
1 Occurrence Number Position 2 Occurrence Number Position 3 Occurrence Number Position 4 Occurrence Number (11,5) 206 (11,5) 3 (12,3) 1 (16,2) 14 (17,6) 188
(14,5) 267 (13,4) 2 (14,1) 4 (14,5) 2 (17,2) 259
(15,2) 194 (15,2) 98 (19,1) 94 (22,2) 1 (23,2) 1 (23,1) 204 (23,2) 111 (24,2) 3 (23,1) 186 (25,2) 4
(5,2) 282 (3,1) 1 (4,4) 271 (5,2) 9 (5,6) 1
(5,5) 202 (3,6) 1 (9,1) 119 (10,3) 10 (10,4) 72
(6,1) 227 (3,2) 21 (6,1) 6 (6,2) 184 (12,1) 16
Using the mode of RSSI to establish a fingerprint database, select the data which is collected from a data collection point for N times (assume this point as A, and the coordinates of this point is
( ,x yA A) to analyze, and then match each collected point by nearest neighbor algorithm to get a matching positionBi, with the coordinates( , )
i i B B
x y , then using the Eq. 1 to compute the distance
between Biand A.
2 2
( ) ( )
i i
i A B A B
d x x y y (1)
Where direpresents the distance between Bi and A. Then weighted by distance, whendi 0, set its weight 1 k, where k denotes the frequency of di 0
1 0
k
j i
RSSI
RSSI k(2) When di 0, RSSIj is the location fingerprint of the sample. When di 0, set its weight value
1di
, and assume
2 ( 0 / ) / ( 01 / )
n k n k
j j j
j j
RSSI RSSI d d
(3) Where RSSIj is the location fingerprint of the sample when di 0.
Finally, the location fingerprint vector used to establish fingerprint database is
1
2
1 (1 ) 2,(0 , (0.5,1))
RSSI
RSSI RSSI
RSSI RSSI k n
(4)
After computing every sample point, the location fingerprint database can be established.
Multilevel Matching
fingerprints contain the mode features of the neighboring classes at the same time. As a result, it is improper to sort them into one class. The location fingerprint generated in the real-time positioning phase may not be matched to its most similar location fingerprint which may influence the final location estimation results. Thus, this algorithm refers to soft division method to eliminate fuzzy boundary. In the real-time matching phase, classes with the first and the second smallest distance are taken as matching class.
Because two classes are taken as matching class, the number of match is still large. As a result, multilevel classification algorithm is adopted to reduce the number of matching. Taking multilevel classification in the offline phase, the fingerprint characteristic value representing each class is stored in the database (e.g. the mean of each class). In the real-time phase, compute the distance between the location fingerprint of the unknown point and the fingerprint characteristic value of each classification, find the minimum as well as the second minimum value and compute next stage classification, and then repeat the above procedures until a satisfactory result is achieved.
[image:3.595.110.495.245.545.2]
Figure 1. Store classified information by stage in offline phase Figure 2. Matching by stage in online phase In the offline phase, the storing information includes the mean of the classification of each level and the points in the last level. In the real-time phase, considering the complicated indoor environment, measurement error still exists. Weighted nearest neighbor method is employed to solve this problem. The weighted factor 1 /dj is used to compute the coordinates of the Euclidean distance of the location fingerprint, then weights and averages. The closer the fingerprint information point is, the higher the weight value will be obtained. Its weight value is:
1 (1 i) / k 1 /
j d j dj
(5) thus, the position coordinate of the unknown point is1 k
a j j aj
P
P (6)a
Experimental Results and Evaluation
Experimental Environment
The experimental room was a 2555cm × 685.5cm hall with a 498.5cm × 347cm small room in it, and the indoor facilities were shown in Figure 4 (a). There were four sofas in the hall (the back of sofas were about 0.8m high), two coffee tables (about 0.4m).
[image:4.595.91.527.110.310.2]
(a) Laboratory layout (b) Nodes layout (c) Sampling distribution diagram Figure 3. Experimental ichnography
Figure 3. (b) was the simplified graph of this room. The points in the figure were the location nodes. The height of the nodes on the wall was 1.8m and the distance of the both sides of the “1” node was 342.75cm (equally divided) whereas the distance among the nodes “2”, “3”, “4” on the right side of the wall was 638.75cm (equally divided). Similarly, the distance of the both sides of the “5” node was 349.25cm and the “6” node was 173.5cm. The distance between the “7” and “8” node was 685.5cm. The “9” node was placed on the desktop in the middle of the room (about 1m high). On the basis of Figure 3. (a), the facilities were removed which impose no influence on the location and then the user-unreachable zones were determined. Therefore the distribution of sampling points in the room was as Figure 3 (c). In the area that user could reach, the spacing of 0.8m×0.8m uniform distribution of sampling points were selected which located at the intersection of lines. Their labels are the combination of their position coordinates (lower right corner is 11, top left corner is 303; single-digit is the abscissa).
Nine positioning nodes and a target node were arranged at suitable location shown as Figure 3 (b). The target node was set to broadcast a positioning signal every 2.5s. The routing node hanging on the wall received the signals sent by the target node to obtain corresponding signal strength, then the signals were forwarded to the coordinator node in the middle. The coordinator node was used for networking and collecting messages forwarded by the destination node and the routing nodes.
Experimental results
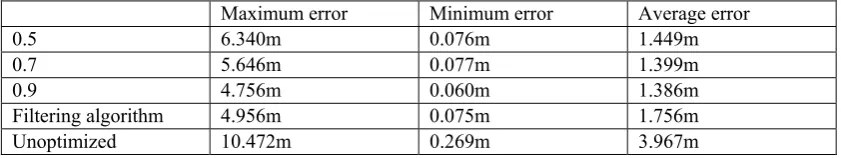
In this experiment, 70 points were selected in the lab. According to the Eq. 4, different values of α
[image:4.595.88.509.650.729.2]were adopted, and different levels as well as k were set for the KNN algorithm to classify value. And the comparative results are as follows:
Table 2. Comparison of the matching precision with and without the optimization algorithm Maximum error Minimum error Average error
0.5 6.340m 0.076m 1.449m
0.7 5.646m 0.077m 1.399m
0.9 4.756m 0.060m 1.386m
Filtering algorithm 4.956m 0.075m 1.756m
Table 3. Comparison of time consuming and accuracy when using different levels Level Average consumed time Average error
3 0.035s 1.480m
4 0.027s 1.503m
5 0.024s 1.503m
c=3 Clustering method 0.031s 1.490m
Using direct matching 0.054s 3.562m
Table 4. Comparison of matching accuracy when using different K parameters K Average error Maximum error Minimum error
2 1.546m 6.980m 0.033m
3 1.499m 6.340m 0.003m
4 1.391m 5.068m 0.077m
Analysis of Experimental Results
Table 2 shows that the fingerprint database optimization algorithm which reduces the average positioning error to more than 50%, and enables a higher positional accuracy within 1.5 meters. The average error tends to decrease with the increase of α, although the effect of the variation of α on the results is not obvious. Therefore, the value of α should be as close to 1 as possible in practice. It is also found in the experiment that after optimizing the fingerprint database, if the optimized 0 matched rate is still very low, the algorithm can be reused.
Table 3 shows that the average matching time is obviously shortened. At the same time, it can be found that the more level is classified, the less time is consumed, though without a linear relation. The main reason is that more levels induced the increase of the number of query database and the ranking times, thus the decreasing speed of time consumption slows down.
Table 4 shows that the average error tends to decrease with the increase of K when the K-Nearest Neighbor matching algorithm is used.
Summary
This paper presents a fingerprint positioning algorithm based on multilevel manual definition. The experimental results show that using this algorithm can effectively reduce the matching time in the real-time phase and thus save the energy of mobile terminal. This algorithm improves the accuracy of positioning, but it increases the times of matching. In future, we will optimize the process of matching.
Acknowledgement
This research was financially supported by the Chinese National Natural Science Foundation (11575138), the Industrial PR project of Shaanxi Province (2013K06-20) and the Fundamental Research Funds for the Central Universities in China.
References
[1] Xiang L, Wang D, Wei Y, et al. Location-fingerprint based indoor localization via scalable semi-supervised learning[J]. Information Japan, 2015, 18(2):641-652. [2] Xu Y, Shi Y, Zheng X, et al. An Indoor Space Partition Method and its Fingerprint Positioning Optimization Considering Pedestrian Accessibility[J]. ISPRS-International Archives of the Photogrammetry, Remote Sensing and Spatial Information Sciences, 2016, XLI-B4:347-350.
[4] Zhang L, Liu K, Jiang Y, Li X, Liu Y, Yang P. Montage: Combine frames with movement continuity for realtime multi-user tracking. In Proc. the 33rd Annual IEEE International Conference On Computer Communications, Apr. 27-May 2, 2014.
[5] A. K. M. Mahtab Hossain, Y. Jin, W. -S. Soh, H. N. Van, SSD : a robust rf location fingerprint addressing mobile devices’ heterogeneity, IEEE TMC 12 (1) (2013) 65– 77.
[6] Gupta P, Gupta P. An accurate fingerprint orientation modeling algorithm[J]. Applied Mathematical Modelling, 2016, 40(15-16):7182-7194