Remote Sensing Image Compression using 3D-Oriented
Wavelet Transform
D. Napoleon
Assistant Professor, Department of Computer Science, School of Computer Science and
Engineering, Bharathiar University, India, Coimbatore-641046
S.Sathya
Research Scholar, Department ofComputerScience
School of Computer Science and Engineering BharathiarUniversity,
India,Coimbatore-641046
M.Praneesh
Research Scholar, Department ofComputerScience
School of Computer Science and Engineering Bharathiar University,
India,Coimbatore-641046
M.Siva Subramanian
Research Scholar, Department ofComputerScience
School of Computer Science and Engineering Bharathiar University,
India,Coimbatore-641046
ABSTRACT
Remote Sensing is simply defined as the observation of an object from some distance. By using the observation of object we can collect the information of an object without any physical contact with that object. We present a new technique for the compression of remote sensing images based on oriented wavelet transform. A 3D-Oriented Wavelet Transform (OWT) is introduced for efficient remote sensing image compression. To maximize the transform coding gain three separable 1D transforms are implemented in the same direction. This paper focus on compressing the remote sensing images based on 3D-OWT scheme and JPEG2000. Result show that our scheme with filters performs as well and better in lossless coding systems using 3D Oriented Wavelet Transform on remote sensing images.
Keywords
Remote Sensing Image, Image Compression, 3D-OWT, JPEG2000.
1.
INTRODUCTION
Remote sensing is a valuable tool for identifying objects [1,2] at the earth’s surface and for measuring and monitoring important biophysical characteristics and human terrain. Earth observation and weather satellites, medical x-rays for bone fractures are all examples of remote sensing. Remote sensing devices make use of emitted or reflected electromagnetic radiation from the object of interest in a certain frequency domain (infrared, visible light, microwave). Remote sensors are classify as active sensors or passive sensors. Active sensors provide their own source of radiation to send out to an object and record the magnitude of radiation returns. Passive sensors record incoming radiation that has been scattered, observed and transmitted from the earth in transmit from its original source, the sun.
Uncompressed remote sensing image can be very large. Sensor is capable of collecting several gigabytes of data per day. Compression is thus necessary to facilitate both storage
and the transmission of remote sensing images. Remote sensing images are typically collected on remote acquisition platforms, such as earth observation and satellites. Thus compression schemes is becoming increasingly of interest in remote sensing applications. Image compression is to provide compact representation of signals that could make full use of statistical correlations and image characters. During the past few decades, several kind of transforms, have successively been developed for image compression [3], such as the Karhunen-Loeve transform (KLT), Discrete Cosine Transform (DCT) and Discrete Wavelet Transform (DWT).
JPEG200 [4] is suggested, which offers elements with good frequency resolution at lower frequency while simultaneously offering elements with good time resolution in higher frequencies. Furthermore, the Embedded Block Coding with Optimal Truncation (EBCOT) algorithm is suggested to perform high performance scalable image compression [5]. Both JPEG2000 and 3D-Oriented Wavelet Transform (OWT) are DWT based compression techniques. In recent years, usage of DWT based and embedded bit-plane coding techniques are very popular.
Compression is a commonly used process to reduce the amount of initial data to be stored or transmitted by a channel to a receiver. In this paper, a 3D-Oriented Wavelet Transform (OWT) is introduced for efficient remote sensing image compression. Experimental results demonstrate that 3D-OWT can significantly improve the transform coding gain, particularly for remote sensing images with high resolution. In this paper we compare the proposed work using JPEG2000 and 3D-OWT.
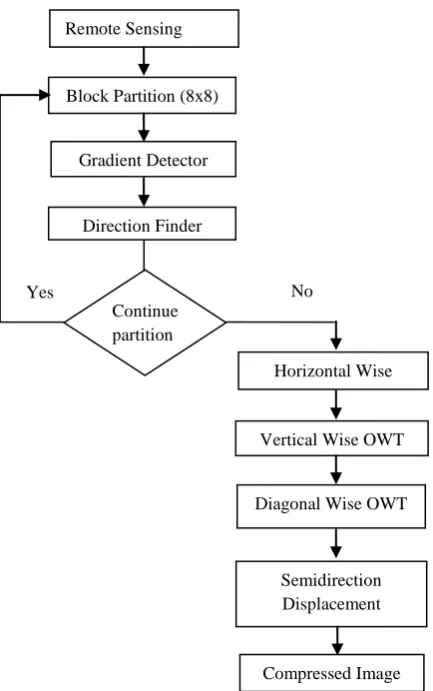
2. METHODOLOGY
Fig 1: System Architecture
3.
JPEG2000 STANDARDS
The JPEG2000 was motivated by Ricoh’s submission of the CREN algorithm [6,7] to an earlier standardization effort for lossless and inner-lossless compression known as JPEG-LS. JPEG2000 is based on transform coding. A biorthogonal discrete wavelet transform is first applied to each image file, whose output is a set of subbands at different resolution levels. Each quantized subband of the wavelet decomposition is divided into rectangular blocks, which are independently encoded with the EBCOT (Embedded Block Coding with Optimized Truncation). EBCOT is based on a bit-plane approach, context modelling and arithmetic coding. The output bit stream by EBCOT is organized by the rate allocator into a sequence of layers, each layer containing contributions from each code block [8].
JPEG2000 employs discrete wavelet transform (DWT), whereas arithmetic coding and successive approximation are options in JPEG, they are central concepts in JPEG2000. The coding mechanisms themselves are more efficient and more flexible. The JPEG2000 standard supports good lossless compression competitive compression of bi-level and low bit-depth imagery, and bit streams which embed good lossy representation. Before applying the DWT, the source image is divided into components (colors) and each component is divided into tiles, which are compressed independently, as though they are independent images and all the samples in the tile are shifted to DC level. The DWT coefficients in different subbands are quantized and then composed into an embedded stream following the EBCOT algorithm. The embedded
bit-stream is composed of quality layers so as to offer both resolutions and SNR scalability. The entropy coding is based on a context adaptive arithmetic coder, known as MQ coder, which has error correction capability.
4.
3D-ORIENTED
WAVELET
TRANSFORM
OWT is used for sake of simplicity and efficiency, oriented wavelet are after applied separably on the horizontal and vertical, diagonal and antidiagonal. And it simply consists of applying the lifting steps of a 1D wavelet transform in the direction of the image contours. So image is filtered along horizontal and vertical or diagonal and antidiagonal. This result is better energy compaction in the lowest subband, compared to the separable wavelet. Transform has similar complexity as the separable wavelet transform while providing better energy compaction and staying critically sampled, which makes it a good candidate for compression applications. The increased decorrelation offers relatively good performance compare to state-of-the-art coder.
This transform can also be combined with more advanced subband coders such as EBCOT, which is used in the JPEG2000 standard. The orientation map is denoted by and the wavelet coefficient of the image for a given orientation map is denoted by [9]. The restriction of
the map or wavelet coefficient to a set of points is written as , respectively. In particular, we denote by the orientation at location . Depending on whether the scale to which the point belongs is even or odd, representing either horizontal
and vertical orientations or diagonal and antidiagonal orientations respectively.
A three dimensional wavelet transform can be accomplished by performing three separate one dimensional transforms. First the image is filtered along the x-dimensional and decimated by two. And it is followed by filtering the sub image along the y-dimension and decimated by two. Finally, we have split the image into four bands denoted by LL, HL, LH and HH after one-level decomposition.
a. Level One, Two and Three Decomposition
[image:2.595.53.270.72.418.2]b. Level Four Decomposition
Fig 2: Level 4 DWT Scheme used for image compression In mathematical terms, the operation or low pass filtering in the inner product between the signal and the scaling function Remote Sensing
Image
Block Partition (8x8)
Gradient Detector
Direction Finder
Continue partition
p Horizontal Wise
OWT
Vertical Wise OWT
Diagonal Wise OWT
Semidirection Displacement
Compressed Image
No Yes
Image
LL
LH HL
as shown in the equation 1 whereas the differencing operation or high pass filtering in the inner product between the signal and the wavelet function as show in the equation 2
The scaling function or the low pass filter is defined as
The wavelet function or the high pass filter is defined as
where j denotes the discrete scaling index, k denotes the discrete translation index.
The reconstruction of the image is carried by the following method. First, we will up sample by a factor of two on all the four sub bands in each dimension. The sum of four filtered sub bands to reach the low-low sub band at the next finer scale. We repeat this process until the image is fully reconstructed. Application of DWT divides an image into four subbands, which arise from separable applications of vertical and horizontal coefficients. The LH, HL and HH subbands represents detailed features of the images, while LL subband represents the approximation of the image. To obtain the next coarse level the LL subband can further be decomposed, thus resulting in the 2-level wavelet decomposition. The level of decomposition performed is application reliant. The present work considers upto four level of decomposition as shown in the “Figure 2”.
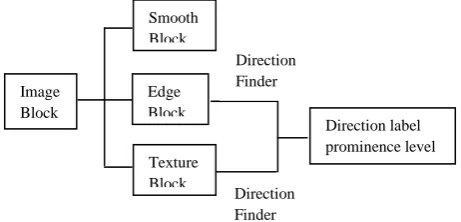
4.1 Directional Detection
Generally speaking an image block can be placed in one of three categories: 1) a smooth block whose intensities are relatively uniform, 2) an edge block where the block contains an edge, and 3) a texture block where the block contains a
random or pseudorandom pattern or texture [10]. In the first case, there appears to be a smooth area in the image without any prominent direction.
Fig 3: Direction Detection
In the other two cases, there may exist some dominant directions that can be utilized in image compression. Therefore, the edge and texture pixels should be detected to determine its direction. The diagram of direction detection is shown is “Figure 3”.
4.2
One Dimensilonal Wavelet Transform
Based On Oriented Resampling
For traditional DWT, it contains a pair of low pass and high pass filters, followed by downsampling by a factor of two after each filtering operation [11]. The filtering operation appears to be convolution between filter taps and image data. A two channel multirate filter bank convolves a signal
with a low pass filter and a high pass
filter and downsamples the output by 2 as
The low pass convolution object of analysis filter is shown in the below figures. The fork and circle in this figures stands for the odd and even columns of data, and the bold box is a window for data to participate in the convolution.
x o x o x o x o x o x o x o x o x o x o x o x o x o x o x o x o x o x o
x o x o x o x o x o x o x o x o x o x o x o x o x o x o x o x o x o x o
x o x o x o x o x o x o x o x o x o x o x o x o x o x o x o x o x o x o
x o x o x o x o x o x o x o x o x o x o x o x o x o x o x o x o x o x o
x o x o x o x o x o x o x o x o x o x o x o x o x o x o x o x o x o x o
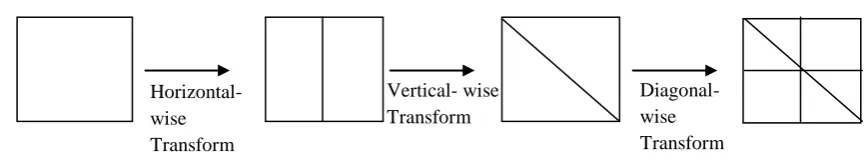
Fig 4:Horizontal, Vertical and Diagonal Wise transform Although 3D OWT can also be separated into three 1D
trandforms based on oriented resampling, these three transforms are not essentially perpendicular. Once the first transform direction can be decided, the should perform the oriented resampling in this direction. For
instance, supposing that the first transform direction number is 4. The oriented resampling process for horizontal, vertical and diagonal wise transform is shown in “Figure 4”. Nine resampled data along the diagonal direction become a substitution of , which perform convolution operation
(1)
(2)
(3)
(4)
Image Block
Edge Block Smooth Block
Texture Block
Direction label prominence level Direction
Finder
[image:3.595.314.545.115.226.2]with the low frequency filter taps. Because the direction number is 4, there is no need for a subpixel. In some other directions, subpixels should be interpolated.
4.3 Integrative Transform And Boundary
Handling
Theoretically, 3D OWT is an integrative transform. Al-though the image is partitioned into blocks, it is only prepared for direction detection. Therefore the direction of each blocks are orderly detected before the 3D transform. The object of the transform is the whole image, instead of the image blocks. As a result, there are two categories of boundaries: 1) the boundaries of original image and 2) the boundaries for different blocks.
Signal extensions are performed for the first category. Typically, symmetric extension is put into practice in 3D DWT. In the proposed 3D OWT, it is also used as usual, without the consideration of blocks. Simultaneously this symmetric extension is not concerned with the direction of each block. In conclusion, the image still performs symmetric extension, excluding the influence of block partition and direction detection.
4.4 Subpixels
According to directions that are labelled from 0 to 15 in the direction library, 16 kinds of directions are defined in the 3D OWT. Then there arises the problem that some directions cannot be considered. In practice, their intensities are defined by interpolation. For perfect reconstruction, sinc interpolation is utilized [12,13]. Theoretically, discrete sinc interpolation is the only convolution based discrete interpolation method that is completely reversible [14]. In digital signal processing, sinc interpolation is interpolated from a finite number of N samples { . We have
where is a parameter equal to
depending on the algorithmic implementation of the interpolation formula.
Concretely, the interpolation, based on cyclic convolution, does not distort initial signal samples if and only if the number of initial signal samples is an odd number and the interpolation kernel is a discrete sinc function [15].As a result the number of original samples should be odd. Then there arises another problem,i.e., deciding on the samples that will take part in subpixel interpolation. Because the interpolation process is based on spatial correlations among neighbourhood pixels in the image, adjacent pixels contribute a little more than pixels that are far away. Meanwhile, the number of original samples in interpolation would affect its computational complexity and performance. As a result, three neighbourhood pixels are chosen to perform the subpixel interpolation.
4.5 Oriented Resampling
[image:4.595.63.496.523.605.2]In the traditional 3D OWT, three 1D wavelet transform are implemented in the vertical, horizontal and diagonal directions. Therefore, wavelet subbands are generated. In the proposed 3D transform, the structure of the subbands is totally the same. If the direction label of certain block is 0 or 8, it actually performs the traditional wavelet transform. Otherwise, three kinds of transforms are defined which are vertical-wise transform, horizontal wise transform and diagonal wise transform. These three transforms, which can be regarded as the generalized body of traditional DWT, have some resemblance with the traditional DWT. Concretely, the horizontal subband is produced by the horizontal-wise transform. In addition, the vertical subband would be generated by the vertical-wise transform and diagonal subband would be generated by diagonal wise transform which is illustrated in “Figure 5”.
Fig 5: Subband Generation of the horizontal-wise and Vertical-wise Transforms
Meanwhile there exist some differences. Because the wavelet transform appears to be the convolution between filter taps and initial data, the low pass filtering operation in the horizontal direction can be expressed in 3D as follows:
Then, our horizontal-wise transform of low-pass filtering is defined as follows:
)
Horizontal- wise Transform
Vertical- wise Transform
where is the directional offset according to the direction
label . Furthermore, the can be an integer or a fraction.
Compared with the horizontal wise transform, the vertical wise transform is defined. For low-pass filtering, we have
where is the directional offset. According to the aforementioned definition of horizontal wise and vertical wise transforms, the oriented resampling can be implemented. Except for directions 0 and 8, both horizontal wise and vertical wise transforms can be performed for each direction.
4.6 Semidirectional Displacement And
Lifting
In traditional DWT, the 3D- OWT includes a pair of low pass and high pass filters, Because of the downsampling process, the total number of wavelet coefficients is the same as the number of original data samples. Downsampling remains in the horizontal or vertical direction. If it is the horizontal wise transform, downsampling is in the horizontal direction. Otherwise downsampling is performed is in the vertical direction. Then, there comes some directional displacement.
Given a signal , the dyadic wavelet transform consists in representing by its decomposition on a wavelet
basis
,
where is the mother wavelet and are scaled and shifted versions of this wavelet. We consider only biorthogonal and compactly supported wavelets. This ensures both the linear phase and perfect reconstruction property. Additionally, the transform can be implemented efficiently using a two-channel FIR filterbank, iterated on the low-frequency band. In [16], et al prove that the polyphase matrix of such a filterbank can be factorized in a finite number of predict and update steps, followed by a final scaling step . This lifting decomposition generalizes the notion of wavelets and allows the construction of second generation wavelets on sets where the notion of frequency is not defined [17]. Furthermore, the lifting scheme provides an efficient way of implementing the filterbank and guarantees perfect reconstruction by simple inversion of the different lifting steps. The number of predict and update steps depends on the regularity of the wavelet.
The analysis stage is performed by first splitting the sampling grid in two cosets.
A predict step consists in predicting each sample of from its neighbours in
where represents the lifting factor of the predict step . Similarly, an update step consists in adjusting the value of each sample in from its neighbours in
where represents the lifting factor of the update step . The predict and update steps are applied successively in alternance. To obtain properly normalized filters, a final scaling step is applied on each coset as
is an approximation of and corresponds to a lowpass filtering followed by downsampling, while represents the prediction error and corresponds to a high-pass filtering followed by downsampling. The original signal is recovered by inverting the lifting steps, that is, by applying successively
,....,U and merging and as
OWT performs a compression process of a signal or an image, using a wavelet packet. The procedures for compression using the wavelet packet decomposition are the same as those used in the wavelet framework. The DWT is an important tool in the construction of resolution scalable bit streams. First DWT stage decomposes the image into four sub bands, denoted LL1,
HL1 [Horizontally High-pass], LH1 [Vertically High-pass] and
HH1. The next DWT stage decomposes this LL1 sub band into
four more sun bands denoted LL2, LH2, HL2 and HH2. The
process continues for some number of strategies. The total number of sample in all sub bands is identical to the original image. On comparing between JPEG2000 and 3D-OWT better compression ratio for Remote Sensing Images is obtained for 3D-OWT.
5.
IMAGE QUALITY
MEASUREMENTS
5.1 Mean Square Error (MSE)
MSE =
5.2
Peak Signal to Noise Ratio (PSNR)
The small value of Peak Signal to Noise Ratio (PSNR) means that image is poor quality. In general, a good reconstructed image is one with low MSE and high PSNR [18].PSNR is defined as follow:
PSNR =
5.3 Correlation
Correlation coefficient calculates the proximity between the two images. The correlation coefficient is computed by using the following equation [19].
A correlation is a number between -1 and +1 that measures the degree of association between two variables (call them X and Y). A positive value for the correlation indicate a positive association where the large values of X tend to be associated with large values of Y and small values of X tend to be associated with small values of Y. A negative value for the correlation indicates a negative or inverse association where the large values of X tend to be related with small values of Y and vice versa.
5.4
Structural Similarity Measures
The structural similarity (SSIM) index is a method for measuring the similarity between two images [20]. The measure between two windows x and y of common size N×N is:
where µx is the average of x, µy is the average of y, σ 2
x is variance of x, σ2y is variance of y, σ
xy represents the
covariance of x and y, , two
variables to stabilize the division with weak denominator.
5.5
Execution Time
The execution time for all the images are tested and compared with JPEG2000 and 3D-OWT which are used. The 3D-OWT gives the higher results for all the Remote Sensing Images. Execution time is calculated using tic toc method.
6.
DATASET DESCRIPTION
Remote sensing image is defined as an image produced by a recording device that is not in physical or intimate contact with the object under study. Remote sensing image is used to obtained information about a target or an area or phenomenon through the analysis of certain information which is obtain by the remote sensing imagery generally require correction of undesirable sensor characteristics and other disturbing effects before performing data analysis. Images obtained by satellite are useful in many environmental applications such as tracking of earth resources, geographical mapping, prediction of agriculture crops, urban growth, weather, flood and fire control etc. So in this paper, we have analysed a remote sensing image. It is downloaded from Google sites.
7.
RESULTS
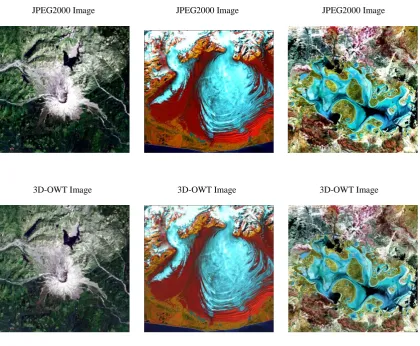
The proposed work is shown in the “Figure 6”. The test image is taken as Input image. It has very high frequency components, so the JPEG2000 and 3D-OWT is used to compress the Image. When compared to the JPEG2000, 3D-OWT produces better compression which is shown in fig-6. This shows that the 3D-OWT has shown good efficiency for image compression. The proposed work is done using MATLAB, 2010 version.
Remote Sensing Image Remote Sensing Image Remote Sensing Image
JPEG2000 Image JPEG2000 Image JPEG2000 Image
3D-OWT Image 3D-OWT Image 3D-OWT Image
[image:7.595.76.497.67.413.2]
Fig 6: Compression of JPEG2000 and 3D-0WT
[image:7.595.64.533.638.761.2]Table 1. Results of CR, PSNR, MSE, Correlation, SSIM, Execution Ti me Value for JPEG2000
Table 2: Results of CR, PSNR, MSE, Correlation, SSIM, Execution Ti me Value for 3D-OWT JPEG2000
IMAGES CR PSNR MSE CORRELATION SSIM EXECUTION
TIME
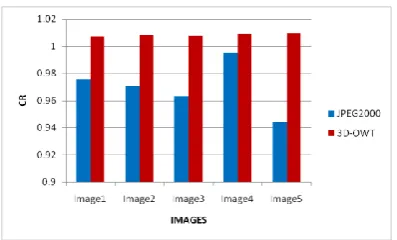
Image1 0.9754 32.0620 40.4464 0.9963 0.7150 34.8945
Image2 0.9704 30.5327 57.5189 0.9949 0.8302 25.4131
Image3 0.9633 30.0303 64.5727 0.9947 0.8757 25.3004
Image4 0.9954 31.3066 48.1310 0.9890 0.8502 40.6478
Image5 0.9441 34.8830 21.1242 0.9909 0.8947 17.5411
3D-OWT
IMAGES CR PSNR MSE CORRELATION SSIM EXECUTION
TIME
Image1 1.0071 34.5064 23.0380 0.9964 0.9194 0.1884
Image2 1.0082 37.4879 11.5955 0.9963 0.9683 0.1919
Image3 1.0076 33.3991 29.7281 0.9951 0.9413 0.2945
Image4 1.0090 35.4889 18.3735 0.9937 0.9431 0.1834
Fig 7: Comparison of CR in JPEG2000 and 3D-OWT
Fig 8: Comparison of PSNR in JPEG2000 and 3D-OWT
[image:8.595.316.517.99.263.2]Fig 9: Comparison of MSE in JPEG2000 and 3D-OWT
[image:8.595.54.251.243.360.2]Fig 10: Comparison of Correlation in JPEG2000 and 3D-OWT
Fig 11: Comparison of SSIM in JPEG2000 and 3D-OWT
Fig 12: Comparison of Execution Time in JPEG2000 and 3D-OWT
8.
CONCLUSION
In this paper, we compared JPEG2000 and 3D-OWT compression scheme for the compression of remote sensing images. The compression algorithm based on the proposed transform can achieve superior quality of decoded images. The proposed transform provides a combination of oriented information and wavelet transform. 3D-OWT has similar difficulty as like the separable wavelet transform while providing better energy compaction and staying critically sampled, which makes it a good candidate for compression applications. Our experiment shows as 3D-OWT compression scheme is suitable for remote sensing image compression compared with the JPEG2000.
9.
REFERENCES
[1] Chaudhuri and A. Samal, “An automatic bridge detection technique for multispectral images,” IEEE Trans. Geosci. Remote Sens., vol. 46, no. 9, pp. 2720–2727, Sep. 2008.
[2] Sirmacek and C. Unsalan, “Urban-area and building detection using SIFT keypoints and graph theory,” IEEE Trans. Geosci. Remote Sens., Vol. 47, no. 4, pp. 1156– 1167, Apr. 2009.
[image:8.595.54.266.387.513.2] [image:8.595.55.266.542.670.2][4] D. Taubman and M. Marcellin, JPEG2000: Image Compression Fundamentals, Standards and Practice. Norwell, MA: Kluwer, 2001.
[5] D. Taubman, “High-performance scalable image compression with EBCOT,” IEEE Trans. Image Process., vol. 9, no. 7, pp. 1158–1170, Jul. 2000. [6] A.Zandi, J.D.Aallen, E.L.Schwartz and M. Boliek,
“CREW: Compression with reversible embedded wavelets”, Proc. of IEEE Data Compression Conference, Snowbird, Vtah, pp. 212-221, March 1995.
[7] M.Boliek, M.Gormish, E.L.Schwartz and A.F. Keith, “Decoding Compression with Reversible Embedded Wavelets (CREW) Codestreams”, Journal of Electronic Imaging, Vol.7, no.3, pp.402-409, July 1998.
[8] Barbara Penna, Tammam Tillo, IEEE,Enrico Magli, Gabriella Olmo, ―Transform coding techniques for lossy hyperspectral data compression”, IEEE Transactions On Geoscience And Remote Sensing, Vol. 45, No. 5, May 2007.
[9] Vivien Chappelier, Christine Guillemot, “Oriented Wavelet Transform for Image Compression and Denoising”, IEEE Transactions On Image Processing,
[10] A. Bovik, Handbook of Image and Video Processing, 2nd ed. Singapore: Elsevier, 2006.
[11] S. Mallat, “Multifrequency channel decompositions of images and wavelet models,” IEEE Trans. Acoust., Speech, Signal Processing, vol. 37, pp. 2091–2110, Dec. 1989.
[12] L. Yaroslavsky, “Signal sin-interpolation: A fast computer algorithm,” Bioimaging, vol. 4, no. 4, pp. 225–231, Dec. 1996.
[13] L. Yaroslavsky and Y. Chernobrodov, “DFT and DCT based discrete sincinterpolation methods for direct Fourier tomographic reconstruction,” in Proc. 3rd Int. Symp. Image Signal Process. Anal., 2003, pp. 405–410. [14] L. Yaroslavsky and M. Eden, Fundamentals of Digital
Optics. Boston, MA: Birkhauser, 1996.
[15] L. Yaroslavsky, “Fast signal sinc-interpolation methods for signal and image resampling,” in Proc. SPIE— Image Processing: Algorithms and Systems, 2002, vol. 4667, pp. 120–129.
[16] Daubechies and W. Sweldens, “Factoring wavelet transforms into lifting steps,” in J. Fourier Anal. Appl., vol. 4(3), 1998, pp. 247–269.
[17] W. Sweldens, “The lifting scheme: A construction of second generation wavelets,” SIAM J. Math. Anal., vol. 29, no. 2, pp. 511–546, 1997.
[18] James S. Walker, “Wavelet-based Image Compression”, Transforms and Data Compression.
[19] Wang, Z.; Bovik, A.C.; Lu, L., (2002). Why is Image Quality Assessment So Difficult? IEEE International Conference on Acoustics, Speech, & Signal Processing, 4, pp. IV-3313 - IV-3316.
[20] Zhou Wang, Alan C. Bovik, Hamid R. Sheikh, And Eero P. Simoncelli, “Image Quality Assessment: From Error Measurement To Structural Similarity”, IEEE Transactions On Image Processing, Vol. 13, No. 1, January 2004.
10.
AUTHORS PROFILE
D. Napoleon received the Master’s Degree in Computer Applications from Madurai Kamaraj University, Tamil Nadu, India in 2002, and the M.Phil degree in Computer Science from Periyar University, Salem, Tamil Nadu, India in 2007. He has published articles in National and International Journals. He has presented papers both in National and International Conferences. His Current research interest includes: Knowledge discovery in Data Mining, Remote
Sensing and Computer Networks.
S.Sathya received her Master’s degree in computer science and information technology in V.V.Vannia perumal college for women, Virudhanagar, Tamil Nadu India in 2010 and M.Phil Degree in Computer Science from Bharathiar University, Coimbatore, Tamil Nadu, India in 2011. His area
of interest includes Data mining and remote sensing.
M.Praneesh received his Master’s degree in computer science in Bharathiar University, Coimbatore, Tamil Nadu India in 2010 and M.Phil Degree in Computer Science from Bharathiar University, Coimbatore, Tamil Nadu, and India in 2011. His area of interest includes Data mining, Natural Language Processing and remote sensing.
M.Siva Subramanian received his Master’s degree in