http://dx.doi.org/10.4236/ojs.2014.48061
Hazard Rate Function Estimation Using
Weibull Kernel
Raid B. Salha1, Hazem I. El Shekh Ahmed2, Iyad M. Alhoubi3
1Department of Mathematics, The Islamic University of Gaza, Gaza, Palestine 2Department of Mathematics, Al Quds Open University, Gaza, Palestine
3Academic Department, University College of Science and Technology, Gaza, Palestine
Email: [email protected], [email protected], [email protected]
Received 2 July 2014; revised 29 July 2014; accepted 10 August 2014
Copyright © 2014 by authors and Scientific Research Publishing Inc.
This work is licensed under the Creative Commons Attribution International License (CC BY).
http://creativecommons.org/licenses/by/4.0/
Abstract
In this paper, we define the Weibull kernel and use it to nonparametric estimation of the proba-bility density function (pdf) and the hazard rate function for independent and identically distri-buted (iid) data. The bias, variance and the optimal bandwidth of the proposed estimator are in-vestigated. Moreover, the asymptotic normality of the proposed estimator is inin-vestigated. The performance of the proposed estimator is tested using simulation study and real data.
Keywords
Weibull Kernel, Hazard Rate Function, Kernel Estimation, Asymptotic Normality
1. Introduction
Hazard rate functions can be used for several statistical analyses in medicine, engineering and economics. For instance, they are commonly used when presenting results in clinical trials involving survival data.
Several methods for hazard function estimation have been considered in the literature. Hazard function esti-mation by nonparametric methods has an advantage in flexibility because no formal assumptions are made about the mechanism that generates the sample order or the randomness. Estimators of the hazard function based on kernel smoothing have been studied extensively. For instance, see [1]-[5].
The performance of the estimator at boundary points differs from the interior points due to so-called “boun-dary effects” that occur in nonparametric curve estimation problems; more specifically, the bias of the estimator at boundary points. To remove those boundary effects in kernel density estimation, a variety of methods have been developed in the literature. Some well-known methods are summarized below:
2) The local linear method [9] [10].
In [11] this problem is solved by replacing the symmetric kernels by asymmetric Gamma kernel which never assigns weight outside the support.
A lot of people who care of estimation do many specific distributions, such as normal, log-normal, gamma and inverse-gamma distributions, and this makes us pose a question which is: is there any other distributions which can be used as a kernel in the estimation and then give us acceptable results?
In this paper, we propose the Weibull kernel which also never assigns weight outside the support. The Wei-bull distribution is a continuous probability distribution. It is named after Waloddi WeiWei-bull, who described it in detail in 1951, although it was first identified by Frchet (1927) and first applied by Rosin and Rammler (1933) to describe a particle size distribution.
This paper is organised in five sections. In the first section, we present some information about kernel smoothing, hazard functions and the proposed kernel. In the second section, we introduce some definitions and relations, and state the conditions under which the results of the paper will be proved. In the third section, we investigate the bias, variance and optimal bandwidth of the Weibull kernel estimator. In the fourth section, we investigate the asymptotic normality of the Weibull kernel estimator of the pdf and of the hazard function esti-mator. In the fifth section, the performance of the proposed estimator will be tested via two applications, simu-lated and real data.
2. Preliminaries
In this section, we state the conditions under which the results of the paper will be proved. Also, we mention the definition of gamma function and some relations related to it, then we will define Weibull kernel.
Conditions
1) Let
{ }
xi ni=1 be a random sample from a distribution of unknown probability density function f defined on[
0,∞)
such that f has a continuous second derivative. 2) 4( ) ( )
2d x f′′ x x< ∞
∫
and 0 f x( )
dx .x
<
∫
< ∞3)
( )
( )
( ) ( )
4 2
d exp ln 8
4 d
x f x x
f x n
x x
γ γ
′′ −
>
∫
∫
, where γ =0.5772156649 is Euler’s constant.
4) h is smoothing parameter satisfying h 1 0 nh
+ → as n→ ∞. The Gamma function is defined to be the improper integral:
( )
1( )
0 exp d , 1
x
x ∞t − t t x
Γ =
∫
− ≥The Taylor expansion about zero of Γ +
(
1 x)
and( )
1xΓ is available and given by:
(
1)
1 1 2 π2 2( )
2 12 6
x γx γ x o x γx
Γ + = − + + + ≈ −
( )
( )
2
2 2 3 3
1 1 π
2 6
x x x o x x
x γ γ
= + + − + ≈
Γ
Also, Γ′
( )
1 = −γ.On the other hand, notice that:
(
)
1(
(
)
)
(
(
)
)
( )
( )
( )
0 0 0
ln 1 1 1
lim 1 exp lim exp lim exp exp
1 1
x
x x x
x x
x
x x γ
→ → →
Γ + Γ′ + Γ′
Γ + = = = = −
Moreover, the difference between
(
)
1
1−γx x and exp
( )
−γ gets small when x→0, we can approximate(
)
11−γx x by exp
( )
−γ .In this paper we consider the following Weibull kernel function:
( )
(
)
(
)
(
)
1 1
1
1 1 1
1
, exp , 0
h h
w
h t h t h
K x t t
h hx x x
−
Γ + Γ + Γ +
= − ≥
If a random variable Y has a pdf Kw x,1
( )
t h
, then E Y
( )
=x, and the variance is( )
2(
(
1 2)
)
var 1
1 h
Y x
h
Γ +
= Γ + −
We propose the following estimator of the probability density function f
( )
. , the Weibull estimator,( )
( )
1
1 1
ˆ n ,
w i
i
f x K x X
n = h
=
∑
3. Bias, Variance and Optimal Bandwidth
Proposition 1.
The bias of the proposed estimator is given by:
( )
( )
ˆ 1 2(
(
1 2)
)
( ) ( )
Bias 1 1
2 1
h
f x x f x o
h
Γ + ′′ = Γ + − +
(1.1)
Proof:
( )
(
)
0( ) ( )
(
( )
)
1
ˆ , d
w x
E f x K x y f y y E f
h ξ
∞
= =
∫
where ξx follows a Weibull distribution with scale parameter
(
)
1 x
h
Γ + and shape parameter 1
h, and from the expression of the mean and variance of Weibull distribution we deduce that the mean is µx =E
( )
ξx =xand
( )
(
)
(
)
(
)
2
2
1 2
Var 1
1
x x
h
V x
h
ξ Γ +
= = −
Γ +
.
The Taylor expansion about µx for f
( )
ξx is:( )
( )
( )(
)
1( )(
)
2( )
1 . 2
x x x x x x x x
f ξ = f µ + f′ µ ξ −µ + f′′ µ ξ −µ +o
So,
(
ˆ( )
)
( )
1( ) ( ) ( )
var 1 . 2x x
E f ξ = f x + f′′ x ξ +o
( )
(
)
( )
(
)
(
)
(
)
( ) ( )
2
2
1 2 1
ˆ 1 1 .
2 1
x
h
E f f x x f x o
h
ξ = + Γ + − ′′ +
Γ +
(1.2) Hence,
( )
(
)
2(
(
(
)
)
)
( ) ( )
2
1 2 1
ˆ
Bias 1 1
2 1
h
f x x f x o
h
Γ +
′′
= − +
Γ +
Proposition 2.
The variance of the proposed estimator is given by:
( )
(
ˆ)
23 2(
(
)
)
1( )
(
1 2)
Var 1
h
h
f x h f x o n h
nx
−
− −
= Γ + + (1.3)
Proof:
( )
( )
( )
( )
( )
2 2
1 1 1 1 1
ˆ
Var f x Var Kw x, t E Kw x, t E Kw x, t
n h n h h
= = − where,
( )
(
)
(
)
(
)
(
)
(
)
(
)
(
)
(
)
(
)
(
)
2 1 2 2 2 1 1 12 1 1
2 2
1
2 1
2 2
1 1 1
1
, exp 2
1 1 2 1 2 1
exp 2
1 1 2 1
2
h h
w
h h h h
h
h
h h
h
h t h t h
K x t
h hx x x
h t h t h t h
x x
h x x
h t h t h
x
h x x
−
− −
−
Γ + Γ + Γ +
= − Γ +
Γ + Γ + Γ +
= −
Γ +
Γ + Γ +
=
(
)
(
)
(
)
(
)
(
)
(
)
(
)
(
)
(
)
(
)
(
)
1 1 1 1 1 1 1 1 1 1 1 1 1 1 12 1 2 1
exp
2 1
2 1 2 1 2 1
1 1
1 exp
2
1 2 1 2 1 2
1 exp 2 h h h h h
h h h h h
h
h h
h h h h
h h
h t h
xh
xh x
h
h t h t h
h t
x xh x x
h h t h t
t
x xh x
− − − − −
⋅ Γ + Γ +
− Γ +
Γ + Γ + Γ +
= Γ + ⋅ −
Γ + Γ + Γ +
= ⋅ −
(
1 h)
1hx
Γ +
Using the transformation z=2ht we get:
( )
(
)
(
)
(
)
(
)
(
)
(
)
(
)
(
)
1 1 11 1
1 2
1 1 1
1
2 3 1
1
1 2 1 1 1
1 1
, exp 2
2 2
1 1 1 1
1
exp for 0
2
h
h h h h
h
w h
h h h h
h
h z h z h z h
K x z
h x xh x x
h h z h z h
z z
x xh x x
− − − − −
Γ + Γ + Γ + Γ +
= ⋅ − ⋅
Γ + Γ + Γ + Γ +
= ⋅ − < < ∞
Therefore,
( )
11( )
2
,
1
, h ,
w x h x x
E K x z E B f
h η η
− = where
(
)
12 3 , 1 1 2 h h x h h B x
− Γ +
=
and ηx follows as Weibull distribution with mean µx =E
( )
ηx =x and variance( )
(
)
(
)
(
)
2 2 1 2 Var 1 1 x x h V x hη Γ +
= = −
Γ +
The Taylor expansion of
( )
1 1
h x f x
η − η is as follows:
( )
( )
( )
( ) (
)
( )
( )
( ) (
)
( )
1 1 1 1
1 1 2 1
1 1 1
3 2 1 2
2
1 1
1 1 1
1 2 2 1
h h h h
x x x x x x x x x x
h h h
x x x x x x x x
f f f f
h
f f f o h
h h h
η η µ µ µ µ µ µ η µ
µ µ µ µ µ µ η µ
− − − − − − − − ′ = + − + − ′ ′′ + − − + − + − + So,
( )
( )
( )
( )
( )
(
)
(
)
(
)
( )
( )
(
)
(
)
(
)
( )
(
)(
)
( )
(
)
( )
(
)
1 1 1 1
1 1 3 2
1 1
2 2
2
1 1 1
1 1 3
2 2
2
1 2
2 2
1 1 1
1 2 2 1
1 2 1 1
1 2
1 1 1 2
1
1 2 2
h h h h
x x
h
h h h
h
E f x f x x f x x f x
h h h
h
x f x x o h
h
h
x f x x x f x h h h x f x
h
h
h h x f x x
η − η − − −
− − − − − − − ′ = + − − + −
Γ +
′′
+ − +
Γ +
Γ +
′′
= + − + − −
Γ +
Γ +
′ + −
(
(
)
)
( )
2 2 1 1 o h h − − + Γ +
This implies that
( )
(
(
)
)
( )
(
(
)
)
(
)
(
)
(
)
( )
(
)
(
)
(
)(
) ( )
(
)
( )
(
)
(
)
(
)
( )
1 1 3 2 1 1
3 2
, 2
1
2 3 2 2 2
2
1 2 2
1 2 1 1
1
1 1 2 1 2
2 1 2 1
1
h
h
h h h
x h x x
h h
h
E B f h f x x h f x
x h
h h h
h h f x h h f x o h
x h
η − η − −
− − −
Γ +
′′
= Γ + + Γ + −
Γ +
− − Γ +
′
+ Γ + + − − +
Γ + Therefore,
( )
(
)
(
(
)
)
( )
(
( ) ( )
)
(
)
(
)
(
)
( )
(
)
3 2 1
2 1 2
3 2 1
1 2
2 1
ˆ
Var 1 1
2 1 . h h h h
f x h f x f x o o n h
nx n
h f x o n h
nx
−
− −
−
− −
= Γ + − + +
= Γ + +
Optimal Bandwidth:
First of all, we will define MSE and Mean Integrated Squared Error (MISE) as follows:
( )
(
(
(
)
)
)
( ) ( )
(
(
)
)
( )
(
)
(
)
(
)
(
)
( )
(
(
)
)
( )
(
)
(
)
(
)
(
)
( )
(
(
)
)
( )
2 12 1 2
2
2
1
4 2 1 2
2 2 1 4 2 2 1 2 1 8 ˆ
MSE 1 1 1
2 1 4
1 2
1 8
1 1
4 1 4
1 2
1 8
1 1
4 1 4
h h h h h h h
f x f x o h f x o n h
nx h
h
x f x h f x o n h
nx h
h
x f x h f x
nx h
− −
− −
Γ +
′′
= − + + Γ + +
Γ +
Γ +
′′
= − + Γ + +
Γ +
Γ +
′′
≈ − + Γ +
Γ +
( )
(
(
(
)
)
)
( )
(
(
)
)
( )
2
1
4 2
2
1 2
1 8
ˆ
MISE 1 d 1 d
4 1 4
h
h
h f x
f x f x x h x
n x
h
Γ +
′′
= − + Γ +
Γ +
∫
∫
(1.4)
The Taylor expansion of 8h is given as follow:
( )
(
( )
)
( )
( )
2
2 ln 8 2
8 1 ln 8 1 ln 8
2
h
h h o h h
= + + + ≈ +
Therefore, we can approximate MISE to be:
( )
ˆ 1[
]
2 2exp( )
(
( )
)
MISE 1 2 1 ln 8 ,
4 4
I I
f h h
n
γ
γ −
= − + + (1.5)
where, 4 2
( )
1 d
I =
∫
x f′′ x x and 2( )
d .f x
I x
x
=
∫
We will now find the optimal bandwidth by minimizing (1.5) with respect to h, so we have
( )
2 2( ) ( )
1 1
ˆ
d MISE exp ln 8
2 .
d 4
f I
I I h
h n
γ
γ γ −
= − + + (1.6)
( )
22 1 2
ˆ d MISE
2 0.
d f
I
h = γ > (1.7) Setting (1.6) equal zero yields the optimal bandwidth hopt for the given pdf and kernel:
( ) ( )
1 2
2 1
4 exp ln 8
8
opt
n I I
h
n I
γ γ
γ
− −
= (1.8)
In addition, (1.7) proves that this value minimize (1.5). Substituting (1.8) for h in (1.5) gives the minimum MISE for the given pdf and kerne which is given by:
( ) ( )
2( )
( )
( ) ( )
2 2 1 2
1
2
1 1
exp ln 8 exp 4 exp ln 8
MISE 1 ln 8
4 4 4 8
opt
I I n I I
I
n I n n I
γ γ γ γ
γ γ
− − − −
= + +
(1.9)
Note that hopt depend on the sample size n, the kernel and on the unknown pdf.
4. Asymptotic Normality
In this section, we state the main two theorems talking about the asymptotic normality for the proposed estima-tor and an important lemma which we will use in the second main theorem.
Definition 1. A hazard rate function is defined as the probability of an event happening in a short time inter-val. More precisely, it is defined as:
( )
(
)
0
lim , 0.
x
P X x x X x
r x x
x
∆ →
≤ + ∆ >
= >
∆
The hazard rate function can be written as the ratio between the pdf f
( )
. and the survivor function( )
. 1( )
.S = −F as follows:
( )
f x( )
( )
r xS x
=
The kernel estimator of S
( )
. is S xˆ( )
= −1 F xˆ( )
where,( )
0( )
0( )
1
1 1
ˆ
ˆ x d n x , d
w i
i
F x f u u K u X u
n = h
= =
∑
∫
∫
( )
( )
( )
ˆ ˆ ˆ f x r x S x =Theorem 1. Under conditions 1, 2, and 3, the following holds
(
)
(
)
(
( )
( )
)
( )
3 2 1 ˆ 2 0, 4 1 h d h f x nhf x f x N
x h − − → Γ + (1.10) Proof:
Let Vni Kw x,1
( )
Xi h
=
, i=1, 2,,n. Then
( )
11
ˆ n
ni i
f x V
n =
=
∑
, where Vni, 1, 2,i= ,n are independent and identically distributions (iid) and σni2 < ∞.We show now that the Liapounov condition is satisfied, that is for some δ >0,
( )
( )
2
2 2
lim n n 0
n
n
E V E V
n V δ δ δ σ + →∞ + − =
First of all, we have:
(
)
(
)
( )(
)
(
)
(
)
(
)
(
)
( )(
)
(
)
(
)
(
)
( )( )(
)
1 1
2 1 2
2
1 1
1 2 2
1 2
1 1 1
exp 2 , 0
1 2 1 1
2 exp , 2
1 2 h h n h h h h h h h
h t h t h
V t
hx x x
h z h z h
z t
hx x x
h hx δ δ δ δ δ δ δ δ δ δ δ + − + + − + + − − + +
Γ + Γ + Γ +
= − + ≥
Γ + + Γ + Γ +
= + − = + Γ + = +
(
)
( )(
)
(
)
(
)
(
)
( )( ) ( )(
)
(
)
(
)
(
)
1 1 1
1 1 1 1
1 1 1
1 1
1 1
1 2 1
1 1 1 1
exp
1 1 1 1
2 exp
h h h
h h h
h h h
z h h z h z h
x hx x x
h h z h z h
h z
x hx x x
δ δ δ δ δ δ δ + − + − + − − + − + + − −
Γ + Γ + Γ + Γ +
−
Γ + Γ + Γ + Γ +
= + −
( )
(
)
(
)
1 1(
)
11
1 1 1 1 1
exp
h h
h h z h z h
z
hx x x
δ α − − +
Γ + Γ + Γ +
= −
where,
(
)
( )( )(
)
1
1 2 1 1
2
h
h h h
h x δ δ δ α δ + − + + − − Γ +
= +
. Then we have:
(
)
( )(
)
(
)
(
)
( )
( )
1 1 1 1 1 1 2 0 1 11 1 1
exp d , h h h n h x x
h y h y h
E V y f y y
hx x x
E f δ δ δ δ α αξ ξ − − + ∞ + + − −
Γ + Γ + Γ +
= − =
∫
( )
(
)
(
)
(
)
2 2 1 2 var 1 1 x h x hξ = Γ + −
Γ +
.
The Taylor expansion of
( )
1 1
h
x f x
δ δ
ξ + − − ξ about the mean µx =x is as follows:
( )
( )
( )
( ) (
)
( )
( )
( ) (
)
( )
1 1 1 1
1 1 2 1
1 3
1 1
2 1 2 2
1 1 1 1 1 2 1 2 1
h h h h
x x x
h
h h
x
f x f x x f x x f x x
h
x f x
h h
x f x x f x x o h
h
δ δ δ δ δ δ δ δ
δ δ
δ δ δ δ
δ
ξ ξ δ ξ
δ δ δ δ
δ δ ξ
+ − − + − − + − − + − − + − − + − − + − − − + ′ = + − − + − + + + − − − − + ′ ′′ + − − + − +
( )
( )
( )
( )
( )
(
)
(
)
(
)
( )
( )
(
)
( )
1 1 1
1 1 3
1 1 2 1 2 2 2 1 1 1 2 3 2 1 1 1 2 1 2 1
2 1 1
1
1 2
2
h h h
x x
h h
h h
E f x f x x f x
h h
h
x f x x f x x o h
h h
x f x h x H h h x f x
hH x
δ δ δ δ δ δ
δ δ δ δ
δ δ δ
δ δ
δ δ
δ δ
ξ ξ δ δ
δ δ δ δ + − − + − − + − − + − − + − − − + − − + − − − − − = + + − − + − −
Γ +
+
′ ′′
+ − − + − +
Γ +
= + + − −
+
( )
( )
(
)
(
)
(
)
( )
2 1 2 2
2
1 2
1 ,
1 h
f x h x f x x o h
h
δ
− − − Γ + −
′ + ′′ − +
Γ +
where Hδ = + −1 δ δh−h. Therefore,
(
)
(
)
( )( )(
)
1( )
(
)
2 1 2 1 1 3
2 h h 1 h
n
E V h x h f x o h
δ
δ δ δ δ δ + δ
+ − + + − − − − − −
= + Γ + + (1.11)
Now substituting δ =0, the following is hold:
( )
3 2 1 1(
)
1( )
( )
3Var 2h 1 h .
n
V = − h x− − Γ +h f x +o h−
Hence,
( )
( )
( )
(
)
( )( )(
)
( )
(
)
( )
(
)
( )( )(
)
( )
( )
(
)
( )
12 2 1 2 1 1
2 1
2 2
2 2 2
3 2 1 1
2
1
1 2 1
2
1 2
3 2 1 2 2 1 2 1 2 1 0 2 1 h h h
n n n
h
n n h
h h
h
h h
E V E V E V h x h f x
n V n V
n h x h f x
x h f x
nh x h f x
δ
δ δ δ δ δ
δ δ δ
δ δ δ δ δ δ δ δ δ σ σ δ + + + − + + − − − − + + + − − − + − + + − − + − −
− + Γ +
≤ → Γ +
+ Γ +
= → Γ +
The last term vanishes as n→0, since condition 4 implies that h→0 and nh→ ∞. Also, the remaining component of the last term are bounded from condition 2.
Lemma 1. Under conditions 1, 2 and 3 the following holds
( )
( )
ˆ p 0
Proof:
First of all, we have from the definition of F xˆ
( )
the following relations:( )
( )
( )
( ) ( )
(
( )
)
( )
(
)
(
)
(
)
( )
( )
( ) ( )
0 0 0 0 0
2
2 0
1 1
ˆ , d d , d d d
1 2 1
1 d 1 1
2 1
x x x
w w x
x
EF x K u y uf y y K u y f y y u E f u
h h
h
f u u f u u o F x o
h
ξ
∞ ∞
= = =
Γ +
′′
= + − + = +
Γ +
∫ ∫
∫ ∫
∫
∫
where ξx is defined as in Proposition 1. This implies that, EF xˆ
( )
−F x( ) ( )
=o 1Therefore,
( )
1( )
( )
( )
12 ˆ 2 p 0
nh EF x −F x =o nh →
(1.13) On the other hand, F xˆ
( )
can be written as follows:( )
10( )
1( )
1 1 1
ˆ n x , d n
w i
i i
F x K u y u W x
n = h n =
= =
∑
∫
∑
where
( )
( )
0
1
, d .
x
i w
W x K u y u
h
=
∫
Now, given ε >0, δ >0, then we have:
( )
( )
( )
( )
( )
( )
( )( )
( )
( )
( )
( )
( )
( )
( )
( )
( )
2 2
1 1 2 2
2 2 2 1 2 2 2 2 1
2 2 2 2
1
1 2 2 1 2 2
2 2 1 2 2 1
1 1
ˆ ˆ
ˆ ˆ ˆ ˆ
n i i i n n i i i i
E F x EF x
P nh F x EF x nh E F x EF x
nh
nh n E W x EW x
n h E W x n h EW x
δ δ δ δ δ δ δ δ δ δ
δ δ δ δ
δ δ ε ε ε ε ε ε + + + − − − + + + + − − − − = + + + + − − − − − − = = −
− > ≤ = −
= − ≤ +
∑
∑
∑
The second term vanishes as n→ ∞ and h→0, since from 1.2 we have
( )
1 1( )
2 2(
( )
1 1)
1,
n i i
n h− +δ EW x +δ o n h− +δ
=
=
∑
Further, by replacing δ with 2δ in (1.11) and assuming that
(
)
( )( )(
)
1 21 2 2
, 2 2 1
h h h h h δ δ δ
τ δ − + + +
= + Γ +
we have:
( )
( )
( )
( )
( )
( )
( )
( )
( )
( )
( )
(
( )
)
1 1 2 22 2 1
2
1
2 2
2 2 1 1
0 0
2 2
2 2 1
0 0
2 2 2 1 2
, 0
ˆ ˆ
1
, d d
1
, d d
d 0 n i i x w x w x h
P nh F x EF x n h E W x
n h n k u y uf y y
h
n h k u y f y y u
h
nh x f x u o nh h
δ δ
δ
δ δ δ δ
δ δ δ δ
δ δ δ δ δ ε ε ε ε ε τ + + + − = + ∞ − − − − + + ∞ − − − + − − − − − − −
− > ≤
= = = + →
∑
∫ ∫
∫ ∫
∫
( )
1( )
( )
2 ˆ ˆ p 0.
Since F xˆ
( )
−F x( )
≤ F xˆ( )
−EF xˆ( )
+ EF xˆ( )
−F x( )
, then by (1.13) and (1.14), we have:( )
1( )
( ) ( )
1( )
( ) ( )
1( )
( )
2 ˆ 2 ˆ ˆ 2 ˆ p 0
nh F x −F x ≤ nh F x −EF x + nh EF x −F x →
This complete the proof of the lemma.
Theorem 2. Under conditions 1, 2, and 3, the following holds
(
)
(
)
(
( ) ( )
)
( )
( )
3
2
1 ˆ
2 0,
4 1
h
d
h
r x nh
r x r x N
xS x h
−
− →
Γ +
(1.15)
Proof:
(
)
(
)
(
( ) ( )
)
(
(
)
)
( )
( )
( )
( )
(
)
(
)
( )
( )
( )
( )
( )
( )
( )
( )
( )
(
(
)
)
( )
( )
( ) ( )
( )
( )
( )
(
(
)
)
(
( )
( )
)
( ) ( )
( )
(
(
)
)
(
( ) ( )
)
( )
( )
3 3
2 2
1 1
3 2
1
3 2
1
3 3
2 2
1 1
ˆ ˆ
2 2
ˆ
1 1
ˆ 2
ˆ ˆ ˆ
1
ˆ
2 ˆ
ˆ
1
2
2 ˆ ˆ
ˆ ˆ
1 1
0, 4
h h
h h
h
h
h
h
h h
h h
d
f x f x
nh nh
r x r x
S x S x
h h
f x f x f x f x
nh
S x
S x S x S x
h
f x S x nh
f x f x f x
S x S x
h
f x
nh nh
f x f x S x S x
S x h S x S x h
r x N
xS x
− −
−
−
− −
− = −
Γ + Γ +
= − − +
Γ +
= − − +
Γ +
= − − −
Γ + Γ +
→
Note that the second term vanishes by (1.12), and the first term is asymptotically normally distributed by (1.10).
Moreover, from (1.10) and (1.15) too we have:
( )
(
)
(
( )
( )
)
( )
( )
(
)
( )
(
)
(
)
(
)
( )
( )
( )
(
)
(
)
(
)
( )
( )
( )
2
2
2
2
1 2 1
1
ˆ 2 1
ˆ 1
ˆ ( )
1 2 1
1
2 1
1 h
f x x f x
E f x h
E r x o
S x
E S x
h
x f x
h
r x o
S x
Γ +
′′
+ −
Γ +
= = +
Γ +
− ′′
Γ +
= + +
Therefore,
( )
(
)
(
)
(
)
(
)
( )
( )
( )
2
2
1 2 1
1
2 1
ˆ
Bias 1
h
x f x
h
r x o
S x
Γ +
− ′′
Γ +
= +
and,
( )
(
)
3 2(
(
)
)
1( )
( )
(
)
1 22 ˆ
Var 1
h
h r x
r x h o n h
nx S x
−
− −
5. Applications
In this section, the performance of the proposed estimator in estimating the pdf and hazard rate function is tested upon two applications using a simulated and real life data.
5.1. A Simulation Study
A sample of size 200 from the exponential distribution with pdf f x
( )
=exp( )
−x is simulated. We computed the bandwidth using the relation1 5
0.79 ,
opt
h = Rn− (1.16) see [8] page 47 and it equals (0.36658).
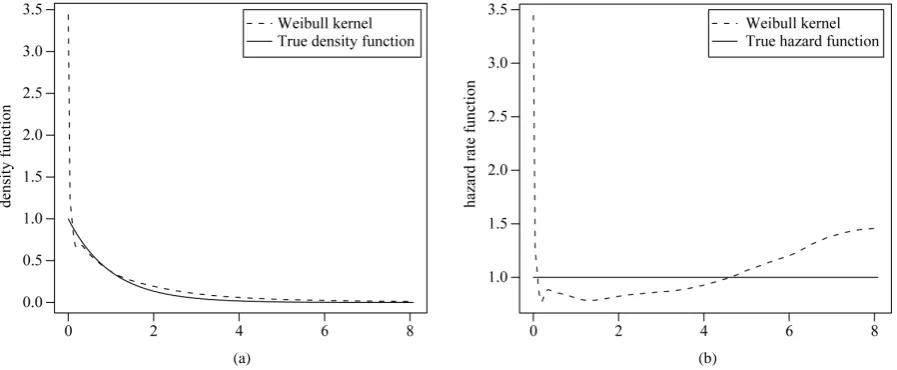
The density and the hazard functions were estimated using the Weibull estimator. The estimated values and the true exponential pdf are plotted inFigure 1(a), this figure shows that the performance of the Weibull esti-mator is acceptable at the boundary near the zero. In the interior the behavior of the pdf estiesti-mator becomes more similar as we get away from zero. Also Figure 1(b)shows that the performance of the Weibull estimator of the hazard function is acceptable at the boundary near the zero which we concern on. The mean squared error (MSE) of proposed estimator of the density function is equal to 0.0001393763 and for the hazard function is evaluated for the interval [0, 0.5]—because we concern about closest values to zero—and is equal to 0.0189427.
5.2. Real Data
In this subsection, we used the suicide data given in Silverman [8], to exhibit the practical performance of the Weibull estimator. The data gives the lengths of the treatment spells (in days) of control patients in suicide study. We used the logarithm of the data to drawFigure 2(a) andFigure 2(b) using bandwidth equals 0.480411 which computed by (1.16), these figures exhibit the two estimated functions of the probability density and hazard rate functions, respectively.
6. Comment and Conclusion
In this paper, we have proposed a new kernel estimator of the hazard rate function for (iid) data based on the Weibull kernel with nonnegative support; we showed that the bias depends on the smoothing parameter h and the estimated point x, and it goes to zero as h→0, also it gets small for the values of x closed to zero. The va-riance was investigated and we noticed that it depends also on h and x. On the other hand, it goes to zero as
0
h→ , and gets large at the values of x close to zero. Moreover, the optimal bandwidth and the asymptotic normality were investigated.
[image:11.595.90.539.509.694.2]
(a) (b)
[image:12.595.90.538.81.270.2]
(a) (b)
Figure 2. (a) The Weibull kernel estimator of the density function; (b) The hazard rate function for the suicide data.
In addition, the performance of the proposed estimator is tested in two applications. In a simulation study us-ing exponential sample we noticed that the performance of the proposed estimator is acceptable, and gives a small MSE.
Using real data, we exhibited the practical performance of the Weibull estimator.
References
[1] Salha, R. (2012) Hazard Rate Function Estimation Using Inverse Gaussian Kernel. The Islamic University of Gaza Journal of Natural and Engineering Studies, 20, 73-84.
[2] Salha, R. (2013) Estimating the Density and Hazard Rate Functions Using the Reciprocal Inverse Gaussian Kernel. 15th Applied Stochastic Models and Data Analysis International Conference, Mataro (Barcelona), 25-28 June 2013.
[3] Scaillet, O. (2004) Density Estimation Using Inverse and Reciprocal Inverse Gaussian Kernels. Nonparametric Statis-tics, 16, 217-226. http://dx.doi.org/10.1080/10485250310001624819
[4] Watson, G. and Leadbetter, M. (1964) Hazard Analysis I. Biometrika, 51, 175-184. http://dx.doi.org/10.1093/biomet/51.1-2.175
[5] Rice, J. and Rosenblatt, M. (1976) Estimation of the Log Survivor Function and Hazard Function. Sankhya Series A, 38, 60-78.
[6] Cline, D.B.H. and Hart, J.D. (1991) Kernel Estimation of Densities of Discontinuous Derivatives. Statistics, 22, 69-84. http://dx.doi.org/10.1080/02331889108802286
[7] Schuster, E.F. (1985) Incorporating Support Constraints into Nonparametric Estimators of Densities. Communications in Statistics, Part A—Theory and Methods, 14, 1123-1136. http://dx.doi.org/10.1080/03610928508828965
[8] Silverman, B.W. (1986) Density Estimation for Statistics and Data Analysis. Chapman and Hall, London. http://dx.doi.org/10.1007/978-1-4899-3324-9
[9] Cheng, M.Y., Fan, J. and Marron, J.S. (1997) On Automatic Boundary Corrections. The Annals of Statistics, 25, 1691- 1708. http://dx.doi.org/10.1214/aos/1031594737
[10] Zhang, S. and Karunamuni, R.J. (1998) On Kernel Density Estimation near Endpoints. Journal of Statistical Planning and Inference, 70, 301-316. http://dx.doi.org/10.1016/S0378-3758(97)00187-0