A Comparative Study for Selecting the Best
Unsupervised Learning Algorithm in E-Learning
System
Sunita B Aher
Lobo L.M.R.J.
M.E. (CSE) -II Associate Professor, Head, Department of IT
Walchand Institute of Technology Walchand Institute of Technology Solapur University India Solapur University India
ABSTRACT
Clustering is one of the most important techniques of data mining. Clustering technique in data mining is an unsupervised machine learning algorithm that finds the groups of object such that objects in one group will be similar to one another and are dissimilar to the objects belonging to other clusters. Clustering is called unsupervised machine learning algorithm as groups are not predefined but defined by the data. So the most similar data are grouped into the clusters. In this paper, we compare five clustering algorithm namely Farthest first, MakeDensityBasedClusterer, Simple K-means, EM, Hierarchical clustering algorithm for recommending the course to the student based on student course selection & present the result. According to our simulation, we find that Simple K-means works better than other algorithms.
Keywords
Farthest first, MakeDesityBasedClusterer, Simple K-means , EM, Hierarchical clustering algorithm, Weka
1. INTRODUCTION
The course recommendation system in e-learning is a system that suggests the best combination of subjects in which the students are interested [8]. To obtain the data for Course Recommendation System, we consider the learning management system such as Moodle where we add the 13 course category & under each category there are courses. So we consider total 82 courses. Student logs into the Moodle & enrolled for those courses in which he/she is interested. Since we are using the Moodle, data is stored in Moodle Database. From these we collect only the data relevant for finding out the best combination of courses. After selecting the data, we apply the clustering algorithm on that data. For applying the clustering algorithm we use the open source data mining tool Weka. The Weka workbench contains a collection of visualization tools and algorithms for data analysis and predictive modeling, together with graphical user interfaces for easy access to this functionality [7]. Apriori association rule algorithm is applied on the clustered data to compare the result of clustering algorithm. Finally we present the result.
Figure 1: Framework for finding out the best combination of courses in Course Recommender System
2. LITERATURE REVIEW
In paper [1], D.A. Clausi developed and demonstrated a successful method for segmenting textured images. This KIF (K-means Iterative Fisher linear discriminant) algorithm is a two step process. K-means is used to estimate the class prototypes indicated by the dense groupings. Class assignments based on the K-means result are used as an estimate for the class covariance. This information is used in an iterative class-pairwise Two KIF implementations were presented: a mixture resolving approach is extended to an unsupervised binary hierarchical approach.
Xuezhi Zheng, Zhihua Cai, & Qu Li [2] compared three well known clustering algorithms, used the implementation of K-Means, EM and Farthest-First in Weka. Their experimental results in the test, which is implemented within the Weka framework by the authors, show that EM outperforms other algorithms, in both LML score and classification accuracy, on most of the datasets in terms of
quality of clustering. Considering the performance and comprehensibility of EM, EM is a promising model that could be used in many real world applications.
the original study. The computational savings is significant since these alternatives are 7-27 times faster than Affinity Propagation.
Adrian Ball, David Rye, Fabio Ramos, & Mari Velonaki applied various unsupervised clustering methods to clustering a set of dynamic human arm gestures are compared. Unsupervised clustering is important in gesture recognition as it imposes no a priori bound on the set of gestures. They compared results using v-measure, a metric that allows differential weighting between clustering homogeneity and completeness. Experiments showed that the best clustering method depends on the desired balance between homogeneity and completeness.
Yu Guan1, Ali A. Ghorbani1, and Nabil Belacel [5] proposed a clustering algorithm for intrusion detection, called Y-means. This algorithm is developed based on the H-means+ algorithm [2] (an improved version of the K-means algorithm [1]) and other related clustering algorithms of K-means. Y-means is able to automatically partition a data set into a reasonable number of clusters so as to classify the instances into `normal' clusters and `abnormal' clusters. It overcomes two shortcomings of K-means: degeneracy and dependency on the number of clusters. The results of simulations that run on KDD-99 data set [3] show that Y- means is an effective method for partitioning large data set. An 89.89% detection rate and a 1.00% false alarm rate were achieved with the Y-means algorithm.
Michael Steinbach, George Karypis & Vipin Kumar presented the results of an experimental study of some common document clustering techniques. In particular, they compared the two main approaches to document clustering, agglomerative hierarchical clustering and K-means. Hierarchical clustering is often portrayed as the better quality clustering approach, but is limited because of its quadratic time complexity. In contrast, K-means and its variants have a time complexity which is linear in the number of documents, but are thought to produce inferior clusters. They proposed an explanation for these results that is based on an analysis of the specifics of the clustering algorithms and the nature of document data.
3. CLUSTERING ALGORITHMS
Clustering is finding groups of objects such that the objects in one group will be similar to one another and different from the objects in another group. Clustering can be considered the most important unsupervised learning technique. In educational data mining, clustering has been used to group the students according to their behavior e.g. clustering can be used to distinguish active student from non-active student according to their performance in activities [9].
[image:2.595.79.545.348.615.2]Clustering algorithms may be classified as shown in figure 2:
Figure 2: Classification of Clustering [9]
3.1
Simple
K-means
Clustering
Algorithm
Simple K-means algorithm is a type of unsupervised algorithm in which items are moved among the set of cluster until required set is reached. This algorithm is used to classify the data set, provided the number of cluster is given in prior. This algorithm is iterative in nature. The algorithm for Simple K-means algorithm is given as: Algorithm: Simple K-means clustering algorithm Input:
Set of Elements or Database of transaction D= {t1, t2, t3, …., tn}
Number of required Cluster k Output: Set of Cluster K
Method: Make initial guesses for the means m1, m2...
mk;
Repeat
Assign each element ti to the cluster having the closest mean.
Calculate the new mean for each cluster. Until there are no changes in any mean
m1 m2 K1 K2 2 4 {2,3} {4,10,11,12,20,25,31} 2.5 16 {2,3,4} {10,11,12,20,25,31}
3 18 {2,3,4,10} {11,12,20,25,31} 4.75 19.8 {2,3,4,10,11,12} {20,25,31}
7 25 {2,3,4,10,11,12} {20,25,31}
So two clusters are K1= {2, 3, 4, 10, 11, 12} & K2= {20, 25, 1}
3.2 Farthest First Clustering Algorithm
Farthest first is a variant of K Means that places each cluster centre in turn at the point furthermost from the existing cluster centre. This point must lie within the data area. This greatly speeds up the clustering in most of the cases since less reassignment.
3.3MakeDensityBasedClusterer
Algorithm
In density-based clustering, clusters are defined as areas of higher density than the remainder of the data set. Objects in these sparse areas which are required to separate clusters are usually considered to be noise and border points. In this MakeDensityBasedClusterer Algorithm, each cluster is produced by Simple K-means algorithm.
3.4 EM Clustering Algorithm
In statistics, an expectation–maximization (EM) algorithm is an iterative method for finding maximum likelihood or maximum a posteriori (MAP) estimates of parameters in statistical models, where the model depends on unobserved latent variables. The EM iteration alternates between performing an expectation (E) step, which computes the expectation of the log-likelihood evaluated using the current estimate for the parameters, and maximization (M) step, which computes parameters maximizing the expected log-likelihood found on the E step. These parameter-estimates are then used to determine the distribution of the
latent variables in the next E step [10]. EM assigns a probability distribution to each instance which indicates the probability of it belonging to each of the clusters
.
EM can decide how many clusters to create by cross validation, or you may specify apriori how many clusters to generate.3.5 Hierarchical Clustering Algorithm
Hierarchical clustering is a method of cluster analysis which creates set of clusters. A tree data structure called dendrogram is used to illustrate the hierarchical clustering technique. Root in dendrogram contain one cluster which contains all element to be clustered. Leaf in dendrogram contains a single element cluster. An internal node in dendrogram presents the new cluster formed by merging the cluster that appears as its children in the tree. Strategies for hierarchical clustering generally are of two types. One type is agglomerative type which is a “bottom up” approach. Each individual item is in its own cluster, and iteratively merged the cluster until all items belongs in one cluster. Second type is divisive. This is a "top down" approach. All items are in one cluster initially and splits are performed recursively as one move down the hierarchy.
4. EXPERIMENTAL RESULT
[image:3.595.78.548.472.770.2]We consider the sample data extracted from Moodle course of a college which is the data of 45 students & 15 courses. These 15 courses are C-programming (C), Visual Basic (VB), Active Server Pages (ASP), Computer Network (CN), Network Engineering (NE), Microprocessor (MP), Computer Organization (CO), Database Engineering (DBE), Advanced Database System (ADS), Operating System (OS), Distributed System (DS), Finite Automata System (FSA), Data Structure (DS-I), Software Engineering (SE), and Software Testing & Quality assurance (STQA).
Table 1: Sample data from Moodle Course [8]
Courses→
Roll_No↓ C VB ASP CN NE MP CO DBE ADS OS DS FSA DS-I SE STQA
1 yes yes yes yes yes no no no no no no no yes no no
2 no no no no no no no no no no no no no no no
3 yes yes yes yes yes no no no no yes yes yes yes yes yes
4 no no no yes yes no yes no no no no no no no no
5 yes yes yes yes yes no no yes no yes yes no yes no no
6 yes yes yes no no no no no no yes no no yes no no
7 no no no yes yes yes yes no no no no no no yes no
8 no no no no no no no yes yes yes yes no yes no no
9 no no no yes yes yes yes no no no no yes no no no
10 yes no no no no no no no no no no no no no no
11 yes yes yes no no no no no no yes yes no yes no no
12 yes yes yes yes yes no no no no no no no no no no
13 no no no no no no no yes yes yes yes no yes yes yes
14 yes yes yes yes yes no no no no yes yes no no no no
15 yes yes yes no no no no no no no no no yes no no
16 no no no yes yes no no yes yes yes yes no yes no no
17 yes yes yes no no no no no no yes yes no yes yes yes
18 yes yes yes no no no no no no no no no no no no
19 no no no yes yes yes yes yes yes no no no no no no
20 yes no no no no no no no no yes yes no yes yes yes
21 yes no yes no no yes yes no no yes yes yes no no no
22 no no no no no no no yes yes yes yes no yes no no
23 yes yes yes yes yes yes yes no no yes yes no yes no no
24 yes yes yes yes yes yes yes yes yes yes yes yes yes yes yes
25 no yes yes no no yes yes yes yes yes yes no no no no
26 yes yes yes no no no no no no yes yes no yes no no
27 yes yes yes yes yes no no no no no no no no no no
29 no no no no no yes yes yes yes no no no no no no
30 yes yes yes yes yes no no no no no no no no yes yes
31 no no no no no no no no no no no no no no no
32 yes yes yes no no no no yes yes yes yes no yes no no
33 no no no yes yes no no no no yes yes no yes no no
34 yes yes yes no no no no no no no no no no no no
35 no no no no no no no no no yes yes no no no no
36 no no no yes yes no no no no no no no yes no no
37 yes yes yes yes yes yes yes yes yes no no no no no no
38 no no no no no no no no no yes yes yes yes yes yes
39 yes yes yes yes yes yes yes yes yes yes yes yes yes yes yes
40 no no no no no no no no no no no no no yes yes
41 yes yes yes no no no no no no yes yes no yes no no
42 no no no yes yes no no no no no no no no no no
43 no no no no no no no no no yes yes no yes no no
44 no no no no no no no no no no no no no no yes
45 no no no no no no no no no no no no no no no
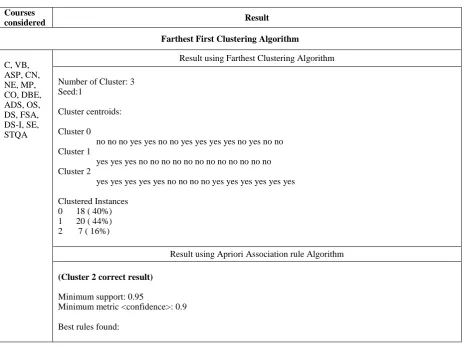
Table 2 represents the result using different clustering algorithms. When seed value is 10 then farthest first algorithm is not giving the correct association rule but when seed value is 1 then this algorithm gives the correct association rules. Farthest first algorithm works opposites to the Simple K-means clustering algorithm. Result of farthest first is shown in first row of table 1 when the seed value is 1 & in second row when the seed value is 10.
In MakeDensityBasedClusterer algorithm we are using the Simple K-means algorithm only & the results are shown in third row of table 2.
Result using Simple K-means algorithm is shown in fourth row of table 2. This result matches with the real world interdependencies among the courses. Hence we consider Simple K-means algorithm for Course
Recommender System. This algorithm is simple to implement also.
Fifth row in table 2 represents the association rules using the EM (Expectation Maximization) clustering algorithm.
[image:4.595.79.542.424.774.2]The result using the Hierarchical Clustering algorithm & link type Complete is shown in sixth row of table 1. As we are recommending the course, we need the association rule containing “yes” only. Hence after clustering of data, we consider only that cluster which gives the association rule containing “yes” only.
The association rule “Distributed_System=yes →Operating_System=yes” means if student is interested in Distributed System then he/she is interested in Operating System & vice versa.
Table 2: Result using various clustering algorithm
Courses
considered Result
Farthest First Clustering Algorithm
C, VB, ASP, CN, NE, MP, CO, DBE, ADS, OS, DS, FSA, DS-I, SE, STQA
Result using Farthest Clustering Algorithm
Number of Cluster: 3 Seed:1
Cluster centroids:
Cluster 0
no no no yes yes no no yes yes yes yes no yes no no Cluster 1
yes yes yes no no no no no no no no no no no no Cluster 2
yes yes yes yes yes no no no no yes yes yes yes yes yes
Clustered Instances 0 18 ( 40%) 1 20 ( 44%) 2 7 ( 16%)
Result using Apriori Association rule Algorithm
(Cluster 2 correct result)
Minimum support: 0.95
Minimum metric <confidence>: 0.9
1. Distributed_System=yes →Operating_System=yes conf:(1) 2. Operating_System=yes → Distributed_System=yes conf:(1) 3. Data_Structure_I=yes → Operating_System=yes conf:(1) 4. Operating_System=yes → Data_Structure_I=yes conf:(1) 5. Data_Structure-I=yes → Distributed_System=yes conf:(1) 6. Distributed_System=yes → Data_Structure-I=yes conf:(1)
7. Distributed_System=yes Data_Structure_I=yes → Operating_System=yes conf:(1) 8. Operating_System=yes Data_Structure_I=yes → Distributed_System=yes conf:(1) 9. Operating_System=yes Distributed_System=yes → Data_Structure_I=yes conf:(1) 10. Data_Structure_I=yes → Operating_System=yes Distributed_System=yes conf:(1)
Farthest First Clustering Algorithm
C, VB, ASP, CN, NE, MP, CO, DBE, ADS, OS, DS, FSA, DS-I, SE, STQA
Result using Farthest Clustering Algorithm
Number of Cluster: 3 Seed:10
Cluster centroids:
Cluster 0
no no no yes yes yes yes yes yes no no no no no no Cluster 1
yes yes yes no no no no no no yes yes no yes yes yes Cluster 2
no no no no no no no yes yes yes yes no yes no no
Clustered Instances 0 10 ( 22%) 1 20 ( 44%) 2 15 ( 33%)
Result using Apriori Association rule Algorithm (None of the cluster gives the correct result.)
Cluster 0 result
Minimum support: 0.95
Minimum metric <confidence>: 0.9
Best rules found:
1. Distributed_System=no → Oerating_System=no conf:(1) 2. Oerating_System=no → Distributed_System=no conf:(1)
3. Softare_Tesing_And_Quality_Assurance=no → Oerating_System=no conf:(1) 4. Oerating_System=no → Softare_Tesing_And_Quality_Assurance=no conf:(1) 5. Softare_Tesing_And_Quality_Assurance=no → Distributed_System=no conf:(1) 6. Distributed_System=no 10 → Softare_Tesing_And_Quality_Assurance=no conf:(1)
7. Distributed_System=no Softare_Tesing_And_Quality_Assurance=no → Oerating_System=no conf:(1) 8. Oerating_System=no Softare_Tesing_And_Quality_Assurance=no → Distributed_System=no conf:(1) 9. Oerating_System=no Distributed_System=no → Softare_Tesing_And_Quality_Assurance=no conf:(1) 10. Softare_Tesing_And_Quality_Assurance=no → Oerating_System=no Distributed_System=no conf:(1)
Cluster 1 result
Minimum support: 0.8
Minimum metric <confidence>: 0.9
Best rules found:
1. Active_Server_Pages=yes 17 → C_Programming=yes 17 conf:(1)
2. Database_Engineering=no 17 → Advanced_Database_System=no 17 conf:(1) 3. Visual_Basic=yes 16 → C_Programming=yes 16 conf:(1)
10. C_Programming=yes Visual_Basic=yes 16 → Active_Server_Pages=yes 16 conf:(1)
Cluster 2 result
Minimum support: 0.95
Minimum metric <confidence>: 0.9
Best rules found:
1. Computer_Organization=no 14 → Microprocessor=no 14 conf:(1) 2. Microprocessor=no 14 → Computer_Organization=no 14 conf:(1) 3. Microprocessor=no 14 → Finite_State_Automata=no 14 conf:(1) 4. Computer_Organization=no 14 → Finite_State_Automata=no 14 conf:(1) 5. Software_Engineering=no 14 → Finite_State_Automata=no 14 conf:(1)
6. Computer_Organization=no Finite_State_Automata=no 14 → Microprocessor=no 14 conf:(1) 7. Microprocessor=no Finite_State_Automata=no 14 → Computer_Organization=no 14 conf:(1) 8. Microprocessor=no Computer_Organization=no 14 → Finite_State_Automata=no 14 conf:(1) 9. Computer_Organization=no 14 → Microprocessor=no Finite_State_Automata=no 14 conf:(1) 10. Microprocessor=no 14 → Computer_Organization=no Finite_State_Automata=no 14 conf:(1)
MakeDensityBasedClusterer Clustering algorithm
C, VB, ASP, CN, NE, MP, CO, DBE, ADS, OS, DS, FSA, DS-I, SE, STQA
Result using MakeDensityBasedClusterer Clustering algorithm
Number of Cluster: 2 Seed:10
Cluster centroids:
Cluster 0
Mean/Mode: no no no no no no no no no no no no no no no Cluster 1
Mean/Mode: yes yes yes yes yes no no no no yes yes no yes no no
Clustered Instances 0 27 ( 60%) 1 18 ( 40%)
Result using Apriori Association rule Algorithm
(Cluster 1 correct result)
Minimum support: 0.95
Minimum metric <confidence>: 0.9
Best rules found:
1. Visual_Basic=yes → C_Programming=yes conf:(1) 2. C_Programming=yes → Visual_Basic=yes conf:(1) 3. Active_Server_Pages=yes → C_Programming=yes conf:(1) 4. C_Programming=yes → Active_Server_Pages=yes conf:(1) 5. Active_Server_Pages=yes → Visual_Basic=yes conf:(1) 6. Visual_Basic=yes → Active_Server_Pages=yes conf:(1)
7. Visual_Basic=yes Active_Server_Pages=yes → C_Programming=yes conf:(1) 8. C_Programming=yes Active_Server_Pages=yes → Visual_Basic=yes conf:(1) 9. C_Programming=yes Visual_Basic=yes → Active_Server_Pages=yes conf:(1) 10. Active_Server_Pages=yes → C_Programming=yes Visual_Basic=yes conf:(1)
Simple K-means Clustering algorithm
C, VB, ASP, CN, NE, MP, CO, DBE, ADS, OS,
Result using Simple K-means Clustering algorithm
Number of Cluster: 2 Seed:10
DS, FSA, DS-I, SE, STQA
Cluster 0
Mean/Mode: no no no no no no no no no no no no no no no Cluster 1
Mean/Mode: yes yes yes yes yes no no no no yes yes no yes no no
Clustered Instances 0 25 ( 56%) 1 20 ( 44%)
Result using Apriori Association rule Algorithm
(Cluster 1 correct result)
Minimum support: 0.85
Minimum metric <confidence>: 0.9
Best rules found:
1. Visual_Basic=yes → C_Programming=yes conf:(1) 2. C_Programming=yes → Visual_Basic=yes conf:(1) 3. Active_Server_Pages=yes → C_Programming=yes conf:(1) 4. C_Programming=yes → Active_Server_Pages=yes conf:(1) 5. Active_Server_Pages=yes → Visual_Basic=yes conf:(1) 6. Visual_Basic=yes → Active_Server_Pages=yes conf:(1)
7. Visual_Basic=yes Active_Server_Pages=yes → C_Programming=yes conf:(1) 8. C_Programming=yes Active_Server_Pages=yes → Visual_Basic=yes conf:(1) 9. C_Programming=yes Visual_Basic=yes → Active_Server_Pages=yes conf:(1) 10. Active_Server_Pages=yes → C_Programming=yes Visual_Basic=yes conf:(1)
EM clustering algorithm
C, VB, ASP, CN, NE, MP, CO, DBE, ADS, OS, DS, FSA, DS-I, SE, STQA
Result using EM clustering algorithm
Number of cluster :-1 Seed: 100
Clustered Instances 0 10 ( 22%) 1 13 ( 29%) 2 12 ( 27%) 3 10 ( 22%)
Result using Apriori Association rule Algorithm
(Cluster 2 correct result)
Minimum support: 0.95
Minimum metric <confidence>: 0.9
Best rules found:
1. Operating_System=yes → Active_Server_Pages=yes conf:(1) 2. Active_Server_Pages=yes → Operating_System=yes conf:(1) 3. Distributed_System=yes → Active_Server_Pages=yes conf:(1) 4. Active_Server_Pages=yes → Distributed_System=yes conf:(1) 5. Distributed_System=yes → Operating_System=yes conf:(1) 6. Operating_System=yes → Distributed_System=yes conf:(1)
7. Operating_System=yes Distributed_System=yes→ Active_Server_Pages=yes conf:(1) 8. Active_Server_Pages=yes Distributed_System=yes → Operating_System=yes conf:(1) 9. Active_Server_Pages=yes Operating_System=yes → Distributed_System=yes conf:(1) 10. Distributed_System=yes→ Active_Server_Pages=yes Operating_System=yes conf:(1)
Hierarchical clustering algorithm (Complete Link)
C, VB, ASP, CN,
NE, MP, CO, DBE, ADS, OS, DS, FSA, DS-I, SE, STQA
Clustered Instances 0 18 ( 40%) 1 3 ( 7%) 2 24 ( 53%)
(Cluster 0 correct result)
Minimum support: 0.95
Minimum metric <confidence>: 0.9
Best rules found:
1. Distributed_System=yes → Operating_System=yes conf:(1) 2. Operating_System=yes → Distributed_System=yes conf:(1) 3. Data_Structure_I=yes → Operating_System=yes conf:(1) 4. Operating_System=yes → Data_Structure_I=yes conf:(1) 5. Software_Engineering=yes → Operating_System=yes conf:(1) 6. Operating_System=yes → Software_Engineering=yes conf:(1)
7. Softare_Tesing_And_Quality_Assurance=yes → Operating_System=yes conf:(1) 8. Operating_System=yes → Softare_Testing_And_Quality_Assurance=yes conf:(1) 9. Data_Structure-I=yes → Distributed_System=yes conf:(1)
10. Distributed_System=yes → Data_Structure-I=yes conf:(1)
5.
CONCLUSION
AND
FUTURE
WORK
Clustering is an unsupervised machine learning algorithm. In this paper, we compare five clustering algorithm namely Farthest first, MakeDensityBasedClusterer, Simple K-means, EM, Hierarchical clustering algorithm for course recommender system. We have considered the real sample data extracted from Moodle course of a college & test the result. Farthest first clustering algorithm works opposite to simple k-means clustering algorithm. In MakeDensityBasedClusterer algorithm, we have considered the Simple k-means algorithm. We found that Simple K-means algorithm works better than other algorithms as it is also easy to implement. Future work include finding out the combination of various data mining algorithm to recommend the course to student in virtual learning system.
6. REFERENCES
[1] D.A. Clausi “K-means Iterative Fisher (KIF) unsupervised clustering algorithm applied to image texture segmentation” 0031-3203/02/$22.00 ? 2002 Pattern Recognition Society. Published by Elsevier Science Ltd
[2] Xuezhi Zheng, Zhihua Cai, Qu Li”An Experimental Comparison of Three Kinds of Clustering Algorithms “in Neural Networks and Brain, 2005. ICNN&B '05. International Conference, ISBN 0-7803-9422-4 IEEE
[3] Yushi Jing, Michele Covell, Henry A. Rowley “Comparison of Clustering Approaches for Summarizing Large Populations of Images” in
Multimedia and Expo (ICME), 2010 IEEE International Conference , 978-1-4244-7493-6/10/$26.00 c2010
[4] Adrian Ball, David Rye, Fabio Ramos, Mari Velonaki,”A comparison of unsupervised learning algorithms for gesture clustering” HRI '11 Proceedings of the 6th international conference on Human-robot interaction ISBN: 978-1-4503-0561-7 DOI: 10.1145/1957656.1957686
[5] Yu Guan1, Ali A. Ghorbani1, and Nabil Belacel “An Unsupervised Clustering Algorithm for Intrusion Detection” in Advances in Artificial Intelligence, The 16th Conference of the Canadian Society for Computational Studies of Intelligence (AI 2003)
[6] Michael Steinbach George Karypis Vipin Kumar,”A Comparison of Document Clustering Techniques”
accessed online from
http://www.cs.fit.edu/~pkc/classes/ml-internet/papers/steinbach00tr.pdf on 14-02-2012
[7] http://en.wikipedia.org/wiki/Weka_(machine_learning) accessed on 05-03-2012
[8] Sunita B Aher and Lobo L.M.R.J. Article: A Framework for Recommendation of courses in E-learning System. International Journal of Computer Applications 35(4):21-28, December 2011. Published by Foundation of Computer Science, New York, USA
[9] Sunita B Aher and Lobo L.M.R.J. Data Mining in Educational System using WEKA. IJCA Proceedings on International Conference on Emerging Technology Trends (ICETT) (3):20-25, 2011. Published by Foundation of Computer Science, New York, USA (ISBN: 978-93-80864-71-13)
![Figure 2: Classification of Clustering [9] Clustering](https://thumb-us.123doks.com/thumbv2/123dok_us/8121767.794400/2.595.79.545.348.615/figure-classification-clustering-clustering.webp)
![Table 1: Sample data from Moodle Course [8]](https://thumb-us.123doks.com/thumbv2/123dok_us/8121767.794400/3.595.78.548.472.770/table-sample-data-from-moodle-course.webp)