Web Navigation Path Pattern Prediction using First
Order Markov Model and Depth first Evaluation
V.Valli Mayil
Director/MCA
Vivekanandha Institute of Information and Management Studies Tiruchengode
ABSTRACT
Web usage mining has been defined as a technique of finding hidden knowledge from a log file. The interaction between website and user is recorded in the related web server log file. Web designer is able to analyze the file in order to understand the interaction between users and a web site, which helps to improve web topology. All information of web usage can be generated from log files and it consists of set of navigation sessions that represent the trails formed by users during the navigation process. In this paper, user web navigation sessions are inferred from log data and are modeled as a Markov chain. The chain’s higher probability trails will be the most likely preferred trails on the web site. The algorithm discussed in this paper implements a depth-first search that scans the Markov chain for the high probability trails. The approaches result in prediction of popular web path and user navigation behavior. Web link prediction is the process to predict the Web pages to be visited by a user based on the Web pages previously visited by other user.
General Terms
Web Usage Mining, Markov Model and Pattern Recognition
Keywords
Web navigation, Markov model, Depth first evaluation, Transition and Trail Probability
.
1. INTRODUCTION
A web site is one of the most important components pertaining to the infrastructure for running different modes of organization. It is essential that the site topology should be well-designed for presenting information to potential
in various formats in a log file, the sample log entry is
“Jay.bird.com-fred[25/dec/1998:17:45:35+0000]”GET/…..”200 1234”.There are several consecutive tasks should be conducted on server log file in order to make them to machine readable. This process is called preprocessing which consists of converting the usage, content, and structure information contained in the various available data sources into the data abstractions necessary for pattern discovery. The web log datasets, which include the requests methods, IP addresses of users and timestamps provide much of the potential information of user access behavior in a website. The raw data from the log need to be preprocessed in order to construct data abstractions like users, sessions, click streams and page views. The Preprocessing processes such as data cleaning, User identification and Session identification canbe applied on log data and the original web logs are transferred into user access session datasets for further pattern discovery and data analysis. The log data can be employed to reconstruct the user navigation sessions within the site.
1.1 Data Cleaning:
This process identifies irrelevant information includes image files, information regarding the request finished by auto search engine, such as Crawler, Spider, Robot etc., and requests for graphical page content (e.g., jpg and gif images) and removes the irrelevant information. Files created by non-human clients like indexing search engine robots are removed from the log. Also, all dependent requests like those for embedded images are removed. The resulted web log file contains the actual web page references.identifications. However, due to the privacy concerns, many users choose not to browse sites that need logins and registrations.
1.3 Session Identification:
A Web session is defined as a sequence of requests with close access time, and the requests are related to each other through an evolving information need. Then user sessions are constructed either according to login data, cookies, and session based URLs or heuristics working on combinations of IP-number, user agent and time.The most common session identification method is timeout, in which a user session is defined as a sequence of requests from the same user and no two consecutive requests are separated by a time interval more than a pre-defined threshold. Reference Length identification is a method based on the assumption that a user spends different time on “auxiliary” and “content” pages. A reference length is obtained by estimating an optimal cutoff between the two kinds of references of web page access sequences.
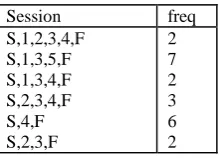
[image:2.595.119.229.463.542.2]Web topology is a network topology of web site and the pages are linked with this network. The user interaction within a web site is defined as a collection of user navigation sessions [1] whose information is embedded in log files. In [7] the authors propose a novel data mining model specific to analyze log data. A user navigation session being inferred from a log file is modeled as a trail[2], which represents a sequence of requests made by the user within a defined time interval. Let us consider the following simplified table 1 illustrates the inferred sessions from log data.
Table 1 Session Sequences
1.4 Data Model:
This is the final step of preprocessing. Once the previous phases have been completed, data are properly formatted before applying mining techniques. Amethod stores data extracted from web logs into a relational database using a click fact schema, so as to provide better support to log querying finalized to frequent pattern mining. Several methods have been proposed to model the web data. The tree structure model is used to store the sequence of web pages and predict the traversal path from them. The Markov model is used to store the sequence of web pages which also supports scalability, high state space and predicts the next page access. In this paper , we have proposed a first order markov model to store te session sequences.
2. MARKOV MODEL CONSTRUCTION
Markov models provide a simple way to capture sequential dependence when modeling the navigational behavior of the users of a web site. In such a model each page in the web site is corresponds to a state in the first order markov model and each pair of pages visited in the session corresponds to a state transition in the model. Each transition probability is estimated by the ratio of number of times the transition was travered and number of times the first state in the pair was visited.
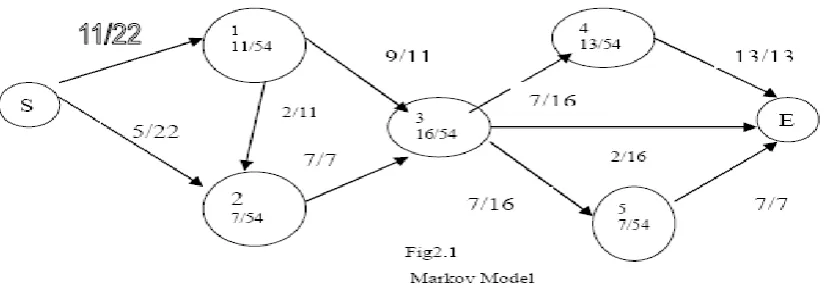
In the Table 1, the first column represents a collection of navigation sessions with starting page S and a finishing page F. The term 'freq' in the second column of the table 1.1 denotes the number of times the corresponding sequence of pages was traversed or visited in the session. These session details are mapped to a weighted directed graph (G) called Markov models. The markov model consists of set of states for all web pages in the sites and a link or edges between two web pages represents page sequence. Each state or web page is defined by the identity number called page number. Each link or edges are denoted by a non negative number represent number of visits of the pair of pages or page sequences.Markov chain is defined by a set of states X, a transition matrix T, and a vector of initial probabilities V. The set of states, X, is composed by the start state, S, the final state, F, and the states that correspond to the web pages visited [5,6,7]. Figure 2.1 represents the first order model for the session sequences given in the table 1. Each state has the numeric value for web page identity and the ratio value defines the page probability. Each linkrepresents the transition probability that is number of times the link is followed after the anchor page is visited. The transition probability is represented in transition matrix which records the transition probabilities which are estimated by the proportion of times the corresponding link was traversed from the anchor
.
Session freq
The fig 2.1 represents the states X={1,2,3,4,5}, V={11/54, 7/54, 16/54, 13/54, 7/54} - vector representation of state probability and Table 2 gives transition probability in terms of matrix representation T
Table 2 Transition Matrix Representation
T 1 2 3 4 5 1 0 2/11 9/11 0 0
2 0 0 7/7 0 0
3 0 0 0 7/16 7/16
4 0 0 0 0 0
5 0 0 0 0 0
2.1 Probability Estimation
The first order markov chain model is used to represent a user navigation session pattern and evaluates the summarization ability and prediction accuracy of traversal path. The model supports the strong prediction power for identifying high probability trail path in all user sessions. This navigation probability provides the means to predict the next link choice of unseen navigation sessions and thus can be used for prefetching links in adaptive we applications. Thefollowing prediction probability can be used in this paper for prediction.
2.1.1 Page or state probability
The initial probability of a state is estimated as the proportion of times the corresponding page was requested by the user. Each state in the markov model represents the web page and the value in the node defines the probability estimate for a user choosing the corresponding page from the set of all pages in the site. This ratio is obtained by dividing number of times the page was viewed by the total number of page views. In this work we consider the total number of page views is 50. Probability of page a is defined by [5]
P(a) = Number of time page was viewed / total number of page view
Each page in the web site is considered to find the state probability and it is depicted in the fig 2.1
2.1.2 Transition probability
The probability of a transition between two pages is estimated by the ratio of the number of times the sequence was visited to the number of times the anchor page was visited [2,5].
2.1.3 Path or trail probability
[image:3.595.196.402.297.370.2]probability that it shoud have the above for a specified cut point probability (CP). Here CP is considered as a threshold value for probability. Each time the transition is accumulated with constarints of CP and path with no cycles. The algorithm is proposed for finding the set of all trails with probability above a specified cut-point consists of a generalization of a depth-first search [3]. An exploration tree is built with the start state as its root wherein each branch of the tree is
explored until its probability falls below the cut-point. We now give the pseudo-code for our depth-first search algorithm. Let us consider G be undirected graph with n vertices. X be the set of states, |X| be its cardinality, Xi, represent a state, T is the transition matrix keeps the link probability, RS represents the set of trails being induced.
Algorithm: DFSmining( G,CP, T)
// given an undirected graph G=(V) with n vertices. T – Transition matrix // set the array visited[] to 0;
1. begin
2. snode = v1 //first vertex of the grapg G 3. Explore (V, snode)
4. end
Algorithm : Explore (V,T)
1. set prevprob =1 and set visited[v] = 1 2. for all vertex w adjacent to V do 3. begin
4. if visited (w) = 0 and ( T(v,w) * prevprob >= CP) then 5. begin
6. RS = RS U (v,w); prevprob = T[v,w]; 7. Explore(w);
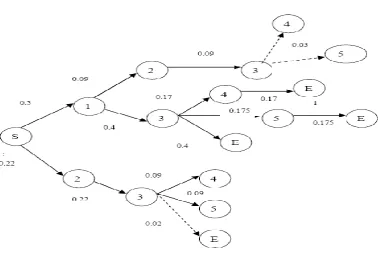
Fig 3 Exploration of session with depth first traversal with CP=0.05
The Maximal trail which satisfies CP=0.05 are{S,1,2,3}, {S,1,3,4,E} and {S,1,3,5,E}, {S,1,3,E}, {S,2,3,4}, {S,2,3,5,E}. The algorithm supports to find the high probability trail path inorder to identify the frequent navigation path prediction.
4. EXPERIMENTAL RESULTS
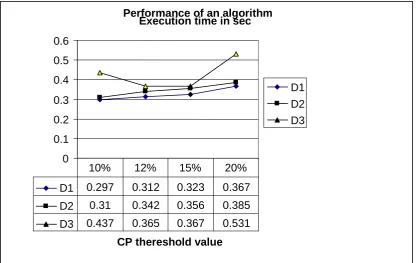
Table 4 shows three different dataset with page views 43, 81, and 155 respectively. The freq column depicts in table 4 gives number of occurrence of the pages. Experiment is
conducted on Data set with different CP such as 10%, 12%, 15% and 20%. Table 4 gives the high probability trail sequences which satisfy certain thereshold value. Figure 4 shows execution time of the algorithm with different data for
[image:5.595.92.471.92.348.2]different theresold value
Table 4 Session Data set and frequency
D1 Freq D2 freq D3 freq
S,1,2,3,4,E S,1,3,5,E
S,1,3,4,E S,2,3,4,E S,4,E S,2,3,E
2 4 2 3 6 2
S12345E S345E S2345E S1234E S1235E S134E S235E
3 4 5 2 2 1 1
S13678E S142578E S124678E S12478E S2468E S2578E S24678E
Figure 4 Performance of the algorithm with different data sizes and different Cut Point
5.
CONCLUSION
Several authors have been discussed the problem of mining web usage patterns from log data. Patterns inferred from past user navigation behavior in a site are useful to provide insight on how to improve the web site design’s structure and to enable a user to prefetch web pages that he is likely to download. In this work we have proposed to model users’ navigation records inferred from log data, as a Markov model and an algorithm scans the model in depth first search manner in order to find the higher probability trails which correspond to the users’ preferred web navigation trails. The resultant trail is given in table 4.1 also the graph 4.1 shows performance of the algorithm with various data sets. The graph shows that the performance of algorithm with a execution time factor. The result shoes that the execution time is increased when the size of session data as well as thereshold value is increased.
6. REFERENCES
[1] Bettina Berent, Bamshad Mobasher, “Myra Spiliopoulou, and Jim Wiltshire. Measuring the accuracy of sessionizers for web usage analysis.” In Proceedings of the Web Mining Workshop at the First SIAM International Conference on Data Mining, pages 7–14, Chicago, April 2001
[2] M. Eirinaki, M. Vazirgiannis , “Web Path Recommendations based on Page Ranking and Markov Models”, Proceedings on 7th ACM International Workshop Web Information and Data Management (WIDM ’05), pp. 2-9, 2005
[3] J. Borges and M. Levene, “An Average Linear Time Algorithm for Web Usage Mining”, Int’l journal Information Technology and decision Making , Vol. 3, no. 2, pp. 307-319, June 2004.
[4] Jos´e Borges and Mark Levene. “Data mining of user navigation patterns.”, In Brij Masand and Myra Spliliopoulou, editors, Web Usage Analysis and User Profiling, Lecture Notes in Artificial Intelligence (LNAI 1836), pages 92–111. Springer Verlag, Berlin, 2000. [5] Jose Borges and Mark Levene, “Evaluating
Variable-Length Markov Chain Models for Analysis of User Web Navigation Sessions”, IEEE Transactions on Knowledge and Data Engineering, Vol 19, No 4, April 2007. [6] R. Sarukkai. “Link prediction and path analysis using
markov chains”, in Computer Networks, Vol. 33, No. 1, June 2000, pp. 377-386.
[7] M. Spiliopoulou and C. Pohle. “Data mining for measuring and improving the success of web sites”. Data Mining and Knowledge Discovery, 5:85–114, 2001.