KNN Technique for Analysis and Prediction of
Temperature and Humidity Data
Sagar S. Badhiye
Asst. Prof., Department of CT, YCCE, Nagpur,
Nilesh U. Sambhe
Asst. Prof., Department of CT, YCCE, Nagpur
P. N. Chatur,
PhD.
Head, Department of CSE, GCOE, Amravati
ABSTRACT
The research investigates the data mining technique K-Nearest Neighbor resulting in a predictor for numerical series. The series experimented with come from the climatic data usually hard to forecast due to uncertainty.
One approach of prediction is to spot patterns in the past, when it is known in advance what followed them and verify it on more recent data. If a pattern is followed by the same outcome frequently enough, it can be concluded that it is a genuine relationship. Because this approach does not assume any special knowledge or form of the regularities, the method is quite general applicable to other series not just climate.
The research searches for an automated pattern spotting, it involves data mining technique K-Nearest Neighbor for prediction of temperature and humidity data for a specific region. The results of the research for temperature and humidity prediction by K-Nearest Neighbor were satisfactory as it is assumed that no forecasting technique can be 100 % accurate in prediction
.
Keywords
Data Mining, K-Nearest Neighbor, Numerical Series.
1.
INTRODUCTION
As computers, sensors and information distribution channels propagate; there is an increasing flood of data [1]. However, the data is of little use, unless it is analyzed and exploited. There is indeed little use in just gathering the tell tale signals of a volcano eruption, heart attack, or a stock exchange crash, unless they are recognized and acted upon in advance. This is where prediction steps in.
To be effective, a prediction system requires good input data, good pattern-spotting ability, and good discovered pattern evaluation, among other. The input data needs to be preprocessed, perhaps enhanced by a domain expert knowledge [2].
The prediction algorithms can be provided by methods from statistics, machine learning, and analysis of dynamical systems, together known as data mining concerned with extracting useful information from raw data, and predictions need to be carefully evaluated to see if they fulfill criteria of significance, novelty, usefulness etc. In other words,
prediction is not an ad hoc procedure [3]. It is a process involving a number of premeditated steps and domains, all of which influence the quality of the outcome.
The process is far from automatic. A particular prediction task requires experimentation to assess what works best. Part of the assessment comes from intelligent but to some extent artful exploratory data analysis. If the task is poorly addressed by existing methods, the exploration might lead to a new algorithm development.
This research work describes how a data mining technique, “K-Nearest Neighbor (KNN)” is used to develop a system that uses numeric historical data to forecast the climate of a specific region, city. K-Nearest Neighbor (KNN) [4] which is based on Euclidian Distance formula is used to find the hidden patterns inside the large dataset so as to transfer the retrieved information into usable knowledge for prediction of temperature and humidity values and classifying climate condition as Hot, Warm or Cold based on the predicted values. Classification task try to classify the data records into three classes Hot (temperature is higher than 23°C), Warm (between 16°C and 23°C) or Cold (bellow 16°C) [5].
2.
MATERIALS AND METHODS
2.1
The Dataset
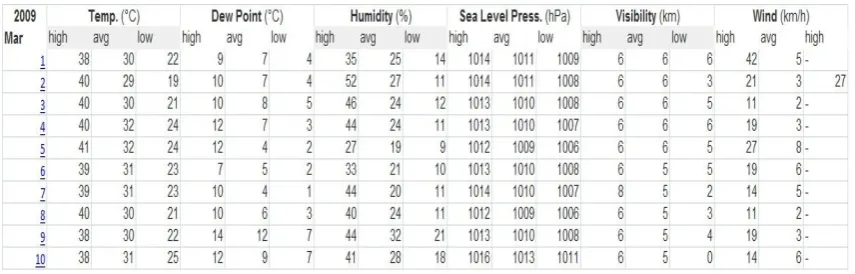
The most important part while implementing any data related project is collection of proper data for the analysis using any technique (eg. Data Mining). To test the algorithms in this research work, huge amount temperature and humidity data was required for large number of days or years. Hence, the dataset for duration of three years was collected from the following website.
http://www.wunderground.com/history/airport/VANP/2011/10 /17/DailyHistory.html
Main aspects of the data:
International Journal of Computer Applications (0975 – 8887) Volume 61– No.14, January 2013
Fig. 1 Sample Dataset
2.2
Aggregation, Converting the Raw Data
The algorithm in this research work takes monthly temperature and humidity data as input. The data is available in excel format and for analysis of temperature and humidity variation throughout the year the monthly data need to be aggregated in one file. After aggregations three matrices for the year 2009, 2010 and 2011 was formed. Each column of the matrix represents the date (day of month/year), temperature and humidity on a particular day, whereas row consists of its values.
For purpose of temperature and humidity prediction only these parameters data is required from the raw dataset and hence these must be extracted. Thus, the temperature and humidity data for each month is extracted and stored in Matrix format named by the particular month. It is understood that the values of temperature or humidity in a particular month of a year will have maximum resemblance to its values of that particular month for any other year, hence twelve matrices are created for these data for each month of the year as Jan, Feb, Mar, Apr, May, Jun, Jul, Aug, Sept, Oct, Nov and Dec, these consists of temperature and humidity data of that respective month for the complete duration of three years 2009, 2010 and 2011. Data for more years can be added to this. These dataset matrices are then used for prediction of temperature and humidity.
2.3
Implementing K-Nearest Neighbor for
temperature and humidity prediction
Input:
dataMatrix // Candidate trace data matrix for a particular month for duration of 3 years (2009, 2010, 2011)
queryMatrix // Reference trace data matrix consists of data for previous 3 days to the day of prediction
K // Number of neighbors, K=4 in this research work.
Output:
mtP[4] // Predicted Temperature values for 4 days
mhP[4] // Predicted Humidity values for 4 days
KNN Algorithm: // Algorithm to predict temperature and humidity
Step 1: Initialize variables
numDataVectors = size of dataMatrix
numQueryVectors = size of queryMatrix
Step 2: Initialize For i = 1 to numQueryVectors
Calculate Euclidian Distance.
Sort Euclidian Distances and neighborIds in ascending order.
Calculate
NeighborDistance(i) = sqrt(sortval(i to k))
End for loop
Step 3: Initialize i = 1 to 3
Initialize i = 1 to 4
tP (i, j) = dataMatrix(2)
hP (i, j) = dataMatrix(3)
end loop
end loop
Step 4: Calculate predicted temperature and humidity
mtP = tP/3
mhP = hP/3
return predicted temperature and humidity.
Step 5: Exit
2.4
Working of KNN Algorithm
Fig. 2 shows the working of KNN algorithm for temperature and humidity prediction.
Fig. 2(a) shows two matrices the dataMatrix and the queryMatrix the first consists of data of temperature and humidity three years for the month whose prediction is to be made for example, if prediction is to be made for 28-2-2012 then dataMatrix consists of temperature and humidity values for month of February for year 2009, 2010 and 2011, 2012, size of matrix so formed is 113 x 2. The queryMatrix consists of temperature and humidity values for 25-2-2012, 26-2-2012 and 27-2-2012. The KNN algorithm calculate four nearest neighbor for temperature and humidity data for each day of the queryMatrix the index of all these neighbors for each day is shown in neighbors matrix in Fig. 2(b) and the Euclidian Distance is shown in Dist matrix in Fig. 2(c) the rows in Dist matrix indicates the ith day in the queryMatrix and ith column
Fig. 2 Working of KNN Algorithm
Fig. 2(d) and (e) shows the temperature and humidity values from the dataMatrix for the index obtained in neighbors matrix. The average values of ith column in tP and hP matrix gives the predicted values for temperature and humidity for the ith day. Fig. 2(e) shows the predicted values for temperature and humidity for four days i.e. 28-2-2012 to 2-3-2012. The mean square error was calculated for the above prediction it was
found to be 0.143 for temperature prediction and 3.601 for humidity prediction.
3.
RESULTS
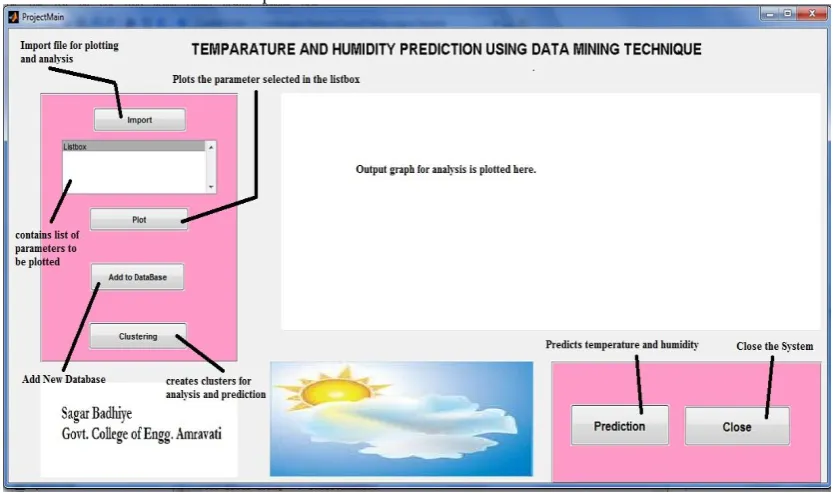
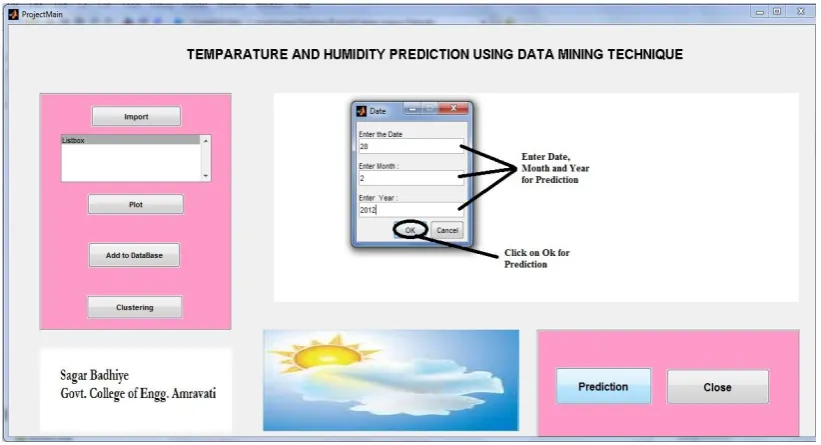
Fig. 3 shows the graphical user interface of the temperature and humidity prediction system using data mining.
[image:3.595.89.506.497.743.2]International Journal of Computer Applications (0975 – 8887) Volume 61– No.14, January 2013
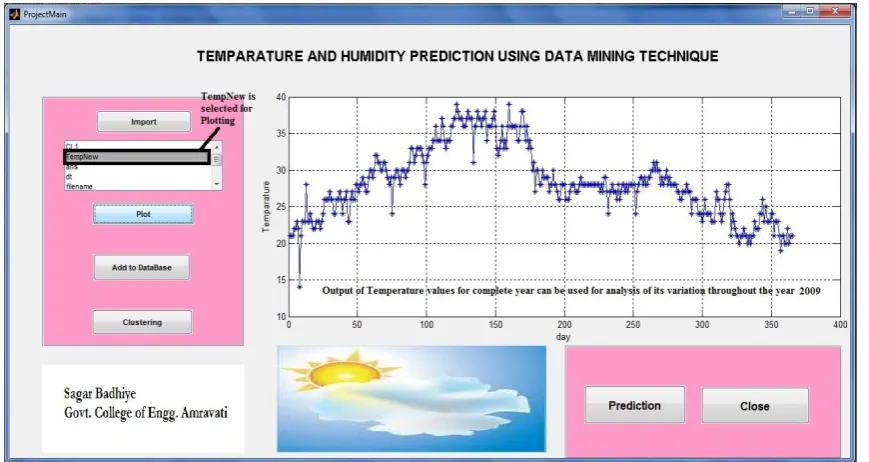
Fig. 4 Plotted Graph for Temperature Analysis for the year 2009
3.1
Temperature and Humidity Analysis
Fig. 4 shows the plotted output for temperature data for the complete year 2009 which shows the variation in temperature throughout the year. Similarly, graphs for various years for temperature and humidity can be plotted. The graphs can also be plotted for monthly data. Thus the plotted graphs can be used by the analysts and researchers for their research. For example, the graph shows that temperature in Nagpur was highest during the days 100 to 165 of the year 2009 i.e. for the months from 2nd week of April to 2nd week of June after which temperature falls down.
3.2
Adding new files
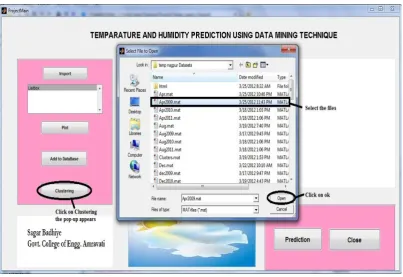
The database needs to be updated all the time and hence new files can be added to the database by clicking on the ‘Add to Database’ button and then the database can be used for analysis. Fig. 5 and Fig. 6 show the procedure for adding files to database.
[image:4.595.90.509.457.706.2]The database for the month of February 2012 was added to the database as shown in Fig. 5.
Fig. 6 Pop-up Window showing message that ‘Data is added to Database’
3.3
Clustering
In this research work the datasets were divided in number of clusters based on the type of analysis required for that ‘Clustering’ button is used, Fig. 7 shows the procedure to create cluster for the month of April. The output of clustering forms a data matrix of size 90 X 3 which consists of date temperature and humidity values of April month for the years 2009, 2010
and 2011. The cluster formed is shown in Fig. 8. Twelve such clusters for each month from January to December are already created in the system based on three years dataset. In same way 38 clusters for all months from January 2009 to February 2012 was created and 6 cluster for temperature and humidity 2 for each year 2009, 2010 and 2011 was already stored in the database.
[image:5.595.97.501.403.680.2]International Journal of Computer Applications (0975 – 8887) Volume 61– No.14, January 2013
Fig. 8 Cluster for April Month
3.4
PREDICTION
Four days temperature and humidity was predicted using Temperature and Humidity Prediction System for which the date from where prediction is to be made for four days is to be entered in the pop-up window as shown in Fig. 9 an when ‘Ok’ button is clicked the predicted values for temperature and humidity appears in two pop-up window one showing output in graphical form with actual and predicted values plotted on the graph as shown in Fig. 10 and other showing the predicted
values of temperature and humidity for the four days as shown in Fig. 11. For the above prediction the Mean Square error was calculated and error of 0.143 was found for temperature and that of 3.601 for humidity. Predicting such values for number of samples it was found that the results of KNN for temperature prediction was better as compared to that of humidity prediction and accuracy between 88 % to 92 % was found for temperature prediction and between 85 % to 90 % for humidity prediction.
[image:6.595.93.504.473.695.2]Fig. 10 Temperature and Humidity Graph with Actual and Predicted values
Fig. 11 Predicted Values for Temperature and Humidity
4.
CONCLUSION
KNN can predict temperature and humidity with satisfying accuracy at times but at some other instance of time the accuracy of prediction reduces due to uncertain behavior of the climatic condition. It was observed in some instances that for humidity prediction the difference in predicted and actual values were more it can be due to the sudden change that occurs in humidity of atmosphere which is more frequent for humidity than as compared to that of temperature. Prediction of temperature and humidity was done for number of days and it was found that K-Nearest Neighbor produced satisfying results in terms of prediction of temperature and humidity with accuracy of 88% to 92% for temperature prediction and of 85% to 90% for humidity prediction. The results obtained were satisfying as it is assumed that no forecasting system can be 100 % accurate due to uncertainty of climatic parameters.
5.
FUTURE SCOPE
At present the system is able to predict temperature and humidity data for four days by using K-Nearest Neighbor algorithm with
satisfying accuracy of prediction. In future the following things can be implemented in this research:
Adding other climatic parameters such as dew point, pressure, light intensity etc for prediction and increasing the duration of prediction.
Using larger units of analysis i.e. analyzing the results of prediction of K-Nearest Neighbor on dataset of number of other cities or places.
Providing Signal analysis tools for automatic analysis of variation in the pattern of temperature and humidity data and validating resulting output patterns to researchers.
i. KNN can be combined with some other techniques such as Fuzzy Logic which can increase the accuracy of prediction. ii. The software could be embedded with hardware and used as a complete unit of prediction. Additional feature helpful to farmers can be implemented such as prediction of type of crop that should be planted base on the predicted value of atmospheric parameters.
6.
REFERENCES
[1] Larose D. T.: Discovering Knowledge in Data: An Introduction to Data Mining, Wiley, Chichester 2005
[2] S. Kotsiantis and et. al., “Using Data Mining Techniques for Estimating Minimum, Maximum and Average Daily Temperature Values”, World Academy of Science, Engineering and Technology 2007 pp. 450-454
[3] Han J., Kamber M.: Data Mining concepts and Techniques, Elsevier Science and Technology, Amsterdam 2006
[4] Cover T, Hart P (1967) “Nearest neighbor pattern classification”. IEEE Trans Inform Theory Volume 13(1) pp. 21–27
[image:7.595.78.268.309.514.2]