Active Labour Market Programmes and
Poverty Dynamics in Ireland
Halpin, Brendan and Hill, John
University of Limerick
August 2008
Online at
https://mpra.ub.uni-muenchen.de/10335/
and
Poverty Dynamics in Ireland
Dr Brendan Halpin Department of Sociology University of Limerick, Ireland
Email: [email protected]
and
Mr John Hill
Department of Economics University of Limerick, Ireland
Email: [email protected]
RESEARCH WORKING PAPER 08/05
ISBN: 978-1-905485-61-1
We gratefully acknowledge the support of the Combat Poverty Agency, who
funded this work under their Poverty Research Initiative 2005. The paper has
benefitted from comments of participants at the Combat Poverty Agency
Research Seminar, 23 May 2006, and from Philip O’Connell and Richard Layte,
Abstract
Active Labour Market Policies (ALMPs), which provide training and subsidised
employment to the unemployed, are an important part of Ireland’s welfare state.
While a good deal of existing research is concerned with the effect of these
policies on employment chances and on wage rates, none addresses the
connection between poverty and ALMPs. Do these policies have an effect on
poverty? That is, first, to what extent do these policies serve the low-income
population, as a consequence of and in addition to their focus on those in
precarious labour market situations? Second, to what extent do these policies
function to lift people out of poverty in the medium term?
To address these issues we use longitudinal data from the Living in Ireland
Survey (1994–2001) and examine how the respondents’ situation in one year
predicts participation in employment and training schemes in the next year, and
then how participation in these schemes affects poverty status in the following
year. Participants on both sorts of schemes are much poorer than the population
average, and those on employment schemes (but not training schemes) are
even poorer than one would expect given their observed characteristics.
Employment schemes and training schemes serve different purposes and
different populations. A conventional logistic regression analysis seems to
suggest that employment schemes (but not training schemes) positively increase
the risk of poverty in the following year. This finding is not considered reliable,
but rather it reflects the selection processes whereby those on employment
schemes are in particularly vulnerable situations, in respects that are not picked
up in the data set. A more rigorous analysis, using propensity score matching,
reveals that employment schemes are neutral on poverty risk. Training schemes
have a weak but insignificant protective effect.
Considering the risk of poverty approximately one year after participation begins,
a mechanism for immediately exiting poverty. We add the caveat that it may be
desirable to consider outcomes two or more years into the future, were data
available, and that other outcome measures of quality of life should also be
taken into account. Ultimately, with regard to both labour market and poverty
outcomes, we find no evidence that participants of training schemes or
employment schemes have either raised their employment chances or reduced
their risk of poverty in the year following their participation.
Keywords: active labour market programmes; propensity score matching;
employment policy
Disclaimer: This report was funded by the Combat Poverty Agency under its
Poverty Research Initiative. The views, opinions, findings, conclusions and/or
recommendations expressed here are strictly those of the authors. They do not
necessarily reflect the views of the Combat Poverty Agency which takes no
responsibility for any errors or omissions in, or for the accuracy of, the
information contained in this Working Paper. It is presented to inform and
stimulate wider debate among the policy community and among academics and
1 Introduction 9
2 Background 12
2.1 Origin of active labour market policy . . . 13
2.2 Emergence of active labour market policy in Ireland . . . 14
2.3 The emergence of F ´AS . . . 15
2.4 Flavours of active labour market policies . . . 16
2.5 Irish labour market in context . . . 18
2.6 Participation and throughput. . . 20
2.7 Expenditure commitment and intensity . . . 21
3 Existing research on active labour market policies 25 3.1 Previous evaluations of micro effects . . . 26
3.2 Quasi-experimental approaches . . . 28
3.3 Evaluations of supply-side measures . . . 30
3.4 Evaluations of demand-side measures . . . 30
4 Methodology 31 4.1 Living in Ireland Survey . . . 31
4.1.1 Longitudinal perspective . . . 31
4.1.2 Poverty dynamics from the Living in Ireland Survey . . . 32
4.1.3 Observing exposure to active labour market programmes . 36 4.2 Medium-term outcome focus . . . 37
4.3 Two analytical passes – descriptive and ‘pseudo-experimental’ . . 38
4.4 Propensity score analysis . . . 40
5 Descriptive analysis 46 5.1 Poverty and participation rates . . . 46
5.2 Do schemes ‘target’ the poor? . . . 49
5.3 Do schemes have an effect on medium-term risk of poverty? . . . 54
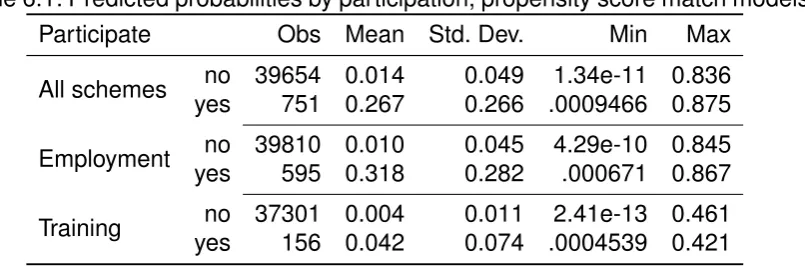
6 Propensity score matching analysis 58
6.1 Carrying out the matching . . . 58
6.2 Results . . . 59
7 Conclusion 64
Bibliography 70
2.1 Typology of ALMP . . . 17
2.2 Labour force trends. . . 19
2.3 Indicative table of ALMP participation, 1983–2002 . . . 20
2.4 Scale of ALMP participation, 1983–2002 . . . 23
4.1 Equivalised household income and poverty by wave, 1994–2001 (weighted LIS data) . . . 33
4.2 Exposure to poverty over eight waves: number of times below 60 per cent of median . . . 35
4.3 Year-on-year relative income transitions . . . 35
4.4 Observed participation in ALMP schemes at time of interview, 1995– 2000 . . . 37
5.1 Predictors of participation in employment schemes, training schemes and all schemes, weighted data, pooled across years . . . 47
5.2 Logistic regressions predicting participation in schemes in year t, using covariates measured in yeart −1. . . . . 51
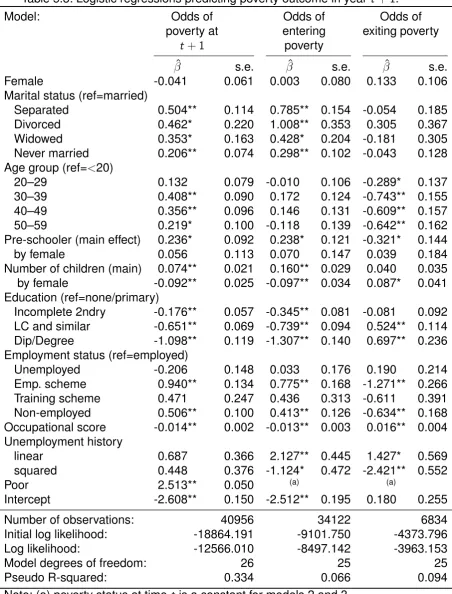
5.3 Logistic regressions predicting poverty outcome in year t+ 1. . . . 55
6.1 Predicted probabilities by participation, propensity score match mod-els . . . 59
6.2 Results of the PS matching analysis . . . 60
2.1 (a) ALMP expenditure relative to GDP; (b) ALMP expenditure
rel-ative to total public social expenditure; (c) ALMP expenditure per
registered unemployed as a percentage of average production wage.
Source: OECD (1994), OECD (various), ILO (Laborsta). . . 22
Abbreviations
ALMP Active Labour Market Policy
ESRI The Economic and Social Research Institute
EU European Union
F ´AS Foras ´Aiseanna Saothair
GDP Gross Domestic Product
ISEI International Socio-Economic Index
LFS Labour Force Surveys
LIS Living in Ireland Survey
LTU Long-term unemployment
NN Nearest Neighbours
OECD Organisation for Economic Cooperation and Development
Ireland is usually characterised as aliberal welfare state in the Esping-Andersen
sense, aligned with the United Kingdom and (at the end of the continuum) the
United States, providing a minimalist and means-tested safety net
(Esping-Andersen,1990,1999). In many respects this is fair, but in certain
respects Ireland deviates significantly from the liberal model. One respect is the
relative importance of Active Labour Market Policies (ALMPs), that is, policies
that focus on improving the situation of the unemployed and lower-skilled
workers by training and subsidy. In levels of both expenditure and institutional
commitment to ALMPs, Irish practice has tended towards the higher end of the
scale, average to above average in Organisation for Economic Cooperation and
Development (OECD) and European Union (EU) contexts, and substantially
higher than the UK.
Active labour market policies are intended to have effects at a number of levels,
including macro-economic, redistributional and individual. Existing research has
focused largely on the effects of programmes on medium-term employment
status, a justifiable concern with the individual labour market outcome. If
beneficial labour market effects cannot be observed at the individual level, it is
hard to argue that programmes could have macro-economic or redistributional
effects. In this research we retain the focus on individual outcomes, but rather
than assess direct labour market effects, we take a redistributional perspective.
We ask two distinct but closely related questions:
• To what extent do ALMPs target ‘poor’ households?
• To what extent do ALMPs have positive consequences for household
poverty status in the medium term?
employability of workers, it is also the case that their social consequences
should be to ameliorate the situation of some of the more vulnerable members of
society. An important question to ask, therefore, is whether those to whom ALMP
opportunities are made available are indeed among the more deprived. Can we
consider ALMPs to bede facto anti-poverty policies, or perhaps those who
benefit are not those most in need, but rather those most in a position to benefit?
The second question is closely related but looks at consequences rather than
selection: given participation in an ALMP scheme, is there any evidence of
protection from poverty in the medium term? This is closely related to the issue
of beneficial labour market effects, but imposes an additional condition that such
changes also have the effect of reducing the risk of poverty below what it would
otherwise be.
Poverty, defined in terms of equivalised household income, is affected by more
factors than a single adult’s employment situation. We can realisitically expect
that the measured effect of participation in ALMP schemes on subsequent
household poverty will be open to more imprecision than the more direct effect
on employment outcomes or on individual income. Variability in post-treatment
household income additional to that due to participation will arise from
simultaneous changes in the labour market situation of other household
members and from change in the household structure. The explicit motivation of
this research is, however, to address the relationship between active labour
market policy and poverty – answering the twin questions of whether ALMP
schemes serve those in poverty, and whether they equip them sufficiently to
escape it. Notwithstanding this, we also report employment status outcomes as
they are instrumental to understanding changes in poverty status.
In what follows we first outline the background to active labour market policy and
the history of its development in Ireland (section2), and then present a summary
a series of empirical analyses using the Living in Ireland household panel
survey, to address our twin research questions (sections4to6). The empirical
analysis combines more conventional descriptive methods with a
‘pseudo-experimental’ propensity score matching technique which is intended to
give a less biased estimate of the effect of participation in ALMP schemes on the
Active labour market policy is a heterogeneous mix of supply and demand-side
policy. On the supply side ALMP schemes are responsible for training and
retraining the unemployed, and may assist in matching candidates to vacancies
through the public employment service. On the demand side, ALMPs may
involve employment subsidies to firms or even direct employment creation.
The fundamental goal of all ALMP is to reduce the number of people in
open/passive unemployment. If training authorities respond quickly to changes
in the composition of the labour market and tailor programmes to meet employer
needs, specific skills training may address structural unemployment. Similarly,
general training may bring into the labour force those who, for a variety of
reasons, maintained only a tangential connection to the formal education
system. Without the intervention of adult education, even in the form of general
skills training, these people may be at risk of entering long-term unemployment.
TheOECD(2000, p.176) have set out seven distinct objectives of an active
labour market policy:
1. Job creation, either to reduce the number of registered unemployed in the
short-run or to generate jobs persisting beyond the period of intervention,
such as jobs in the social economy
2. Job redistribution, to re-order for equity reasons the job-seekers’ ranks and
to give the long-term unemployed a chance to enter into jobs which would
otherwise be offered to others, and thereby maintain an attachment to the
labour market for groups at risk
3. Skill and human capital acquisition, which may not lead to a job
immediately but enhances the employability and productivity of the
4. Attitudinal changes, combating the discouragement and alienation of job
seekers, enhancing their motivation and willingness to work; but also
encouraging employers to recruit and overcome prejudices and
stigmatisation
5. Increase of earnings, either in the long- or short-run; combating poverty
and unemployment traps, particularly in low-wage and low-skill segments
of the labour market
6. Macro-economic objectives, such as increasing the potential labour supply,
and reducing structural unemployment without increasing wage push
inflation
7. Addressing wider social objectives, such as promoting health, combating
criminality and enhancing the social cohesiveness of communities.
2.1
Origin of active labour market policy
The notion of an ‘active’ labour market policy came to the fore in the 1970s as
high inflation beset many of the world’s industrial economies, including Ireland.
Two Swedish economists, G ¨osta Rehn and Rudolf Meidner, had successfully
brought inflation under control in Sweden using a double-edged approach of
labour retraining and solidaristic wage bargaining. The former ensured a ready
supply of skilled labour, while the latter forced inefficient and under-performing
firms out of business. Rehn and Meidner’s work influenced OECD thinking and
was formalised as ‘manpower planning’ by the late 1970s. While
Esping-Anderson(1985) classifies these measures as macro-economic tools to
counter rising inflation (and not as a response to widespread unemployment),
both inflation and unemployment are known to be heavily interdependent.
In essence, manpower planning ensured that firms had an adequate pool of
skilled labour to draw from, while also retraining the unemployed and returning
them to work. It followed that retraining would facilitate structural change and
Outside of Sweden, ALMP was embraced as a possible solution to high levels of
unemployment and coincided with the recognition of long-term unemployment as
a distinct focus for concern. The shift from passively supporting the unemployed
(i.e. through social welfare) to activation reflected an extension of the strongly
interventionist Keynesian paradigm of the time.
2.2
Emergence of active labour market policy in Ireland
O’Connell and McGinnity(1997b) characterise Irish labour market policies
during the 1960s and 1970s as mainly confined to the organisation of
apprenticeship training and to matching supply and demand for labour. These
policies were in-line with the OECD’s ‘manpower policy’ aimed at achieving full
employment and strong growth. However, with the onset of high unemployment
and low growth in the 1970s, governments embraced the Swedish example by
adopting a variety of active labour market policies. These included employment
subsidies, training schemes and temporary public job creation schemes. From
1975, the Youth Training Programme, the Premium Employment Programme and
the Employment Incentive Scheme were all introduced. In 1976 the Environment
Improvement Scheme, the Temporary Grant Scheme for Youth Employment
(Teamwork) and Community Workshops all targeted the phenomenon of youth
unemployment. From 1987 onwards, the bulk of ALMP schemes were organised
under the auspices of Foras ´Aiseanna Saothair (F ´AS), the public employment
service agency.
According toO’Connell and McGinnity (1997b), by the 1980s ALMPs had taken
centre-stage in the government’s response to mass unemployment. However, it
was a commonly held view that unemployment was a transitory phenomenon.
Emphasis was placed on demand-side measures to generate new employment
places, while retraining schemes frequently focused on finding employment for
the (relatively) most employable candidates – to the neglect of the most
2.3
The emergence of F ´
AS
F ´AS, Ireland’s statutory training and employment authority, arose from the
amalgamation of three agencies, of AnCo, the National Manpower Service and
the Youth Employment Authority, under the Labour Services Act of 1987. The
Act was silent on the rationale and organisational structure of F ´AS, failing from
its inception to echo the ‘pre-emptive social democratic paradigm’ of its
preceding White paper. The bringing together of all three agencies under the
F ´AS umbrella sought to address inter-agency conflict and tacitly accepted the
failure of each organisation to address record levels of unemployment.
A major reorganisation of activities within F ´AS occurred in response to the 1992
Culliton Report. Culliton, though supportive of the role of F ´AS in labour market
activation, questioned if the agency’s multiple goals could be better achieved by
creating separate divisions for training the unemployed, vocational training, and
industry-based training. What followed from these reforms were organisational
slimming and beefed-up regional directors.Boyle(2005, p.38) identified the
following post-reform characteristics of F ´AS:
1. Multi-functional and multi-tasked
2. Largely autonomous of department officials, but connected to key
politicians
3. Heavily regionalised with a small, low-cost centre
4. Representative, non-executive board with a powerful director-general
position
5. Loosely coordinated at the centre, but with substantial autonomy from
assistant-director down
6. Programmatic, not client-centred; focused on spending large programmatic
budgets
7. Mix of in-house and out-sourced service provision for various functions
8. Fiscally opportunistic as it avoided long-term staff commitments and
9. Cheap and retractable with low organisational fixed costs.
F ´AS fended off repeated calls for a severing of the organisation along functional
lines: including from the Task Force on Long-Term Unemployment (1994–1995)
and again from the 1997 White Paper on Human Resource Development.
Drawing much of its programmatic funding directly from European Structural
Funds afforded F ´AS a large measure of independence from the Department of
Finance.
2.4
Flavours of active labour market policies
The constituency of ALMP is diverse. Specific skills training and apprenticeships
may help those who received a formal school education and who now wish to
specialise; whereas general training provides basic workplace skills to those
who have been out of the labour force for some time, or to those who did not
benefit from formal schooling to certificate level. Finally, direct employment
schemes and employment subsidies may redress skills and human capital
depreciation incurred by the long-term unemployed during their absence from
the labour market. A summary table of training and employment schemes is
included in Appendix One.
ALMPs are conventionally classified into five broad categories:
1. Public employment services: including information, placement and
counselling services for the unemployed
2. Labour market training: including measures to enhance the skills of both
employed and unemployed
3. Youth measures: including training, work experience and apprenticeships
4. Subsidised employment: including direct job creation measures as well as
subsidies towards private sector recruitment and/or self-employment
Table 2.1: Typology of ALMP
Market orientation
Labour market leverage Weak Strong
Supply General training Specific skills training
Demand Direct employment schemes Employment subsidies
O’Connell and McGinnity(1997b) derived the following typology of ALMPs
based on the conventional classifications (see Table2.1):
General training Programmes in this category provide basic/foundational skills
and are designed for those with poor educational qualifications. They
include programmes for second-chance education, for women returning to
work after child rearing, for long-term unemployed males, for young
school-leavers, for people with disabilities, and may also offer training to
develop community resources. Unlike vocational training which enhances
employability by teaching specific skills, general training teaches general
subjects often covered during second-level schooling.
Specific skills training The courses are designed to meet specific skills needs
in the economy and are usually targeted at specific industries and
occupations. An example is specific skills training as operated by F ´AS,
where the level of training is typically more advanced than that of general
training.
Direct employment schemes These programmes consist of subsidised
temporary employment in the public or voluntary sectors – which O’Connell
and McGinnity(1997b, p.20) term a ‘variant of conventional public works
programmes’. While direct employment schemes may indeed lead to the
provision of public goods/services, their over-riding purpose is that of
employment generation. In Ireland, Community Employment is the largest
direct employment scheme. Community Employment, which replaced the
Social Employment Scheme in 1994, is targeted at the long-term
Employment subsidies These are subsidies to the recruitment or
self-employment of unemployed workers in the private sector. They may be
paid to either employer or employee; and are designed to ‘offset the
relative unattractiveness’ of a long-term unemployed candidate (O’Connell
and McGinnity,1997b, p.21). The subsidy may be seen as compensation
for the greater costs of recruiting and training the long-term unemployed.
The subsidy consists of a lump-sum payable on recruitment and continuing
payment and/or exemptions from social insurance contributions. The Back
to Work Allowance, launched in 1993, is paid directly to employees. Among
those paid to employers are the Employment Incentive Scheme
(1977–1994) and the Employment Subsidy Scheme (1992–1993).
2.5
Irish labour market in context
Large-scale unemployment beset the Irish economy in the early 1980s. In the
first half of that decade unemployment more than doubled, rising from 7 to
17 per cent in five years. Some 226,000 people were registered unemployed in
1985 and in receipt of social welfare payments. Subsequent analysis would
place the blame for Ireland’s unemployment crisis directly at the door of the
government. In particular, high levels of personal taxation eroded the reward for
work and reduced the incentive for potential job seekers.
High unemployment was far from a passing phenomenon, and levels of
unemployment twice the OECD average persisted for another ten years after
1985. With an average of 15 per cent of the labour force out of work during this
decade, the corresponding problem of long-term unemployment also worsened.
Long-term unemployment (LTU) refers to a cohort of the unemployed who have
been out of work for one year or more. Rates of long-term unemployment were
already high in Ireland, with three-fifths of all those unemployed in 1985 having
been out of work for more than a year. Combined with an increasing number of
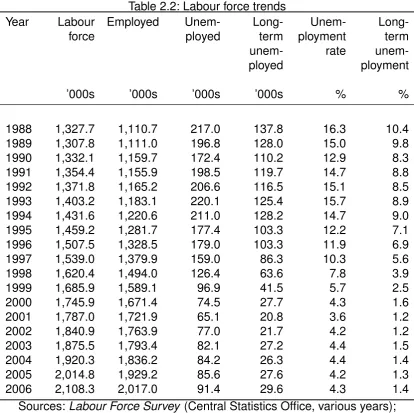
Table 2.2: Labour force trends Year Labour force Employed Unem-ployed Long-term unem-ployed Unem-ployment rate Long-term unem-ployment
’000s ’000s ’000s ’000s % %
1988 1,327.7 1,110.7 217.0 137.8 16.3 10.4
1989 1,307.8 1,111.0 196.8 128.0 15.0 9.8
1990 1,332.1 1,159.7 172.4 110.2 12.9 8.3
1991 1,354.4 1,155.9 198.5 119.7 14.7 8.8
1992 1,371.8 1,165.2 206.6 116.5 15.1 8.5
1993 1,403.2 1,183.1 220.1 125.4 15.7 8.9
1994 1,431.6 1,220.6 211.0 128.2 14.7 9.0
1995 1,459.2 1,281.7 177.4 103.3 12.2 7.1
1996 1,507.5 1,328.5 179.0 103.3 11.9 6.9
1997 1,539.0 1,379.9 159.0 86.3 10.3 5.6
1998 1,620.4 1,494.0 126.4 63.6 7.8 3.9
1999 1,685.9 1,589.1 96.9 41.5 5.7 2.5
2000 1,745.9 1,671.4 74.5 27.7 4.3 1.6
2001 1,787.0 1,721.9 65.1 20.8 3.6 1.2
2002 1,840.9 1,763.9 77.0 21.7 4.2 1.2
2003 1,875.5 1,793.4 82.1 27.2 4.4 1.5
2004 1,920.3 1,836.2 84.2 26.3 4.4 1.4
2005 2,014.8 1,929.2 85.6 27.6 4.2 1.3
2006 2,108.3 2,017.0 91.4 29.6 4.3 1.4
Sources:Labour Force Survey (Central Statistics Office, various years);
Quarterly National Household Survey (Central Statistics Office, various years).
11 per cent of the labour force by the mid- to late-1980s (see Table2.2).
By any measure, Ireland’s problem was significant. Not only were levels of
unemployment high, but outflows to new jobs (exits from unemployment) were
low. Because of this, people’s attachment to the labour force became weakened
as they spent long periods out of work. Tackling LTU became a priority for
government. While the government may have hoped to remedy unemployment
through sound macro-economic management and economic growth, the profile
of those long-term unemployed was complicated by inertia. It was widely
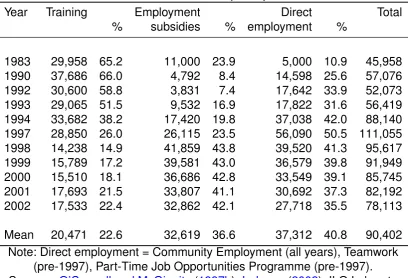
Table 2.3: Indicative table of ALMP participation, 1983–2002
Year Training Employment Direct Total
% subsidies % employment %
1983 29,958 65.2 11,000 23.9 5,000 10.9 45,958
1990 37,686 66.0 4,792 8.4 14,598 25.6 57,076
1992 30,600 58.8 3,831 7.4 17,642 33.9 52,073
1993 29,065 51.5 9,532 16.9 17,822 31.6 56,419
1994 33,682 38.2 17,420 19.8 37,038 42.0 88,140
1997 28,850 26.0 26,115 23.5 56,090 50.5 111,055
1998 14,238 14.9 41,859 43.8 39,520 41.3 95,617
1999 15,789 17.2 39,581 43.0 36,579 39.8 91,949
2000 15,510 18.1 36,686 42.8 33,549 39.1 85,745
2001 17,693 21.5 33,807 41.1 30,692 37.3 82,192
2002 17,533 22.4 32,862 42.1 27,718 35.5 78,113
Mean 20,471 22.6 32,619 36.6 37,312 40.8 90,402
Note: Direct employment = Community Employment (all years), Teamwork (pre-1997), Part-Time Job Opportunities Programme (pre-1997). Sources:O’Connell and McGinnity(1997b),Indecon(2002), ILO Laborsta
Database.
complex, potentially independent of improvements in the macro-economy and
unlikely to be resolved by a tightening of the labour market alone. With this in
mind, the expansion of ALMP schemes, and in particular subsidised
employment, became a priority for public policy.
2.6
Participation and throughput
The pattern of expansion in ALMP participation (or throughput) is broadly
responsive to changes in the unemployment rate over time (see Table2.3). In
1983 overall participation stood at almost 46,000 – comprising 65 per cent
training, 24 per cent employment subsidies and 11 per cent direct employment.
Within seven years, overall numbers rose some 11,000, but more dramatic was
the change in the composition of ALMP schemes. Participation in training
remained at a constant 66 per cent, but employment subsidy schemes lost
Employment in 1994, the numbers engaged in direct employment schemes
continued to grow until it peaked at 56,090 in 1997. Employment subsidy
schemes, on the other hand, peaked at 41,859 (or 44 per cent of total
participation) in 1999, and remained only slightly below this level thereafter. After
1994, as the demand for labour started ramping up, the number in training
schemes began to fall, to a low of 14,250 in 1998.
Overall provision, which peaked at 111,055 in 1997, has fallen in response to a
general tightening of the labour market. In a visible reorientation of public policy
regarding ALMP schemes in 1998, participation in training was halved and direct
employment fell by some 6,500 places. This trend in the composition of ALMP
schemes was largely maintained up to 2002, with direct employment schemes
such as Community Employment shrinking to pre-1994 levels. By 2002 training
accounted for just one-fifth of all ALMP participation. The die has clearly been
cast in favour of subsidised employment schemes, with a supporting role for
training and an ever-decreasing allocation of places to direct-employment
schemes.
2.7
Expenditure commitment and intensity
When measured as a portion of Gross Domestic Product (GDP) Ireland has
always made a generous commitment to ALMP. In the period where data is
available from the OECD’s Social Expenditure Database (1985–2001), Ireland
typically spent 1.4 per cent of GDP on labour market programmes – consistently
above our European neighbours. The ratio of ALMP expenditure to GDP in these
countries has been a remarkably constant 0.9 per cent. The turnaround in
Ireland’s economic fortunes from the mid-1990s explains the dramatic decline in
the ratio of ALMP expenditure to GDP, as the latter began to soar with the
contribution of multinational firms.
.6 .8 1 1.2 1.4 1.6
1985 1990 1995 2000
year
Ireland EU15 Mean
4 6 8 10
1985 1990 1995 2000
year
Ireland EU15 Mean
10 20 30 40 50
%
1985 1990 1995 2000
Year
[image:24.595.159.443.88.682.2]Ireland EU15 Mean
Table 2.4: Scale of ALMP participation, 1983–2002
Year ALMP as a percentage
of labour force of unemployment
1983 3.5 25.1
1990 4.3 33.1
1992 3.8 25.2
1993 4.0 25.6
1994 6.2 41.8
1997 7.2 69.8
1998 5.9 75.6
1999 5.5 94.9
2000 4.9 115.1
2001 4.6 126.3
2002 4.2 101.4
Mean 5.5 89.3
Sources:O’Connell and McGinnity(1997b),Indecon(2002), ILO Laborsta Database.
expenditure (health, education etc), which has consistently been twice the
European average. The ratio peaked at 8 per cent of total public social
expenditure in 1995 (reflecting the expansion of places in subsidised
employment schemes such as Community Employment) but fell sharply
thereafter. Again, this reflects the reorientation of labour market policy and the
steady reduction in subsidised employment places.
The intensity of ALMP expenditure relative to European norms is highlighted by
Figure2.1(c). Here we show gross government expenditure on ALMP schemes
per head of registered unemployed.1We then express expenditure per head as
a ratio of the average production wage, which approximates the earnings of a
single male production worker.2During the dark days of double-digit
unemployment (mid-1980s to mid-1990s), government spending on ALMP
1A composite series of the total number unemployed, generated from Labour Force Surveys (LFSs) and augmented with local Employment Office Register data where LFS is missing (France: 1985–90, Official Esti-mates; Germany: no LFS data pre-1991; Luxembourg: Register Data Only; Netherlands: 1996 LFS missing; Portugal: 1998 LFS missing; UK: 1985/86 LFS taken from World Development Indicators).
schemesper capita unemployed was just half of the European average.
Expenditure intensity did not meet (or exceed) the EU15 average until the
reversal of fortune in the Irish labour market and the ensuing fall in
unemployment post 1998. The purpose of this illustration is to demonstrate that
while Ireland is often cited has having devoted significant resources to ALMP
schemes (relative to both GDP and public social expenditure), in reality the
intensity of this expenditure when expressed per capita unemployed, and relative
to the average production wage, falls far short of the European average for the
policies
While the social sciences offer a menu of ex-post theories justifying intervention
in the labour market,Webster(1997, p.4) dutifully reminds us that, ‘as a remedy
for idleness, labour market programmes have a longer tradition than formal
economic theory’. She dates the emergence of ‘modern’ unemployment to the
transition from agrarian feudalism to industrial capitalism, and points out that
sixteenth-century workhouses sought to achieve many of the same basic aims
as modern labour market policies (training, employment and a ‘moderated’
wage) – albeit with more coercion.
Two main schools of thought exist regarding labour market programmes. The
first school believe alaissez-faire/unchecked market is characterised by myopia,
uncertainty and imperfect information, and is incapable of producing
efficient/equitable outcomes in the absence of intervention. A cycle of poverty
may arise if individuals or groups are allowed to fall too far below socially
acceptable standards. In the words ofWebster(1997, p.9), ‘failure breeds failure.’
A second school – while acknowledging the desirability of alaissez-faire
self-clearing approach to labour market management – also accepts that, for
reasons of equity or social justice, the achievement of a purelylaissez-faire
solution may not be possible. Instead, interventions are justified where they
reduce the disincentives to work or train. In this liberal perspective, high taxes on
labour, high replacement rates and a high minimum wage are distortionary and
act to disincentivise work.
The theoretical pedigree of ALMPs has often been questioned, as many of its
advocates focus on policy objectives before ever advancing a textbook case for
macro-economic debate. Demand-side macro-economics tends to view the
unemployed as the tail-end of a homogenous labour queue, while labour market
programmes may rearrange this queue, they will not resolve the basic causes of
unemployment (Webster,1997). Supply-side macro-economists argue that
government intervention itself contributes to unemployment and should be
avoided. Notwithstanding this, ALMP has received rigorous attention in the work
ofLayard et al.(1991) andCalmfors and Lang(1995), and is summarised inHill
and Halpin(forthcoming).
Evaluations of the micro-economic (individual level) impact of labour market
policy typically examine supply- and demand-orientated policies separately.
Supply programmes aim to enhance the human capital (skills, employment
chances and potentially the earnings of participants), whereas demand-side
programmes act to reduce the price of labour by offering subsidies to employers,
in theory making it more attractive to hire eligible job-seekers. Demand-side
measures effectively ‘create’ new demand for labour through direct public
employment schemes.
3.1
Previous evaluations of micro effects
Denny et al.(2000) evaluated the employment and earnings outcomes of ALMP
participants against a group of non-participants over the period 1994–1996. A
treatment group of 1,473 respondents from a stratified sample of the 1996 F ´AS
Follow-up Survey was identified.1A corresponding control group was drawn from
the first two waves (1994/5) of the Living in Ireland Survey (LIS). Only persons
who were unemployed during the first wave of the LIS, and at risk of participating
in ALMP schemes, were admitted to the final control group of 558. Denny et al.’s
methodology involved a comparison of ALMP participants from the time they left
their programmes with a control group who remained in open-unemployment
and chose not to participate in ALMP schemes. This first step in establishing a
control group is based on employment status alone and does not take into
account other factors that may influence selection into labour market
programmes. Specifically, the control group in this study were (on average)
older, more likely to hold no qualification and more likely to have been
unemployed for two years or more.
When outcomes in 1996 are compared, ALMP participants where twice as likely
as the control group to have obtained employment. The same is true of
employment type, where ALMP ‘graduates’ are more than twice as likely to have
secured fulltime employment. Their report cautions of significant deviation in
employment outcomes between the varieties of ALMP scheme: recipients of
specific skills training were the most likely to secure employment (75 per cent),
followed closely by those whose employment was subsidised (70 per cent). The
progression to employment from general training was less significant (47 per
cent), while only 36 per cent of those engaged in direct employment progressed
to mainstream employment.
To obtain a more robust estimate of the differences in the effect of participation
accruing to both groups, it is necessary to take account of the difference in their
observable characteristics, such as age, sex, education and employment history.
Denny et al. (2000) fitted a logistic model of employment probabilities using the
LIS control group as a reference category. After controlling for observed
differences, they reported that the employment probabilities for participants in
three flavours of ALMP scheme (employment subsidy, specific skills training,
general training) are significant and positive (compared to the reference
category, or openly unemployed comparison group). Only those who completed
direct employment schemes showed no significant increase in employment
probabilities compared to the reference category. The effects of having a
secondary or tertiary education are positive and significant, while the effects of
being out of work for more than one or more than two years are negative and
Denny et al. conducted a final robustness test on their model to ensure that
unobserved latent characteristics (e.g. motivation, social networks) did not
influence the selection process. For example, if those engaging in ALMP
schemes had stronger social networks or better personal motivation at the
outset, this would lead us to seriously overestimate the positive contribution of
ALMP schemes to employment chances. Implementing a two-stage procedure
to model selection and outcomes separately, they reported no significant
correlation in the residuals of either model.O’Connell(2002) summarises:
‘specific skills training are shown to have substantially greater employment
chances than the comparison group, and indeed, than participants in the less
market-orientated general training programme.’
Applying the same methodology to estimate the earnings effect of participation,
Denny et al. repeated their finding of a significant positive effect of specific skills
training (SST) on earnings – though the effect on wages is overall weaker than
that reported for the probability of re-employment. Furthermore, by interacting
SST with sex, age and unemployment duration, they find that SST is most
effective at raising the earnings of women and of those over 25 years of age
(though neither is strongly significant). The authors found that the principal
impact of ALMP participation is to raise the probability of employment
(particularly for ALMP schemes with strong labour market linkages, such as
specific skills training), rather than to enhance the earnings of participants.
These findings were later confirmed in the published analysis ofO’Connell
(2002).
3.2
Quasi-experimental approaches
Conniffe et al.(2000) sought to benchmark propensity score estimates of the
employment effect of training schemes against those ofO’Connell and
McGinnity(1997b) who employed the standard multiple regression/selection
their treatment group and the Annual Survey of School Leavers for their control.
Using standard methods,O’Connell and McGinnityadjusted for selection bias
using covariates such as education and previous unemployment histories. In
their study,Conniffe et al. set out their case for not matching on all possible
covariates – since previous studies have shown it sufficient to match merely on
propensity scores. They began by estimating a na¨ıve binary assignment model,
using the maximum number of covariates available. Noting that many
socioeconomic variables are highly collinear, and that a variable’s utility should
be judged not by its statistical significance but by its contribution to achieving
‘balance’ between treatment and controls,Conniffe et al.showed how the
requirement of balancing among covariates is met using a parsimonious
assignment model – omitting superfluous (and likely collinear) information on
social status and previous unemployment.
Both treatment and control groups were matched within certain bands of their
propensity scores.Conniffe et al.overlaid probability distributions of both groups
and identified a lack of common support for the highest propensity scores (as
probability approaches 1). They justifiably attributed this to a selection effect –
namely the controls are better educated and less likely to move into training
schemes. Since fewer propensity-score matches may be found as the probability
of participating approaches certainty, the authors merged their fifth and sixth
sextiles. In a final act, they weighted each band by the proportion of
observations it contains – so those bands containing more matching will
contribute more to the overall treatment effect.
Conniffe et al.(2000, p. 305) concluded that although classical and propensity
score approaches led to similar findings, ‘far fewer assumptions were made in
the propensity score approach and we think it has probed deeper into the data
3.3
Evaluations of supply-side measures
Breen(1991) analysed the effectiveness of training and employment schemes
using a five-year follow-up survey of 1981/2 school-leavers. The cohort included
ALMP participants and non-participants. Breen found that labour market training
schemes increased the short-term employment probabilities of young people,
but it is unclear if reported long-term effects are due to selection basis.
3.4
Evaluations of demand-side measures
Breen and Halpin(1989) surveyed 400 firms to evaluate the impact of a wage
subsidy scheme. Importantly, they found that 68 per cent of hirings were
deadweight (i.e. hirings what would have been made even in the absence of the
subsidy), while 21 per cent represented asubstitution effect to avail of the
subsidy. Displacement was found to be low, with only 8 per cent of subsidised
The empirical exercise this paper presents uses longitudinal data to address the
following two research questions: Who participates in schemes? What happens
to their poverty risk afterwards? Longitudinal data enable us to look at the
antecedents of participation a year before, and the outcome a year after. We use
a relatively conventional approach, based on descriptive statistics and logistic
regression models, but also a pseudo-experimental method intended to give a
better estimate of the causal effect of participation (see section4.4).
4.1
Living in Ireland Survey
The Living in Ireland Survey (LIS) is a particularly important resource for
understanding the dynamics of Irish society through the second half of the
1990s. It was a household panel survey and ran from 1994 to 2001, following a
panel of respondents and interviewing all adult members of their households. It
has good information on income and therefore necessarily on the dynamics of
household income and of poverty. It has extensive labour market information,
which allows us to track, with some restrictions, individuals’ participation in
training and employment schemes.
4.1.1 Longitudinal perspective
The longitudinal perspective that panel data provide has a number of
advantages. First, we can track individuals over time and assess theirexposure
to factors such as poverty or unemployment, rather than simply observing their
stateat one timepoint. Second, we can observe ‘dynamics’: movements in and
out of states. Third, the temporal order gives us a greater ability to discriminate
selection effects (where the individual’s prior characteristics have effects both on
the likelihood of experiencing the ‘treatment’ and on the nature of the outcome)
and causal effects (where the ‘treatment’ has effects on the outcome that are
separate from those arising from the individual’s characteristics). In practical
terms, the longitudinal structure allows us to observe individuals as they enter,
participate in and leave ALMP-type schemes, and to observe their medium-term
outcomes. This before-and-after perspective gives us much greater power to
assess the true effects of participation in ALMP schemes, compared with looking
at cross-sectional outcomes.
4.1.2 Poverty dynamics from the Living in Ireland Survey
The LIS has been used extensively to assess poverty dynamics (Callan,1996;
Nolan,2002;Layte,2001;Layte et al.,2001;Whelan et al.,2003;Callan et al.,
2004,inter alia) over the 1990s, and has been superseded more recently by the
EU-SILC. In this research we use household poverty as our primary outcome
variable, and define it in a manner as close as possible to that used by the
Economic and Social Research Institute (ESRI). Because we are interested in
the effect on standard of living, rather than the more direct effect on labour
market outcomes, the focus is appropriately on equivalised household income,
rather than individual labour income. We take household net income as reported
by the LIS, and equivalise it using the ESRI ‘A’ equivalence scale which treats
the first adult in the household as one unit, subsequent adults as 0.66 units and
children as 0.33 units. We take 60 per cent of median equivalised income as the
default poverty line throughout this paper, where the median is calculated within
years across households, weighted according to the LIS household weight. The
use of wave-specific medians removes the need for deflating with a price index.
Table4.1summarises mean and median equivalised household income, and the
per cent poor at the 60 per cent-median rate, across the eight years of the
Table 4.1: Equivalised household income and poverty by wave, 1994–2001 (weighted LIS data)
Wave Equivalised net
income (IE£/month)
Percentage poor
Mean Median
1994 138.01 115.23 14.7
1995 148.58 125.00 17.4
1996 155.76 128.19 17.5
1997 166.11 142.81 17.5
1998 186.72 159.47 18.0
1999 200.70 181.32 20.3
2000 227.43 200.89 18.8
2001 255.85 234.03 20.2
Note: Poverty is defined as below 60 per cent of the median household income
and median income, with the median more than doubling over the period.
However, the proportion falling below the poverty line also rises over the period,
from under 15 to over 20 per cent. It is of course probable that some of these
people are becoming ‘poor’ while experiencing rising incomes, or at least without
experiencing income decline, since the poverty line is rising so sharply through
the period.
These poverty rates are slightly higher than those reported by the ESRI, but the
trend across the eight years is in accord with the ESRI figures.
We can get a fuller picture of the evolution of relative poverty, and the sensitivity
to the precise relative poverty line by reference to Figure4.1. While the
proportion below 75 per cent of median household income shows no particular
trend, the 60 per cent and 50 per cent lines are consistent with each other in
showing a rise that is close to monotonic. The rate of extreme relative poverty,
falling below 30 per cent of median household income, is very low, rarely rising
above 1 per cent of the sample.
Moving in and out of poverty The advantage of the longitudinality of the LIS
0 5 10 15 20 25 30 35
1 2 3 4 5 6 7 8
[image:36.595.100.499.94.391.2]75% median 60% median 50% median 30% median
Figure 4.1: Percentage under a variety of percentages of median income
Table4.2shows, approximately 45 per cent of respondents experience at least
one spell of poverty over the eight waves, but less than 4 per cent are poor the
whole time – there is a great deal of movement. Table4.3summarises this
mobility in terms of the year-to-year turnover between income bands.
Respondents with less than 30 per cent of median income in one year have a
one-in-five chance of staying there the next year, compared to a one-in-three
chance of moving above median income. Less severely poor low-income
individuals seem to have a somewhat lower chance of improving their situation:
those between 30 and 50 per cent of median income have a less than 50:50
chance of being above 50 per cent of the median the following year, and those
between 50 and 60 per cent of the median have only a 35 per cent chance of
relative improvement. This is a picture of some movement, down as well as up:
chances of getting out of severe poverty are good, but there is a good deal of
Table 4.2: Exposure to poverty over eight waves: number of times below 60 per cent of median
Number of spells Sex
in poverty Male Female Total
0 57.5 51.8 54.6
1 13.7 14.2 13.9
2 7.9 7.1 7.5
3 5.5 6.1 5.8
4 6.2 6.2 6.2
5 2.0 3.1 2.6
6 2.2 3.5 2.8
7 2.3 3.4 2.9
8 2.7 4.6 3.7
Total 100.0 100.0 100.0
Note: weighted data, restricted to respondents present at all waves
Table 4.3: Year-on-year relative income transitions
Previous year Percentage of median household income,
current year
Person years
<30% 30–50% 50–60% 60–100% Above
Under 30% median 19.4 13.1 11.7 22.5 33.3 299
30–50% median 2.6 53.2 17.8 19.7 6.7 3,167
50–60% median 1.3 20.6 43.8 29.3 5.1 4,157
60–100% median 0.5 5.4 12.0 59.5 22.6 12,994
Above median 0.4 0.9 1.0 11.7 86.0 22,689
[image:37.595.85.512.534.696.2]4.1.3 Observing exposure to active labour market programmes
The LIS contains extensive information on labour market participation, and it is
this that we use to observe participation in ALMP schemes. The labour market
information is recorded in two principal ways, with monthly status calendars as
well as more detailed information about the status at interview. While the
more-or-less continuous monthly information is attractive, and would in theory
permit a broader range of analyses, the level of detail is less than for the status
at the time of interview and as a result is less satisfactory for identifying spells in
ALMP schemes. In particular, it distinguishes inadequately between education
and ALMP-related training, whereas the variables relating to the status at
interview are better at identifying participation in either state-sponsored training
or subsidised employment.
Unfortunately, even then the amount of detail is substantially less that that
available toO’Connell and McGinnity(1997b), with the result that we cannot
replicate their detailed classification of ALMP schemes, and can do no more
than distinguish between employment schemes and training schemes. The
analysis that follows, therefore, uses data from the time of interview only (and
thus up to eight consecutive observations per individual), and can distinguish
between participation in training and employment schemes.
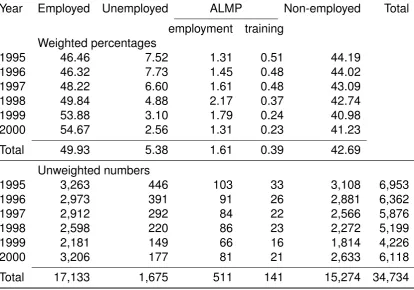
Table4.4summarises the pattern of participation in ALMP schemes between
1995 and 2000, the period of coverage where we have at least one prior year (to
provide information on status prior to participation) and one subsequent year (for
information on medium-term outcome). Training schemes show a steady pattern
of decline from about 0.5 per cent to less than 0.25 per cent of adults in the
sample (weighted). Participation in subsidised employment schemes, however,
rises to a peak of over 2 per cent in 1998, falling back to 1.3 per cent in 2000.
The second panel gives unweighted numbers, which are key to the suitability of
this data set for evaluation of the effects of ALMP schemes – it shows that we
Table 4.4: Observed participation in ALMP schemes at time of interview, 1995– 2000
Year Employed Unemployed ALMP Non-employed Total
employment training
Weighted percentages
1995 46.46 7.52 1.31 0.51 44.19
1996 46.32 7.73 1.45 0.48 44.02
1997 48.22 6.60 1.61 0.48 43.09
1998 49.84 4.88 2.17 0.37 42.74
1999 53.88 3.10 1.79 0.24 40.98
2000 54.67 2.56 1.31 0.23 41.23
Total 49.93 5.38 1.61 0.39 42.69
Unweighted numbers
1995 3,263 446 103 33 3,108 6,953
1996 2,973 391 91 26 2,881 6,362
1997 2,912 292 84 22 2,566 5,876
1998 2,598 220 86 23 2,272 5,199
1999 2,181 149 66 16 1,814 4,226
2000 3,206 177 81 21 2,633 6,118
Total 17,133 1,675 511 141 15,274 34,734
losses due to missing data, this represents an adequate number of cases to
support the statistical analysis reported below, though the numbers on training
schemes suggest that we may have less power to detect effects relating to them.
4.2
Medium-term outcome focus
Our focus for both research questions is on the medium term. This is true of the
first question to the extent that we are interested in the effect of prior poverty on
the chance of participation in an ALMP scheme the following year, and it is even
more true of the second question, where we are concerned with the
consequences of participation for exposure to poverty in the following years.
What we attempt to determine is to what extent participation in schemes has
consequences ‘down the line’, that is, after the scheme has completed. The
beneficial consequences which persist after their completion, both at the
individual and at the societal or market level. We therefore look at the individual’s
household poverty status in the year after participation as our main outcome
variable. Without data limitation, we might like to look at longer periods, say two
to three years after participation, and to insist that the outcome was measured
only if the individual was no longer a scheme participant.1However, with only
eight waves of data, we do not have sufficient observations of persons entering
and completing schemes to look at outcomes further in the future than one year
after participation.
4.3
Two analytical passes – descriptive and
‘pseudo-experimental’
The analysis reported below can be divided into two main sections: a primarily
descriptive exercise which addresses both questions, outlining the
characteristics of those who participate in schemes and their experiences after
participation, using direct summaries and logistic regression; and a more formal
attempt to judge the true effect of participation, using propensity score analysis
(see section4.4).
The aim of the descriptive analysis is multiple. First, and most generally, what
are the observed characteristics of those participating in schemes? These
should correspond to the formal recruitment requirements, but will also reflect
the broader social context. Second, to address our first research question, we
investigate what role poverty might have in predicting participation, once we
account for characteristics such as unemployment history, household structure
and so on.
Schemes will naturally have a target client `ele which is poorer than the average
by virtue of their weaker labour market positions, but there are a number of
potential mechanisms by which the population actually served may be more or
less poor than one would expect on the basis of their characteristics. On the one
hand, clients could be poorer than their observed characteristics would suggest,
if recruitment takes account of unmeasured characteristics, for instance by
selecting those most in need of assistance. On the other hand, participants may
have unobserved characteristics that make them more likely to seek out
advantageous opportunities, through for example being ‘better’ at interacting
with the welfare system, or having other characteristics that make them more
likely to benefit from participation. We use logistic models of participation to
address these questions.
The descriptive analysis also makes a first pass at answering the second
question: once we control for their observed characteristics (which will make
ex-participants much poorer than the population average), do we see an effect
on later poverty exposure? We again use logistic regression to assess the effect
of participation on the odds of poverty, controlling for observed characteristics.
Insofar as the observed characteristics adequately capture the difference
between participants and non-participants, the parameter estimate for
participation can be regarded as an estimate of its net causal effect.
However, if participants are systematically different from non-participants in ways
that are not captured by the variables in the model, this estimate will be seriously
biased. If participants carry some negative characteristics that we do not
observe, such as poorer labour market chances that might make recruitment to
schemes more likely on the grounds of greater need, they are also likely to
perform less well in poverty terms afterwards than non-participants with the
same observed characteristics. This will lead to an estimate of the effect of
participation that is biased downwards. If, on the other hand, they carry
unobserved positive characteristics, like a greater ability to work the system,
than non-participants. In this case the estimate of the effect of participation will
be unduly positive. Because of this problem, the remainder of the analysis uses
the pseudo-experimental approach of propensity score matching.
4.4
Propensity score analysis
Propensity score analysis is at heart a ‘pseudo-experimental’ method. That is, it
uses observational data – data collected from the world ‘as it is’, rather than
generated through manipulating the world in an experiment – to draw
conclusions about causal relationships in a manner as close as possible to the
experimental method. True experiments will typically take two groups, effectively
identical through matching or randomisation, and expose one to a ‘treatment’.
Insofar as the groups are identical in all relevant respects, and as their
experience differs only in respect of exposure to the treatment, there is a very
strong rationale for identifying any difference in outcome as caused by the
treatment.
By contrast, conventional use of observational data to assess the causal effects
of ‘treatments’ such as ALMP schemes poses a problem: how to we compare
the outcome of the ‘treated’ group with the outcome that an identical but
untreated group would have had. This so-called ‘counterfactual’ comparison is
what experiments achieve by matching groups prior to treating one of them. It is
clear that a simple comparison of, say, scheme participants with the population
at large is not an adequate way of assessing this, as participants have
characteristics that will make them poorer than average even after a beneficial
scheme, so the usual strategy is to measure the difference in risk of poverty
between participants and non-participants, controlling for measured
characteristics such as age, gender, education, labour market history and so on.
This is unsatisfactory in two respects. First, it involves assessing the effect of
whom are not likely to benefit from or participate in the schemes. A more
relevant comparison would be between participants and non-participants drawn
from a population ‘eligible’ for participation. The second way in which this is
unsatisfactory is that unobserved characteristics may still have an effect on the
outcome, resulting in a biased estimate of the effect of participation. A
particularly important mechanism by which this can take effect is selection,
whereby unobserved characteristics of individuals which predispose them to
participation, also have an effect on the outcome. Thus, for instance, welfare
officers might be more likely to offer schemes to persons they feel are more
likely to benefit from them, on the basis of characteristics (such as energy,
initiative and so on) which are not captured in our data sets and which will also
raise the individuals’ labour market prospects in the medium term.
Correspondingly, if schemes are a ‘last resort’ participation may tend to be more
common among those with the poorest labour market prospects.
In the former case conventional analysis will over-estimate the benefit of
participation, confusing the effect of the selection of slightly more able persons
into schemes with the concrete effect of participation, while in the latter it will
under-estimate it. An excellent overview of the evaluation problem is given in
O’Neill(2000).
The propensity score approach attempts to solve both problems in a
pseudo-experimental framework. It does this by matching participants in the
sample with non-participants who are as like them as possible, thus matching a
treatment group with a ‘control’ group. Differences between them in outcome can
thus be considered an estimate of the causal effect of treatment, as long as the
matching process is adequate. Matching can in principle be done across a range
of variables – gender, age, labour market experience and so on – but the more
variables available the more difficult it is to find a matching individual. What is
novel about propensity score matching is not the pseudo-experimental
demonstrated that it is in principle sufficient to match participants with individuals
who have the same estimated probability of participation, but who did not in fact
participate (Rosenbaum and Rubin,1983,inter alia). This estimated probability
is calculated on the basis of a probit or logistic regression model of participation.
The use of this estimated probability or ‘propensity’ is what gives the method its
name.
When we are concerned with estimating the effect of participation on
participants (‘of treatment on the treated’), matching requires the assumption
that once we condition for a set of variables predicting participation,Z, the
distribution of the outcome given non-participation,Y0 (which, critically, is not
observed for programme participants, and is thus the ‘counter-factual’), is
independent of whether participation occurs (D):
E(Y0|Z,D = 1) =E(Y0|Z,D = 0) =E(Y0|Z)
(Smith and Todd,2005, equation 8).
In other words, once we control adequately for variables predicting participation,
the fact that individuals did or did not actually participate does not give us any
more information about their probable outcome.Smith and Todd(2005, p.313)
further caution that matching is only justified when performed over thecommon
support region. Observations where the support ofZ does not overlap fall
outsidethis area. In other words, matching is valid only for those participants
whose predicted probabilty of participation is overlapped by the distribution of
predicted probability of non-participants.
treated’ as
TT =E(Y1 −Y0|D = 1) =E(Y1|D = 1)−EZ|D=1{E(Y0|D = 0,Z)}
The first term can be calculated from the observed outcomes for participants,
and the second from the matched non-participants (Smith and Todd,2005).
Matching is concerned solely with selection on observables. Propensity score
matching is an innovation ofRosenbaum and Rubin(1983), concerned with
matching participants and non-participants on their estimated probability of
participation,P(X).They show that when matching on X produces consistent
estimates, so too does matching onP(X), and matching onP(X)is much more
efficient than matching onX ifX contains many variables.
The conditional independence assumption requires that all variables affecting
both participation and outcomes in the absence of participation be included in
the matching.Smith(2000) notes that this requires careful thought as to what
variables do and do not affect participation and outcomes. It has been shown
that matching reduced the raw bias in earnings between participants and eligible
non-participants – drawn from the same local labour market and with earnings
information collected in the same way (Heckman et al.,1997,1998). Remaining
bias is further shown to be of the same magnitude as that of experimental
techniques.Dehejia and Wahba(1999) employ propensity scores to match on
pre-programme earnings. They concluded that matching eliminates the vast
majority of bias. However, this finding is contested bySmith and Todd (2005)
who claim it is sensitive to their choice of sample andX variables.
Smith(2000, p.12) identifies important differences between matching and the
1. Matching is non-parametric, thereby avoiding functional form restrictions
implicit in linear regression.
2. Evidence suggests avoiding these functional form restrictions can be
important in reducing bias (Dehejia and Wahba,1999;Smith and Todd,
2005).
3. Importantly, matching highlights the ‘support’ problem.2 Since it may not
always be possible to match every value ofP(X)appearing in the
participant group withP(X)values from non-participants, the area of
‘common support’ of matched values of P(X)may not include all cases
from the participant group. (Heckman et al.,1997;Dehejia and Wahba,
1999). In contrast, impact estimates based on simple regressions onX
often ignore this problem.
We are also mindful of some caveats relating to matching. Specifically:
1. Matching does not remove the problem of variable selection.Heckman
et al.(1997) have shown estimates produced by matching to be sensitive
to the choice of variables used to constructP(X).
2. The ‘balancing test’ ofRosenbaum and Rubin(1983), as implemented by
Dehejia and Wahba(1999) andLechner(1999), will help to determine
whether or not to include higher-order interaction terms for a given X. But it
does not aid in selecting variables to include in X to start with (Smith and
Todd,2005).
3. The choice of matching method may make a difference in small samples.
The available choices are discussed inHeckman et al.(1997). In this study
we implement Nearest Neighbour (NN) matching to approximate a
counterfactual for the treated. NN may be implemented with or without
replacement – where a non-participant may be matched/used more than
once.
4. The estimation of propensity scores adds variation beyond the normal
sampling variation. According toSmith and Todd(2005, p.13), NN matching