An Algorithm and Data Process Scheme for Indoor
Location Based on Mobile Devices
Bin Wen1*, Ruoshan Kong2
1
State Key Laboratory of Software Engineering, Wuhan University, Wuhan, China; 2International School of Software, Wuhan Uni-versity, Wuhan, China.
Email:
Received October 2013
ABSTRACT
Limited by the sampling capacity of the mobile devices, many real-time indoor location systems have such prob-lems as low accuracy, large variance, and non-smooth movement of the estimated position. A new positioning algorithm and a new processing method for sampled data are proposed. Firstly, a positioning algorithm is de-signed based on the cluster-based nearest neighbour or probability. Secondly, a weighted average method with sliding window is used to process the sampled data as to overcome the mobile devices’ weak capability of signal sampling. Experimental results show that, for the general mobile devices, the accuracy of indoor position estima-tion increases from 56.5% to 76.6% for a 2-meter precision, and from 77.4% to 90.9% for a 3-meter precision. Therefore, the proposed methods can significantly and stably improve the positioning accuracy.
KEYWORDS
Indoor Positioning; Wireless LAN; Fingerprint Map; Real-time Positioning
1. Introduction
With the development of Pervasive Computing or Ubi-quitous Computing [1], the Location Based Services [2] and Applications are attracting more and more attention. Especially in recent years, the popularity of smart phones and the tremendous development of mobile Internet have made a higher requirement to location-based mobile ser-vices and applications. Compared to the mature and pop-ular outdoor positioning technologies, indoor positioning technologies are attracting increasing attention from re-search institutes and enterprises.
Among indoor positioning systems, it is mainly based on ultrasound [3], RFID [5], WLAN [6-9], Bluetooth [4], wireless sensor networks (WSN) [8], and its compound technologies. On some specific occasions, ultrasonic wave or RFID as well as some compound and systems obtain higher accuracy. But it requires with a certain scene, higher accuracy equipment and deploying costs. Com-pared with the systems, WLAN indoor positioning tech-nology shows a lower set up costs and wider application, which becomes one of the vital research fields for today’s indoor positioning technology. It is also our major con-cern and research field.
Based on wireless signal strength (RSSI) analysis, in-door positioning technologies change in accordance with the signal strength received, and identify the location according to the distribution of radio signal strength in areas to be tested. Compared to the indoor positioning technologies based on arrival time and angle, it takes full advantage of existing network equipment and mobile devices to avoid the technical complexity of precise time synchronization and angle measurement, greatly reducing application costs, which makes itself the research focus of indoor positioning.
In practical situation, it requires not only widely used mobile devices but also higher standard for the real-time and stability of positioning. Due to the gap between the stability and sampling capability of wireless signal in mobile devices such as smartphones and those of com-puters or special equipment, positions obtained through KNN [10] or probabilistic algorithms [7] are far from the actual sites. It is more obvious in reality, affecting the accuracy and stability of positioning system. This paper discusses the positioning algorithm based on clustering which uses a sliding window to samples signal in order to improve the accuracy and stability of indoor position-ing system.
2. Description of Indoor Positioning
Technology
In the field of indoor positioning, the technology based on arrival time and angle is hard to achieve due to multi-path propagation and NLOS of radio signals where the technology based on wireless signal length is dominant.
In the field of WLAN-based indoor positioning signal strength, there are three aspects of research worth notice: 2.1. Propagation Model
The technology based on analysis of WLAN wireless signal strength is focused on the propagation model and the distribution of wireless signal. Many classical or Em-pirical-Fit Radios-Propagation Models are proposed, for example, log-distance and log-normal etc. But practical environmental differences and complexity will increase the ability for the models to simulate the real environment. So in the present indoor positioning technology which is based on wireless signal strength, the propagation models are used to analyze and assist to positioning [6,11]. The main methods are collecting or forecasting the signal fin-gerprint map, and then positioning according to measured value.
2.2. Indoor Positioning of WLAN Wireless Signal Strength
These technologies can be divided into two categories: deterministic techniques and probabilistic techniques. Deterministic techniques are generally based on close approach [6] or the ones adopted in [3,7,8]. For example, the nearest neighbor algorithm in RADAR and KNN [10] get the nearest point (NN), multi-point average or [KNN] by comparing signal in location to be measured with signal fingerprint map. Probabilistic techniques are posi-tioning by probability after measuring and building the distribution characteristic of signal strength in the loca-tion. For example, Horus system [7,11] replaces determi-nistic signal with signal distribution and then locates the most likely location which is calculated by using maxi-mum likelihood estimation (MLE) method in clusters.
Although M. Youssef and A. Agrawala provide the evidences to show that the probabilistic method makes a higher accuracy than deterministic method, as what is described in [12], due to the complexity of the environ-ments, the distribution of the signal strength vector is not always symmetric and identical at all locations. As a re-sult the accuracy can be affected by the model establish-ment of the probabilistic method and the veracity of the parameters. However, the deterministic method has sim-plified the problem to some extent. And it has reached the similar conclusion in the experiments. Therefore, our research generally adapts the KNN method in the com-parison experiment.
2.3. Fingerprint Map
There are two phases involved: an offline training phase and an online localization phase. In the offline training phase, the author collects and process the signal of the measure points in the under-test region, which form the fingerprint map; in the online location phase, the author matches the signal value in the under-test region to with the fingerprint map, and got the measured value.
The current commercial indoor positioning applica-tions have gradually been more and more specialized by technology companies and giants, such as Google, Nokia, Broadcom, Indoor Atals, Qubulus, Duke University, and so on. These commercial applications not only help to research and implement a number of positioning models based on signal strength (WLAN, Bluetooth, geomagnet-ism), but also to improve the positioning accuracy and adaptivity with other auxiliary positioning means (base stations, auxiliary WiFi, accelerometer), etc. This paper studies the problem—how to improve the accuracy and stability of indoor positioning technologies in mobile devices, which is also one of the biggest obstacles for many commercial systems.
3. Positioning Algorithm Based on
Clustering
The existing relatively stable indoor positioning system and the most used algorithm are KNN and probabilistic algorithm. But in the actual experiments it is found that only with adjusted parameters values, changes in AP placement and environmental conditions can they achie- ve a relatively high positioning accuracy. However a large range of jumping results is very obvious in sophis-ticated buildings, reducing their chances of application. Yet the positioning accuracy of KNN and probabilistic algorithm is very low in some particular areas where the similar range is smaller and the signal distribution points [13] are very far away.
the other is HTC HD2 smart phone. The maximum sam-pling capacity of homemade cellphone is 300ms per time, with that of HTC cell phone 1 sec per time. The posi-tioning calculation interval is 1 second. The signal to be measured is the sampling average. There are 3 sampling averages for strong sampling devices whereas 1 for ordi-nary cell phones. In this way, with the speed and the road prediction(i.e. the maxim speed of the object and the jumping range of its road), it still takes 15 - 30 seconds to fully stop in the first positioning, and there is a wide range of significant jitter and low positioning accuracy.
Therefore, this paper is designed for a probabilistic method or nearest neighbor algorithm (CNPM) based on grid-based parameterization (clustering).It is based on the fingerprint analysis system and higher similarity of fil-tered areas [13]. It is described as follows:
1) The sampling area is divided into multiple regions according to its natural conditions. The connectivity of each region is determined according to the paths. The reference points in fingerprint map belong to different regions to determine the connectivity of the near points. And reference point builds the collection Ai with the recent K reference points. Meanwhile every collection containing the same elements is combined to each other to build p clustered collections, which can be calculated by computers. On the other hand, the reference points can be specifically defined according to the characteris-tics of sampling areas.
2) We calculate the Euclidean distance between wire-less signal samples of the object to be measured and ref-erence points.
We take record of the average of n AP wireless signal samples of reference point n to build the finger map.
1 2
( , , , ,..., )
i 1, 2, , n
i i i i iN
x y RSSI RSSI RSSI
= … ,
We set Sjas the jth wireless signal strength value re-ceived from the equipment to be measured,
2
1
| |
i 1, 2, , n, j 1, 2, , N N
i j ij
j
d S RSSI
=
= −
= … = …
∑
(1)
And calculate the Euclidean distance di between the reference points and the equipment to be measured ac-cording to the formula.
3) We calculate the Euclidean distance between the equipment to be measured and p cluster An,
1
, 1
1, 2, , 1, 2, , 1
k n n m
m
P d n p m k
+
=
=
∑
= = +, (2) And calculate the Euclidean distance between he equipment to be measured and p clusters and Pn, and d n,m is the Euclidean distance and the No. k + 1 reference point in cluster An according to the formula.
1 1 1 1 1 ˆˆ ( , ) ˆˆ
( , ) 1, 2, , 1
1 k m m m m k m m x y d
x y m k
d + = + = =
∑
= +∑
(3),We calculate the positioning result ( ,x yˆˆ ), with the Euclidean distance and the smallest cluster according to the formula. It is found that the positioning accuracy is stable when k is 3 or 4.
If we change the Euclidean distance between the points to be measured and the reference points in the cluster into finger map frequency matched to the signal strength to be measured, and replace the Euclidean dis-tance with the matched joint frequency of points to be measured and cluster, this algorithm is non-deterministic method based on probability.
4. Measurement Signal Processing
As discussed in section III, most of smart phones only support sampling frequency of 1 time per second in prac-tical environment. Thesampling value of wireless signal is very unstable for the real-time positioning system with the same frequency, leading to a wide range of position-ing point beatposition-ing even with movement speed and path prediction. The stability (with large deviation) and fol-lowing performance (with delays due to speed prediction for small quality objects) influence the practical value of application for the system.
Therefore, we propose a weighted average method based on sliding window for real-time processing of the measurement signal. , , 1 , 1 ( 1) ( 1)
1, 2, , , 1, 2, , k
i m j i j
m
i j k
m
RSSI k m aRSSI S
k m a i t j N
− = = − + + = − + + = … = …
∑
∑
(4)RSSIi,jis the signal strength to No.j AP at the ith time. k +1 is the size of the sliding window, the value is 4 and the
a
is the current weights of sampling value, usually being k + 1. According to the formula, we can get the current weighted average processing signal strength val-ue Si passing through the sliding window at the ith time. The processed signal makes the positioning function of ordinary smartphone device with 1 sample per second perform as well as the special equipment (with 5 samples per second)5. Results and Analysis of Experiment
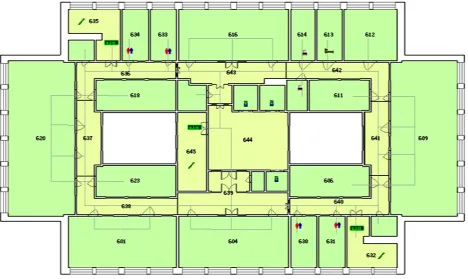
5.1. Experimental EnvironmentUniversity and Beijing Institute of Technology. The typ-ical example is the 6th floor in the school of telecommu-nication in Beijing Institute of Technology with a length of 50 meters and a width of 31 meters where there are complex doorways, numerous windows and doors, and 2 patios. The experiment has chosen Room 620 and all the doorways as the experiment site. The blueprint is as shown in Figure 1.
In the experimental site there are 77 sampling points in all with an interval distance of 2 m. There are 8 APs where signals of at least 5 APs can be sampled in each area. The equipment is HTC smartphone HD2. During offline training phase, we take 100 samples and the sam-pling frequency of each samsam-pling point is 1. During on-line positioning phase, both sampling and positioning frequency are 1s.
5.2. Experimental Results
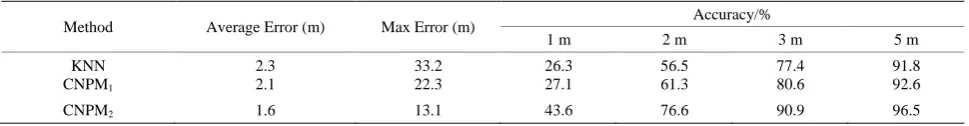
[image:4.595.66.535.441.720.2]In response to the experiment environment, we adopt KNN method (the parameter value of k is 3), nearest neighbor algorithm based on clusters (the parameter val-ue of k is 3), and nearest neighbor algorithm based on clusters plus a weighted average of the sliding window method to conduct 2000 tests in the experimental site. The results are as follows in Table 1.
Table 1 shows that accuracy of CNPM method within
enhanced range of 3 meters is more obvious that that of KNN method as to improve the stability of positioning.
In the experiment, the average error of KNN method is 2.3m, max average error of it is 33.2 m, and the accuracy for a 1-meter precision is 26.3%; 2-meter, 56.5%; 3-meter, 77.4%; 4.5-meter, 91.8%. The average error of CNPM without a weighted average of the sliding win-dow method has been improved by 0.2 m to 2.1 m; the max error of it has been improved by 10.9 m to 22.3 m, and the accuracy for a 1-meter precision has been im-proved by 0.8% to 27.1%; 2-meter, 4.8%, 61.3%; 3- me-ter, 3.2%, 80.6%; 5-meme-ter, 0.8%, 92.6%. The average error of CNPM with a weighted average of the sliding window method has been dramatically improved by 0.7 m to 1.6 m; the max error of it has been improved by 20.1 m to 13.1 m, and the accuracy for a 1-meter preci-sion has been improved by 17.3% to 43.6%; 2-meter, 20.1%, 76.6%; 3-meter, 13.5%, 90.9%; 5-meter, 4.7%, 96.5%.
In a word, the combination of CNPM method and a weighted average of the sliding window method impro- ves the accuracy of smartphones from 56.5% to 76.6% for a 2-meter precision; 77.4%, 90.9%, 3-meter; 91.8%, 96.5%, 5-meter. At the same time, both average and max error have been reduced as to improve the accuracy and stability of the system.
6. Conclusion
As equipment and application of smart devices are usua- lly applied over laptops or special equipment in prac-
Table 1. Results comparison between KNN method and positioning algorithm based on clusters.
Method Average Error (m) Max Error (m) Accuracy/%
1 m 2 m 3 m 5 m
KNN CNPM1
2.3 2.1
33.2 22.3
26.3 27.1
56.5 61.3
77.4 80.6
91.8 92.6
CNPM2 1.6 13.1 43.6 76.6 90.9 96.5
1) No sampling values with a weighted average of the sliding window method; 2) Sampling values with a weighted average of the sliding window method. tical business indoor positioning system, therefore the
ability and stability of sampling results in them are dif-ferent from those in other experimental environment de-signed for ordinary indoor positioning technologies. In many practical situations, it requires real-time position-ing where samples are few, droppposition-ing the accuracy of traditional positioning algorithm as well as increasing the change variance of position with jumping points in large range compared to in ordinary research environment. All above has severe impact on the ability and stability of indoor positioning system and satisfaction from the users. Therefore this paper puts forward a new kind of method to tackle this problem, improving the accuracy and sta-bility of indoor positioning system in mobile devices.
It is shown that the positioning algorithm and data processing method put forward in this paper has dramat-ically improved the positioning accuracy or a 2-meter precision by 20.1% from 56.5% to 76.6%; 3-meter, 13.5%, 77.4%, 90.9% ; 5-meter, 4.7%, 91.8%, 96.5%, and reduced the average error by 0.7 m from 2.3 m to 1.6 m. In conclusion the positioning algorithm based on cluster (CNPM) and sampling method with a weighted average of the sliding window processing are very pro-ductive for improvement of indoor positioning accuracy and stability in mobile devices.
The major tasks for future research are composed of: 1) It is suggested to study the filtering processing of sam-pling signal in mobile devices to enhance the accuracy and stability of real-time and quasi real time positioning system. 2) Due to varied models and types of mobile devices, the adaptivity of finger print map is far from satisfying. Therefore the work to generalize the sampling data in different kinds of equipment as to improve such adaptivity is one of research issues in the future.
Acknowledgement
This paper is supported by a grant from the National High Technology Research and Development Program of China (863 Program) (No. 2012AA120802).
REFERENCES
[1] M. Weiser, “Some Computer Science Issues in
Ubiquit-ous Computing,” Communications of the ACM, Vol. 36, No. 7, 1993, pp. 75-84.
[2] M. Hazas, J. Scott and J. Krumm, “Location-Aware Computing Comes of Age,” Computer, Vol. 37, No. 2, 2004, pp. 95-97.
[3] R. Want, A. Hopper, V. Falcao and J. Gibbons, “The Active Badge Location System,” ACM Transactions on Information Systems, Vol. 10, No. 1, 1992, pp. 91-102.
[4] R. Casas, “BLUPS: Bluetooth and Ultrasounds Position-ing System,” Doctoral Dissertation, University of Zara-goza, 2004.
[5] L. M. Ni, Y. Liu, Y. C. Lau and A. P. Patil, “Landmarc: Indoor Location Sensing Using Active RFID,” Pervasive Computing and Communications, 2003, pp. 407-415.
[6] P. Bahl and V. N. Padmanabhan, “RADAR: An In- Building RF-Based User Location and Tracking System,” IEEE INFOCOM 2000 Conference, 2000, pp. 775-784.
[7] M. Youssef and A. Agrawala, “The Horus WLAN Loca-tion DeterminaLoca-tion System,” Proceedings of the 3rd In-ternational Conference on Mobile Systems, Applications, and Services, 6-8 June 2005, pp. 205-218.
[8] L. Doherty, L. Ghaoui and K. Pister, “Convex Position Estimation in Wireless Sensor Networks,” IEEE INFO-COM 2001 Conference, 2001, pp. 1655-1663.
[9] A. Gunther and Ch. Hoene, “Measuring Round Trip Times to Determine the Distance between WLAN Nodes,” Proceedings of Networking, Waterloo, May 2005.
[10] R. O. Duda and P. E. Hart, “Pattern Classification,” 2nd Edition, John Wiley, New York, 2000.
[11] M. Youssef and A. Agrawala, “On the Optimality of WLAN Location Determination Systems,” The Commu-nication Network sand Distributed Systems Modeling and Simulation Conference, 18-24 January 2004.
[12] A. S. Krishnakumar and P. Krishnan, “The Theory and Practice of Signal Strength-Based Location Estimation,” Collaborative Computing: Networking, Applications and Worksharing, San Jose, 2005.