Detection and Quantification of
agr
Functionality in Clinical
Staphylococcus aureus
Isolates
Liang Chen,aBo Shopsin,bYanan Zhao,aDavida Smyth,bGregory A. Wasserman,bChristina Fang,aLisa Liu,aand Barry N. Kreiswirtha
Public Health Research Institute TB Center, International Center for Public Health, University of Medicine and Dentistry of New Jersey, Newark, New Jersey, USAa and Department of Medicine, Division of Infectious Diseases, Skirball Institute of Biomolecular Medicine, New York University School of Medicine, New York, New York, USAb
Staphylococcus aureusinfections are a significant cause of morbidity and mortality in health care settings.S. aureusclinical iso-lates vary in the function of the accessory gene regulator (agr), which governs the expression of virulence determinants, includ-ing surface and exoproteins, whileagractivity has been correlated with patient outcome and treatment efficiency. Here we de-scribe a duplex real-time nucleic acid sequence-based amplification (NASBA) detection and quantification platform for rapid determination ofagrfunctionality in clinical isolates. Using the effector ofagrresponse, RNAIII, as the assay target, and expres-sion of the gyrase gene (gyrB) as a normalizer, we were able to accurately discriminateagrfunctionality in a single reaction. Time to positivity (TTP) ratios betweengyrBand RNAIII showed very good correlation with the ratios of RNAIII versusgyrBRNA standard inputs and were therefore used as a simple readout to evaluateagrfunctionality. We validated the assay by characteriz-ing 106 clinicalS. aureusisolates, including strains with genetically characterizedagrmutations. All isolates with dysfunctional agractivity exhibited a TTP ratio (TTPgyrB/TTPRNAIII) lower than 1.10, whereasagr-positive isolates had a TTP ratio higher than
this value. The results showed that the assay was capable of determining target RNA ratios over 8 logs (10ⴚ3to 104) with high
sensitivity and specificity, suggesting the duplex NASBA assay may be useful for rapid determination ofagrphenotypes and virulence potential inS. aureusclinical isolates.
T
heStaphylococcus aureusaccessory gene regulator (agr) locus, a well-studied quorum-sensing two-component regulatory system, is the central regulator within the overall staphylococcal virulon, which includes both secreted virulence factors and sur-face proteins. Theagrlocus is complex, consisting of two diver-gent transcriptional units, driven by promoters P2 and P3 (re-viewed in reference 7). The P2 operon contains four genes (agrB,agrD,agrC, andagrA), coding for the following proteins: AgrC is the signal receptor and AgrA is the response regulator, while AgrB and AgrD combine to produce the activating ligand for AgrC. AgrA also activates theagrP3 promoter, which drives the synthesis of RNAIII, the effector of target gene regulation. RNAIII also en-codes␦-hemolysin, the expression of which serves as a surrogate foragrfunctionality (5, 18, 19).
Animal studies have demonstrated thatagrdeficiency can at-tenuateStaphylococcusacute infections in a variety of models, in-cluding skin abscesses, endocarditis, septic arthritis, and osteomy-elitis (reviewed in reference 7). Similarly, agr antagonists that block quorum sensing have anti-infective activity in experimental
S. aureusinfections (23). Studies ofagractivity fromS. aureus
isolates recovered from patients with ventilator pneumonia have shown thatagrdysfunction is associated with improved patient outcomes (7). However,S. aureus agrdysfunction has also been associated with longer duration of bacteremia and attenuated van-comycin bactericidal activity, as well as increased mortality among bacteremic patients (4, 13). A number of reports have indicated that the emergence of vancomycin-intermediateS. aureus(VISA) was accompanied by agr dysfunction, mainly due to loss-of-function mutations within theagroperon (11, 12, 18).
Although the virulence ofagrmutants is attenuated in animal models, the role ofagrin clinical infections has not been clearly defined. In order to address this issue, a rapid and specific
detec-tion assay to determine agrfunctionality in clinical isolates is needed. Currently, assays ofagrfunctionality are mainly based on phenotypic detection of␦-hemolysin, the translation product of RNAIII. A sheep blood agar (SBA) plate assay is used to score the synergistic hemolytic activity of ␦-hemolysin versus ␣- and
-hemolysins (14, 19). While this phenotypic assay is easy to con-duct, interpretation of results is subjective, and intra- and inter-laboratory results may vary, especially for isolates with weak he-molytic activity. Additionally, phenol-soluble modulins (PSMs) other than␦-hemolysin (also known as PSM-␥) also possess syn-ergistic hemolytic activity (2). Consequently, although the syner-gistic hemolytic reaction is a reliable indicator ofagrfunctionality, it is not specific for the detection or quantification of␦-hemolysin production (2). To address these considerations, we report the development of a duplex real-time nucleic acid sequence-based amplification (NASBA) assay that is able to quantifyagrlevels in clinical isolates.
(This study was partially presented at the 2009 Annual Meeting of the Infectious Diseases Society of America.)
MATERIALS AND METHODS
Bacterial strains.TheS. aureusstrains selected for this study were ac-quired from the Network on Antimicrobial Resistance inStaphylococcus
Received29 October 2011Returned for modification3 December 2011
Accepted25 December 2011
Published ahead of print4 January 2012
Address correspondence to B. N. Kreiswirth, [email protected].
Copyright © 2012, American Society for Microbiology. All Rights Reserved.
doi:10.1128/JCM.06253-11
on May 16, 2020 by guest
http://jcm.asm.org/
aureus(NARSA) (http://www.narsa.net) or from the Public Health Re-search Institute (PHRI) Tuberculosis Center strain collection and include strains with sequenced genomes and well-characterized agr groups (NCTC 8325, USA300-FPR3757, N315, Mu50, MRSA252, MW2, RN6390, RN6607, RN8462, RN5881, and RN6911). Forty-eight non-S. aureusstrains used for specificity testing were obtained from the Ameri-can Type Culture Collection (ATCC) and the PHRI collection. A total of 106 well-characterized isolates, collected over a 6-month period from 12 New York City hospitals during May 1996 (10, 15), were used to validate the application of the NASBA assay.
Culture conditions and total RNA isolation.S. aureuswas subcul-tured from frozen stocks on Trypticase soy agar (TSA) plates, and a single colony was picked for liquid culture in Trypticase soy broth (TSB). Over-night cultures were subcultured in a 1:100 dilution of fresh TSB and grown with vigorous shaking (250 rpm) at 37°C. Cell growth was moni-tored by spectrometric readings at 600 nm.
Upon reaching an optical density (OD) of 1.0 (approximately 3 h after subculturing), bacterial cultures were collected and pelleted by centrifu-gation (16,000⫻gfor 10 min at 4°C). Bacterial pellets were then treated with 100g/ml lysostaphin (Sigma-Aldrich, St. Louis, MO) at 37°C for 30 min, and RNA was isolated using the RNeasy minikit (Qiagen, Valencia, CA), according to the manufacturer’s instructions. An RNase-free DNase set (Qiagen, Valencia, CA) was used to remove potential DNA contami-nation.
Oligonucleotide primers and probes.The oligonucleotides used in this study are listed in Table 1. RNAIII, the effector of theagr quorum-sensing regulatory system, was used as a target foragractivity. Gyrase gene gyrB, widely used inS. aureusreverse transcription-PCR (RT-PCR) as-says, was used as the normalizing gene.S. aureus-specific targets for RNAIII andgyrBmolecular beacon and primer design were evaluated using online BLAST searches (http://blast.ncbi.nlm.nih.gov/). Primers RNAIII-P1 and RNAIII-P2 and molecular beacon RNAIII-MB (labeled with 5-carboxyfluorescein [FAM] fluorophore) were designed to amplify RNAIII RNA. Similarly, primers gyrB-P1 and gyrB-P2 and molecular bea-con gyrB-MB (labeled with CAL Fluro Red 610 fluorophore), were used to amplifygyrBRNA. Primer sets RNAIII-it-P1/P2 and gyrB-it-P1/P2 were designed to generatein vitrotranscription RNA standards (described be-low). Molecular beacon probes were designed according to guidelines described at http://www.molecular-beacons.org/. Potential cross-reactivity among molecular beacons and primers in simplex and duplex NASBA assays was investigated using the Autodimer online tool (20). The mfold-RNA and -DNA programs were used to predict the secondary structure ofS. aureusRNA and molecular beacon probes, respectively (25). Molecular beacon probes were purchased from Biosearch Technol-ogies (Novato, CA) and purified by high-performance liquid chromatog-raphy (HPLC) as described elsewhere (22); oligonucleotide primers were ordered from Integrated DNA Technologies (Coralville, IA).
Synthesis and quantification of target RNA transcripts.The artificial target RNA fragments for RNAIII andgyrBwere synthesized byin vitro transcription as previously described (24). Primers used to generate
spe-cific PCR products as template forin vitrotranscription are listed in Table 1. Purified RNA targets were quantified using a Quant-iT RiboGreen RNA quantification kit (Molecular Probes, Invitrogen, Carlsbad, CA). Ten-fold dilutions of RNA standards were prepared from 107to 101copies/l and
frozen at⫺80°C until use.
Duplex NASBA assay.Simplex and duplex NASBA assays were per-formed on a NucliSENS EasyQ analyzer (bioMérieux, Lyon, France), us-ing the NucliSENS EasyQ basic kit version 2 (bioMérieux, Lyon, France) for amplification. Primer sets and molecular beacon sequences used for simplex and duplex NASBA reactions are shown in Table 1. Each sample was amplified in a 10-l NASBA reaction mixture (half the volume rec-ommended by the bioMérieux protocol), consisting of 5l of NASBA reagent-primer mix, 2.5l of RNA template, and 2.5l of the enzyme mixture (avian myeloblastosis virus retrotranscriptase, RNase H, and T7 RNA polymerase). In the simplex NASBA assay, 0.2M RNAIII andgyrB primers and 0.1M RNAIII andgyrBmolecular beacons were used. To obtain equal amplification efficiencies for both targets in the duplex NASBA assay, primer concentrations were further optimized, and half the amount of RNAIII primers was used. Briefly, a total volume of 5l of reaction mixture containing 70 mM KCl, 0.1M RNAIII primers, and 0.2
MgyrBprimers was incubated with 2.5l RNA template in the presence of 0.1M each RNAIII andgyrBmolecular beacons at 65°C for 2 min, in order to denature RNA secondary structure. The reaction mixture was subsequently cooled to 41°C for 2 min to anneal the primers before adding 2.5l of the enzyme mixture. After gentle mixing by tapping followed by brief centrifugation, the reaction mixtures were incubated at 41°C (iso-thermal cycling conditions) for 90 min. All samples were tested in dupli-cate.
RNA quantification using the NASBA assay.Following amplifica-tion, a threshold was determined by setting the fluorescence emitted dur-ing the first 5 measurement points as background (21). The time point at which a reaction exceeds the threshold by more than 1.25-fold is denoted the time to positivity (TTP). In the simplex assay, quantification capacity was assessed by plotting the TTP values against the logarithm of the num-ber of target molecules in each standard series and then calculating the linear regression. For the duplex assay, different combinations of input ratios from 101:107to 107:101for RNAIII andgyrBRNA transcripts,
re-spectively, were used to generate a standard curve (Fig. 1). Using this approach, the ratio of RNAIII togyrBin each sample could be extrapo-lated from the standard curves.
In this study, the TTP ratio (TTPgyrB/TTPRNAIII) was introduced as a
simple readout measurement to quantifyagractivity, given the close cor-relation between TTP ratio versus the RNAIII andgyrBinput ratios (Fig. 1). Based on the cutoff values of the TTP ratios,S. aureusisolates could be assigned to differentagrfunctionality groups.
[image:2.585.41.547.77.195.2]Analytical specificity.The specificity of the real-time NASBA assay for bacteria and fungi was verified inin silicostudies using online BLAST databases (http://blast.ncbi.nlm.nih.gov/Blast.cgi). The analytical speci-ficity of the duplex NASBA assay was initially tested using a number ofS. aureusreference strains with sequenced genomes and differentagrgroups, TABLE 1Primers and molecular beacons
Primer/probe Sequence (5=¡3=)a Size of amplicon (bp)
RNAIII-P1 AATTCTAATACGACTCACTATAGGGTGTTCACTGTGTCGATAATCC 122
RNAIII-P2 GTTGATGAGTTGTTTAATTTTAAG
RNAIII-MB 5=-FAM-cgcgatTGGCACAAGATATCATTTCAACatcgcg-BHQ-1-3=
gyrB-1P1 AATTCTAATACGACTCACTATAGGGCTCCATCCACATCGGCAT 189
gyrB-2P2 CGCAGGCGATTTTACCATTA
gyrB-MB 5=-CAL Fluor Red 610-cgcgaATCACAGCATTTGGTACAGGAtcgcg-BHQ-2-3=
RNAIII-it-P1 AATTCTAATACGACTCACTATAGGGGATCACAGAGATGTGATGGAAAA 496
RNAIII-it-P2 AGGGGCTCACGACCATACTT
gyrB-it-P1 AATTCTAATACGACTCACTATAGGGGGTACGCATGAAGACGGATT 897
gyrB-it-P2 TGCATTCATTTCTCCAAGACC
aComplementary arm sequences (hairpins) in each molecular beacon are shown in lowercase. FAM, 5-carboxyfluorescein; BHQ, Black Hole Quencher.
on May 16, 2020 by guest
http://jcm.asm.org/
including the following (GenBank accession number,agrgroup): NCTC 8325 (NC_007795, agr I), USA300-3757 (NC_007793, agr I), N315 (NC_002745,agrII), Mu50 (NC_002758,agrII), MRSA252 (NC_002952, agrIII), MW2 (NC_003923,agrIII), RN6390 (X52543,agrI), RN6607 (AF001782,agrII), RN8462 (AF001783,agrIII), RN5881 (AF288215,agr IV), and RN6911 (agr-knockout strain). Species specificity was tested against a variety of non-aureusstaphylococcal species, includingS. epider-midis(n⫽4),S. haemolyticus(n⫽2),S. capitis(n⫽2),S. hominis(n⫽ 2),S. saprophyticus(n⫽2),S. lugdunensis(n⫽2),S. lentus(n⫽2),S. xylosus(n⫽2),S. pseudintermedius(n⫽2),S. sciuri(n⫽2),S. warneri (n⫽2),S. gallinarum(n⫽1), andS. succinus(n⫽1). In addition, the analytical specificity of this assay was tested against of a number of Gram-positive and Gram-negative bacterial species, includingEnterococcusspp. (n⫽2),Streptococcusspp. (n⫽2),Macrococcusspp. (n⫽2),Enterobacter spp. (n⫽2),Klebsiellaspp. (n⫽2),Acinetobacterspp. (n⫽2), Pseudomo-nasspp. (n⫽2),Serratiaspp. (n⫽2), andEscherichia coli(n⫽2). Four fungal strains (Candida albicans) were also included. All bacterial and fungal strains were selected from our previous studies (1, 17).
Statistical analysis.The statistical significance of differences in gene expression was determined using thettest (Prism; GraphPad, San Diego, CA). Differences were considered statistically significant atPⱕ0.05.
RESULTS
Analytical sensitivity of NASBA assay.A series of NASBA prim-ers and probes were initially designed and tested in a simplex NASBA assay and then targeted to RNAIII and variousS. aureus
control genes (data not shown). Two simplex NASBA assays with similar amplification efficiencies were chosen (slopes of⫺2.18 and⫺2.24, respectively), and 10-fold serial dilutions ofin
vitro-synthesized RNA templates from both targets (RNAIII andgyrB) were used to generate standard curves. Both assays revealed a clear linear relationship between logarithmic RNA inputs (101to 107
copies/l) and TTP. The coefficients of determination (R2) were 0.9935 and 0.9920 for RNAIII andgyrB, respectively. The quanti-fication limits for RNAIII andgyrBwere as low as 10 copies/l in each simplex NASBA assay, corresponding to 25 RNA copies per reaction. For duplex NASBA assays, different input combinations
(101to 107copies/l) of RNAIII andgyrBRNA were analyzed, as
shown in Fig. 1. RNAIII/gyrBinput ratios spanning 8 logs of both targets were then plotted against the TTP ratios of both genes (TTPgyrB/TTPRNAIII). Logarithmic values of TTP ratios showed
very good correlation with logarithmic values of RNAIII/gyrB in-put ratios, from 10⫺3:1 to 104:1 (R2⫽0.9916,P⬍0.001) (Fig. 1). RNA ratios were therefore measured over an 8-log dynamic range, from⫺3 to⫹4 log units of RNAIII versusgyrBRNA, with the lowest quantification limit of 10 copies/l for each target.
Analytical specificity of NASBA assay.The specificity of the assay was initially tested using RNA isolated fromS. aureusstrains with sequenced genomes and from control strains of all fouragr
groups (see Materials and Methods). Both RNAIII andgyrB am-plification curves were observed in allS. aureusstrains tested, ex-cept for strain RN6911, which only produced thegyrB amplifica-tion curve due to the absence of theagrlocus (8). Analysis of different staphylococcal species, includingagrhomolog-bearing species such asS. epidermidisandS. lugdunensis(3, 9), as well as other Gram-positive and Gram-negative pathogens, showed no amplification for either RNAIII orgyrB. These experimental find-ings support the BLAST search results used in the design of prim-ers and molecular beacons.
Analytical reproducibility.The reproducibility of the assay was measured by analysis of three independent RNA samples in three independent NASBA experiments. The three NASBA runs were performed on three different days using three different lot numbers of the NucliSENS EasyQ Basic kit version 2 (bioMérieux, Lyon, France) and tested in triplicate. Three different RNA sam-ples at input ratios of 103:1, 1:1, and 10⫺3:1 (RNAIII/gyrB) were
evaluated for reproducibility, expressed as the coefficient of vari-ation (CV) of the log10values of the concentration. The precision
associated with each RNA ratio level (10⫺3, 100, and 103) was assessed by calculating the CV for each. The CVs within a single run ranged from 0.67 to 10.07%, whereas the CVs in different runs ranged from 0.87 to 12.00%, showing that the precision of the duplex NASBA assays was significant.
Validation of duplex NASBA assay.In a previous study,agr
functionality among 269 single-patient MRSA isolates was deter-mined by screening for synergistic and direct hemolysis (15). All 269 isolates were previously genotyped by a combination of meth-ods, includingspatyping, SCCmectyping, and pulsed-field gel electrophoresis (PFGE) (1, 10, 16). Although the majority of strains were deemed positive for␦-hemolysin production (syner-gistic hemolysis), 40 strains were identified as nonhemolytic, while 13 exhibited a mixture of both hemolytic and nonhemolytic colonies (15).
Further analysis of the 53 nonhemolytic isolates (mixtures had been further purified) by sequencing of theagrAandagrCregions identified various mutations in theagrlocus, including frameshift indels (n⫽19), nonsense mutations (n⫽9), nonsynonymous changes (n⫽19), and genetic alterations in intergenic regions (n⫽3) (15). Among the three remaining isolates, two showed no
agrmutations, while theagrregion from the third isolate could not be amplified. Detailed genotyping data (spa, SCCmec, and PFGE) of these nonhemolytic isolates have been published previ-ously (15). A total of 53 hemolytic strains from the same collection were selected asagr⫹controls: 13 from the purified mixtures and 40 withspatypes, SCCmectypes, and PFGE profiles identical or highly related to those of the nonhemolytic strains.
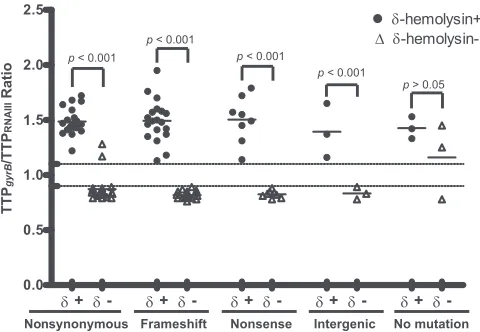
The RNAIII duplex NASBA assay results are shown in Fig. 2.
FIG 1Relationship of TTP ratio (TTPgyrB/TTPRNAIII) to RNAIII/gyrBinput
ratios. Logarithmic values of RNAIII/gyrBinput ratios (xaxis) were plotted against logarithmic values of TTPgyrB/TTPRNAIII(yaxis). The table below thex
axis depicts the different combinations of RNAIII/gyrBinput ratios used to generate the standard curve.
on May 16, 2020 by guest
http://jcm.asm.org/
[image:3.585.60.267.63.270.2]The TTP ratios (TTPgyrB/TTPRNAIII) in each mutation group
(in-cluding frameshift, nonsense, nonsynonymous, intergenic, and unidentified mutations) of nonhemolytic strains (␦-hemolysin negative) were compared with those of their corresponding he-molytic controls (␦-hemolysin positive). Upon growing cultures in TSB to an optical density at 600 nm (OD600) of 1.0, all hemolytic
isolates in each mutation group had significantly higher TTP ra-tios (TTPgyrB/TTPRNAIII) than the corresponding nonhemolytic
groups (Fig. 2) (P⬍0.001). All TTP ratios in the hemolytic group (mean⫾standard deviation [SD], 1.48⫾0.16) were above 1.10 (corresponding to an RNAIII/gyrBRNA ratio of 1:1), whereas the ratios in the nonhemolyticagrmutation groups (0.82 ⫾0.03) were mostly below 0.90 (corresponding to an RNAIII/gyrBratio of 1:10) (Fig. 2).
Two isolates with nonsynonymous agr mutations (BK2345 and BK2489) exhibited an RNAIII/gyrBvalue greater than 1.10 (Fig. 2), despite being genotypically indistinguishable and harbor-ing identicalagrmutations (Phe¡Cys at amino acid [aa] 248 in AgrC) (15). However, Northern blot and RT-PCR analyses con-firmed these strains express RNAIII at a relatively lower level than their genotypically equivalentagr⫹controls (data not shown). Exoprotein profiles of both isolates were also determined at vari-ous time points (t⫽0, 2, 4, and 6 h) (19) and displayed a delayed
agractivation pattern (data not shown), as described previously (18, 19). It is therefore suggested that this nonsynonymous muta-tion (Phe¡Cys at aa 248 in AgrC) does not inactivate theagr
locus, but rather delaysagractivation, which results in failure to translate␦-hemolysin, leading to a nonhemolytic phenotype.
As mentioned above, 2 of the 53 nonhemolytic strains (BK2397 and BK2359) did not harbor identifiable mutations in theagr
region, while in another nonhemolytic strain (BK2549), theagr
region could not be amplified (15). In this study, duplex NASBA assay results indicated that BK2397 and BK2359 were actually pro-ducing RNAIII transcripts (TTPgyrB/TTPRNAIII⫽1.45 and 1.25,
respectively), in agreement with theagrsequencing results.
Exo-protein profiles of these isolates were similar to those of theiragr⫹
equivalents (data not shown), suggesting that BK2397 and BK2359 areagrfunctional. Strain BK2549 makes very little RNAIII at the level of nonhemolytic agr mutation groups (TTPgyrB/
TTPRNAIII⫽0.78), presumably due to a large insertion or deletion
in theagrregion. RNAIII expression in these three isolates was confirmed by RT-PCR (data not shown), consistent with duplex NASBA assay results.
These results demonstrate thatagr-positive isolates, including the 53␦-hemolysin-positive controls, as well as strains BK2345, BK2489, BK2397, and BK2359, exhibit higher TTPgyrB/TTPRNAIII
ratios (⬎1.10) thanagrmutant isolates (ratio,⬍0.90) (Fig. 2). Based on these observations, a TTP ratio of 1.10 appears to be a sensitive and specific cutoff foragrfunctionality.
DISCUSSION
In this study, we developed a quantitativeagrfunctionality assay that simultaneously measures RNAIII andgyrBmRNA in a single-tube reaction using a real-time duplex NASBA method. In con-trast to other agrquantification techniques, such as RT-PCR, NASBA-based RNA amplification is achieved in a homogeneous and isothermal manner, which obviates the need for a thermal cycler and may facilitate potential clinical use with the production of point-of-care devices in resource-poor settings. The advantage of the one-tube format is that assay variation attributable to the experimental procedure influences each target amplification in the same manner, thereby increasing reproducibility. In combina-tion with standardized NASBA reagents (NucliSENS EasyQ basic kit), our duplex assay offers significant advantages for both intra-and interlaboratory comparisons, as most assay parameters have been well established (primers and molecular beacons) and qual-ity controlled (reagents). Moreover, the duplex format provides savings in materials, reagents, and hands-on time, thereby reduc-ing overall costs.
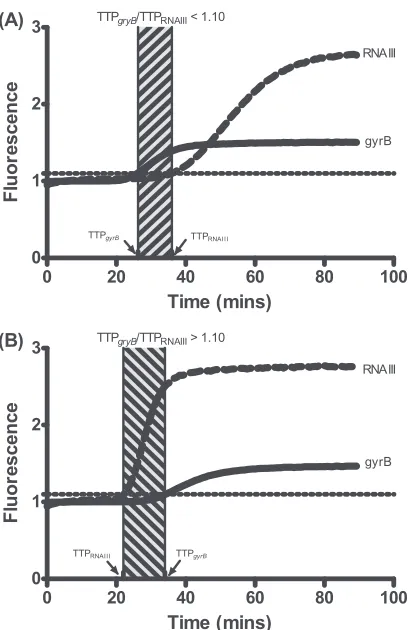
In this study, thegyrB/RNAIII TTP ratio was used as a simple and accurate readout to quantify RNAIII expression levels. For example, a TTP ratio of 1.10 was successfully used as a cutoff value to quickly differentiateagrfunctionality. As shown in Fig. 3A, if TTPgyrBis lower than or similar to TTPRNAIII(ratio,⬍1.10),agr
activity is demonstrably negative, whereas if TTPRNAIIIis
consid-erably lower than TTPgyrB(ratio,⬎1.10),agractivity is positive
(Fig. 3B). Such an algorithm allows for easy and rapid interpreta-tion of results.
One limitation of this study is that we only evaluated RNAIII expression at a single time point (OD of 1.0 in TSB), whereasagr
activation is time and population density dependent (6, 8). Eval-uation of RNAIII expression at multiple time points would better define the RNAIII transcription profiles andagrfunctionalities— e.g., early versus delayedagractivation (18, 19); however, such an approach is not practical for routine screening. Moreover, we suc-cessfully differentiated a variety ofagrmutant isolates from their correspondingagr⫹controls using an OD of 1.0 (Fig. 2), suggest-ing that this OD is a highly reliable ssuggest-ingle time point to evaluateagr
functionality in clinical isolates.
In conclusion, the duplex NASBA assay described in this study is a powerful tool for measuringagrfunctionality inS. aureus
strains over a broad dynamic range with good precision and accu-racy. Both the assay performance and simplicity of execution are highly desirable for routine screening and quantification ofagr
activity in clinicalS. aureusisolates. Future plans for the assay
FIG 2RNAIII expression levels in 106 clinicalS. aureusisolates. TTP ratios (TTPgyrB/TTPRNAIII) of␦-hemolysin-negative isolates with nonsynonymous
changes (n⫽19), frameshift indels (n⫽19), nonsense mutations (n⫽9), and intergenic mutations (n⫽3), as well as those with no mutations identified (n⫽3), were compared with their corresponding genetically identical or closely related␦-hemolysin-positive controls.␦⫹and␦⫺,␦-hemolysin posi-tive and negaposi-tive, respecposi-tively. Dotted lines indicate the TTP ratio cutoffs of 1.10 and 0.90, respectively. Short horizontal lines within each group of data points denote the mean of each group.
on May 16, 2020 by guest
http://jcm.asm.org/
[image:4.585.43.283.66.232.2]include optimizing the application directly in clinical specimens such as blood culture, as well as exploring the role ofagrin differ-ent clinical infections.
ACKNOWLEDGMENTS
We thank José R. Mediavilla for critical reading and helpful suggestions. This study was funded by a grant from Pfizer to B.N.K.
REFERENCES
1.Chen L, et al.2009. Multiplex real-time PCR for rapid staphylococcal cassette chromosomemec(SCCmec) typing. J. Clin. Microbiol.47:3692– 3706.
2.Cheung GYC, Otto M.7 December 2011, posting date. Direct and syn-ergistic hemolysis caused by Staphylococcus phenol-soluble modulins: implications for diagnosis and pathogenesis. Microbes Infect. doi: 10.1016/j.micinf.2011.11.013.
3.Donvito B, et al.1997. Distribution of the synergistic haemolysin genes
hldandslushwith respect toagrin human staphylococci. FEMS Microbiol. Lett.151:139 –144.
4.Fowler VG, Jr, et al. 2004. Persistent bacteremia due to methicillin-resistantStaphylococcus aureusinfection is associated withagrdysfunction and low-level in vitro resistance to thrombin-induced platelet microbici-dal protein. J. Infect. Dis.190:1140 –1149.
5.Ingavale S, van Wamel W, Luong TT, Lee CY, Cheung AL. 2005. Rat/MgrA, a regulator of autolysis, is a regulator of virulence genes in Staphylococcus aureus.Infect. Immun.73:1423–1431.
6.Novick RP.2003. Autoinduction and signal transduction in the regula-tion of staphylococcal virulence. Mol. Microbiol.48:1429 –1449. 7.Novick RP, Geisinger E.2008. Quorum sensing in staphylococci. Annu.
Rev. Gen.42:541–564.
8.Novick RP, et al.1993. Synthesis of staphylococcal virulence factors is controlled by a regulatory RNA molecule. EMBO J.12:3967–3975. 9.Otto M, Sussmuth R, Jung G, Gotz F.1998. Structure of the pheromone
peptide of theStaphylococcus epidermidis agrsystem. FEBS Lett.424: 89 –94.
10. Roberts RB, et al.1998. Molecular epidemiology of methicillin-resistant Staphylococcus aureusin 12 New York hospitals. MRSA Collaborative Study Group. J. Infect. Dis.178:164 –171.
11. Sakoulas G, et al.2005. Reduced susceptibility ofStaphylococcus aureusto vancomycin and platelet microbicidal protein correlates with defective autolysis and loss of accessory gene regulator (agr) function. Antimicrob. Agents Chemother.49:2687–2692.
12. Sakoulas G, et al.2002. Accessory gene regulator (agr) locus in geograph-ically diverseStaphylococcus aureusisolates with reduced susceptibility to vancomycin. Antimicrob. Agents Chemother.46:1492–1502.
13. Schweizer ML, et al.2011. Increased mortality with accessory gene reg-ulator (agr) dysfunction inStaphylococcus aureusamong bacteremic pa-tients. Antimicrob. Agents Chemother.55:1082–1087.
14. Shopsin B, et al.2008. Prevalence ofagrdysfunction among colonizing Staphylococcus aureusstrains. J. Infect. Dis.198:1171–1174.
15. Shopsin B, et al.2010. Mutations inagrdo not persist in natural popu-lations of methicillin-resistantStaphylococcus aureus.J. Infect. Dis.202: 1593–1599.
16. Shopsin B, et al.1999. Evaluation of protein A gene polymorphic region DNA sequencing for typing ofStaphylococcus aureusstrains. J. Clin. Mi-crobiol.37:3556 –3563.
17. Shopsin B, et al.2003. Prevalence ofagrspecificity groups among Staph-ylococcus aureusstrains colonizing children and their guardians. J. Clin. Microbiol.41:456 – 459.
18. Traber K, Novick R.2006. A slipped-mispairing mutation inAgrAof laboratory strains and clinical isolates results in delayed activation ofagr and failure to translate delta- and alpha-haemolysins. Mol. Microbiol. 59:1519 –1530.
19. Traber KE, et al.2008.agrfunction in clinical Staphylococcus aureus isolates. Microbiology154:2265–2274.
20. Vallone PM, Butler JM.2004. AutoDimer: a screening tool for primer-dimer and hairpin structures. Biotechniques37:226 –231.
21. Verjat T, Cerrato E, Jacobs M, Leissner P, Mougin B.2004. Multipara-metric duplex real-time nucleic acid sequence-based amplification assay for mRNA profiling. Biotechniques37:476 – 481.
22. Vet JA, Marras SA.2005. Design and optimization of molecular beacon real-time polymerase chain reaction assays. Methods Mol. Biol.288:273– 290.
23. Wright JS, III, Jin R, Novick RP. 2005. Transient interference with staphylococcal quorum sensing blocks abscess formation. Proc. Natl. Acad. Sci. U. S. A.102:1691–1696.
24. Zhao Y, et al. 2009. Rapid real-time nucleic acid sequence-based amplification-molecular beacon platform to detect fungal and bacterial bloodstream infections. J. Clin. Microbiol.47:2067–2078.
25. Zuker M.2003. Mfold web server for nucleic acid folding and hybridiza-tion predichybridiza-tion. Nucleic Acids Res.31:3406 –3415.
FIG 3Duplex NASBA assay amplification curves for isolates with differentagr functionalities. (A) Example of the amplification curve for anagrmutant iso-late in which TTPgyrBis lower than or close to TTPRNAIII(ratio,⬍1.10); (B)
example of an amplification curve for anagr⫹isolate, in which TTPRNAIIIis
considerably lower than TTPgyrB(ratio,⬎1.10). Hatched rectangles indicate the difference in TTP between RNAIII andgyrB.