Procedia - Social and Behavioral Sciences 96 ( 2013 ) 2611 – 2620
1877-0428 © 2013 The Authors. Published by Elsevier Ltd. Open access under CC BY-NC-ND license. Selection and peer-review under responsibility of Chinese Overseas Transportation Association (COTA). doi: 10.1016/j.sbspro.2013.08.292
ScienceDirect
©13th COTA International Conference of Transportation Professionals (CICTP 2013)
Correlation Analysis for Tensor-based Traffic Data Imputation
Method
Huachun Tan
a,*, Zhongxing Yang
a, Guangdong Feng
a, Wuhong Wang
a, Bin Ran
b aDepartment of Transportation Engineering, Beijing Institute ofa Technology, Beijing 100081, PR China
bDepartment of
b Civil and Environmental Engineering, University of Wisconsin-Madison, Madison, WI 53706, USA
Abstract
The phenomenon of missing data in traffic has a great impact on the performance of Intelligent Transportation System (ITS). Many imputation methods have been proposed to estimate the missing traffic data. Recently,a tensor-based traffic volume imputation method has been proposed. In this paper, we focus on the underlying mechanism of tensor-based method from the viewpoint of intrinsic multi-correlations/principle components of the traffic data, and try to recommend suitable tensor pattern for traffic volume imputation. Experiments on PeMS database show that the tensor-based method outperforms matrix-based methods, and using the recommended tensor pattern achieves better performances.
© 2013 The Authors. Published by Elsevier B.V.
Selection and/or peer-review under responsibility of Chinese Overseas Transportation Association (COTA).
Keywords: tensor completion; traffic data imputation; principal component analysis; single value decomposition;
*Corresponding author. Tel. +86-10-68914582; fax: +86-10-68914582. E-mail address: [email protected] .
© 2013 The Authors. Published by Elsevier Ltd. Open access under CC BY-NC-ND license.
1. Introduction
Research on missing data in transportation information system (TIS) has aroused extensive concern of traffic community in recent years. Due to the malfunctions of detectors and communication equipments, traffic data(i.e., traffic volumes, occupancy rates, and flow speeds) often confronts with the lost data phenomenon, which will greatly reduce predicting performance of the traffic volume data(WILLIAMS et al., 1998; Xu et al., 2010) and also influence some other normal function of intelligent traffic system. Consequently, it is necessary to develop a high imputation performance methodology to estimate the missing data.
Various imputation methods have been studied for addressing missing data imputation. There are three kinds of imputation methods based on the form of traffic data model: vector based method, matrix based method and tensor based method. Several vector based methods such as historical (neighboring) imputation methods (Ni et al., 2005), spline (including linear)/regression imputation methods (Chen and Shao, 2000; Allison, 2001), and autoregressive integrated moving average (ARIMA) models (Zhong et al, 2004) are frequently used in traffic data imputation. Those methods only deal with the simple case when only few data are missing since vector pattern data covers a little spatial-temporal correlation; (Bayesian Principal Component Analysis) BPCA and (Probabilistic Principal Component Analysis) PPCA, which make use of two modes traffic date with matrix pattern, have been proved to be more effective with higher accuracy than the other conventional vector based imputation methods. (Qu et al., 2008; Qu et al., 2009). Those imputation methods can work well. The two modes matrix based methods incorporate more temporal-spatial information in a multi-day or multi-link traffic data with missing data.
Recently, a tensor based model in traffic data imputation (Tan et al, 2013) has been proposed. according to the multi-modes correlations of traffic data, traffic volume data can be formulated as multidimensional tensor pattern, which keeps the multidimensional characteristics and contains the spatial-temporal correlations. Tensor-based methods have been proved being a good analytical tool for dealing with the multidimensional data. For example, notably chemometrics and psychometrics, tensor methods have been developed and used with great success since the 1960s. The Tensor-based imputation methods can capture the global structure of the data via a high-order decomposition (named tensor decomposition). Tensor decomposition has great ability for multidimensional modeling with many advantages such as fast convergence, high accuracy, and low computational efforts (Ishteva, 2009).
The above imputation methods make use of the established intrinsic relations of traffic flow. Such relations in traffic data can be considered as periodicity or correlation in each mode. In most cases the spatial-temporal correlation of traffic data is the basis of most imputation algorithm. PCA is a classical data analysis technique that finds linear transformation of data that retain the maximal amount of variance. Principal component analysis with missing data (PCAMD), which is originally developed by Ruhe (1974), is an extension of PCA for dealing with a high rate of missing multivariate data. The principal components capture the correlations between different variables, which allows for reconstruction of missing values from the observed ones(BG Tabachnick et al. 2001). The tensor based decomposition is also a PCA(Kolda, 2009) and, the tensor based methods achieve better result than the history methods, but the mechanism why it can be introduced to traffic data imputation and how to better construct the tensor pattern for traffic data have not been fully explored.
In this paper, we aim at analyzing the mechanism from the aspect of principal component which can well capture the correlation in each mode and then a suggestion of tensor pattern for volume data is proposed based on the mechanism and some experiments are conducted.
The rest of this paper is arranged as follows. We introduced the necessary tensor basis in section 2. Then in the section 3, the correlation of traffic data from spatial and temporal angle are discussed,. The principal component analysis of tensor based traffic data are compared to matrix based traffic data to reveal the advantage. In the section 4, some experiments are conducted to verify the advantage of tensor based imputation method and to
compare the estimated principal component precision in different modes. At last we make our conclusion and discuss about the future work.
2 Notations and tensor basis
In this section, we partially adopt the notation denoted as (13, 14]. Throughout this paper, third-order tensors are
denoted by calligraphic letters ( -face capitals ( ), vectors are
represented by bold-face lower-case letters ( ), and scalars are written as lower-case letters ( ). Thus,
for example, the element of a third-order tensor is .Some special scalars, such as upper bounds of
indices, are denoted by capital letters (I, , , ) as well. The symbol
product of two sets.
The n-mode (matrix) product of a tensor with a matrix is denoted by and
is size . In terms of flattened matrix, the n-mode product can be expressed as
Ǥሺͳሻ
An N-way tensor can be rearranged as a matrix; this is called matricization, also known as unfolding or
n-th mode on a tensor of size is defined as ( )
= . are defined as follows
ǡሺʹሻ
.
Then the mode-n rank of , denoted , is the column rank of .
An N-way tensor is rank one if it can be written as the outer product of N vectors, i.e.
ሺ͵ሻ
Two particular tensor decompositions can be considered to be higher-order generalization of the matrix singular value decomposition: CANDECOMP/PARAFAC (CP) and Tucker3. CP decomposes a tensor into a sum
of component rank-one tensors. For example, given a three-order tensor , it can be written as:
(4)
components s vector. Tucker decomposition is a
multidimensional SVD. It decomposes a tensor into a core tensor multiplied (or transformed) by a matrix along
each mode. Thus, in the three-way case where , we have
ሺͷሻ
Here, is called the core tensor and its entries show the level of interaction between the different
components. , , are the factor matrices (which are usually orthogonal) and can
be thought of as the principal components in each mode. In fact, the CP model can be viewed as a special case of Tucker model where the core tensor is super-diagonal and the mode rank along each mode is equal (Kolda and Bader, 2009).
For a tensor of size , its norm is . We also define a weighted norm as follows.
Let and be two tensors of size . Then the -weighted norm of is
Let be the observed tensor that stores all the observed values, such that
ሺሻ
3 Traffic data analysis
There are many kinds of traffic parameters such as traffic volume, occupancy rate, and volume speed etc. In this paper, we focus on the traffic volume data which refers to the number of vehicles passing certain road detection in a set time. From the definition, it is easy to find the time and space characteristics of traffic volume data. We firstly analyze the spatial-temporal correlations of traffic data and apply principal component analysis to mine the intrinsic characteristic of each mode, and then give a recommend tensor pattern for volume data.
The test data is downloaded from PeMS traffic volume datasets (California Performance Measurement System, http://pems.eecs.berkeley.edu ) for this study. The selected 10 detectors locate at north Golden Gate Hwy, Stockton city, San Joaquin County, California, as shown in Fig.1. The traffic volume data was recorded every 5 minutes. Therefore, a daily loop detector contains 288 elements. the whole period of the data lasts for 56 days, from April,4 to May 29, 2011.
Fig.1 Selected detectors in Golden Gate Hwy, California US
3.1 Spatial-temporal correlation analysis of volume data
Traffic volume data can be constructed into a matrix model which has been studied widely. For example, the collected data of No.1018310 detector can be constructed as 288 56 or 56 288 matrix which infers that 288 time points in a day lie in a column or row.
The matrix based traffic data model well mines the relationship of time series from day to day and time to time. To quantitatively analyze the traffic volume data, Pearson correlation coefficient and similarity coefficient is
ሺͺሻ R(i, j) refers to correlation coefficient matrix which detects linear dependency of two days time series. The S
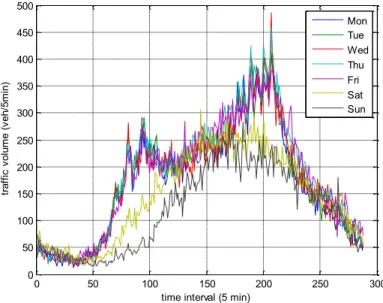
means similarity coefficient which measures the average correlation efficient in matrix R. Each day s volume in a successive week is plotted in fig.2. And the similarities in each mode are compared in table 1.
Fig.2 The daily profile of the traffic volume data from Monday to Sunday Table 1 the similarity coefficients of four modes
Mode Size Similarity coefficient
Time 0.163 Day 0.903 Weekday 40 288 0.957 Weekend 16 288 0.945 Week 0.955 Hour 24 12 0.038 Link 0.969
As is shown in Table 1, the similarity coefficient in time mode is only 0.163, which is much lower than the other modes. This is because traffic volume of a set time is non-periodic. The similarity coefficients of day mode, week mode and link mode are more than 0.9, which shows that there are strong correlations in above three modes. Especially, the similarity coefficient of week mode is 5 percentages higher than day mode. The reason is that week trend remains little change except for some holidays.
0 50 100 150 200 250 300 0 50 100 150 200 250 300 350 400 450 500
time interval (5 min)
tr affi c v ol um e ( ve h/5 m in ) Mon Tue Wed Thu Fri Sat Sun
In the day mode, the similarity coefficient is 0.903. The similarity in correspond time mode is 0.16 which is much lower than the day mode. This result reveals that the traffic data are dominated by daily periodicity.
We could find that the similarity coefficient between a week is relatively high at 0.953 which is 5 percentage higher than the day mode. It reveals that the week s time series has a more robust periodicity, because the week trend remains little change except for some holidays. Weekends trend varies a lot from the weekdays . Because most urban traffic volume are dominated by commuters going to work in the morning and returning in the evening. This so-called typical pattern tends to be repetitive except the weekends. The similarity of weekend mode and weekday mode are both about 5 percent than the day mode.
In the link mode, multi detectors traffic volume data also contains some spatial correlation. Consider for transition property (Treiber, 2002), as a character of traffic flow theory. It has been revealed that, in congested traffic perturbations travel upstream at an near-constant speed, while in free traffic information propagates downstream. As a result, the information of traffic volume is highly correlated with its nearby detector volume data, and this relationship decline as the distance increases.
Some study (Stathopoulos and Karlaftis, 2001) also revealed the cross-correlation characteristics namely the Pearson correlation of two time series data as a function of a time-lag for the various loop locations. The results also shows that the series for all detector locations demonstrat strong positive autocorrelation of lags. And the lag time is influenced by distance between the detector locations. The parallel detectors in different directions of a link also have strong correlation though their volume varies a lot sometimes.
Traffic volume data of ten detectors of Wilson Way are selected in a single day with no congestion and the similarity in this link mode is 0.969, which is the highest of all mode. The location of suburban area with little congestion and all the detectors distribute closely to each other result the high correlation.
Above analysis shows that the single detector data has multiple mode correlations, which is including not only day to day but also week to week correlation. And spatial correlation also exists in the data of multiple detectors. There are existing very high correlations for traffic volume data in multiple modes.
3.2 Component analysis of traffic data in different model
Principal component based imputation is a popular approach to the problem of missing value reconstruction. The estimated principal components capture the correlations between different variables. Many applications of principal component analysis concern exploratory data analysis. From a plot of the first few principal components, one is often able to detect data structures which are of scientific importance.
In multivariate data analysis, principal components analysis (PCA) of a data matrix A is a basic tool. PCA decomposes X into a matrix W constructed by principal components and a loading matrix V.
(9) This decomposition is particularly useful for converting A to a few informative plots (score plots and loading plots) and for modeling the systematic structure in A. PCA is usually handled by computing eigenvectors of ATA
(the covariance matrix) to gain V or AAT (the association matrix) to gain U via the SVD algorithm. Though the
vector in W is usually considered as principal components, in this paper, the principal component are defined as vectors in U for mining the information in each row to describe each mode s characteristic. PCA is closely related with SVD, and the covariance matrix reflects the correlation of each mode. Each mode s correlation is captured by the factor matrix U or V.
If original traffic data sets are constructed as a three dimension tensor model of size 8(week)
7(day) 288(time). In a HOSVD, three mode s principal components can be synchronously computed from SVD
of each unfolding matrix A(n) (8(week) 2016(time) matrix, 7(day) 2304(time) and 288(time) 56(day)
matrix). The result of HOSVD is three factor matrixes, U1, U2, U3 with mode-n-rank R1, R2, R3 respectively.
the original data as , and the S-core tensor means the multi-weights of each principal component in different factor matrix. And the CP based tensor decomposition of traffic data can be view as , is the r-th principal component of the matrix U(n), and the mode-n-rank satisfies
R1=R2=R3, the represents the weights of each rank one tensor constructed by principal components. Each mode
of the tensor can encode a kind of correlation. The multi-mode property of tensor would help keeping the original structure of traffic data and employing enough spatial-temporal information in subsequent missing data estimation process.
The matrix based model of above traffic data is frequently construct as A comparison of HOSVD
of tensor based model to matrix SVD of matrix based model is conducted. the time mode A(3) of 288(time)
56(day) is the same with transpose of the matrix model. And the another two mode matrix A(1) and A(2) of can
be viewed as a isolation of the first day mode of matrix based model and two SVDs are conducted to each correspondent matrix respectively. The resulting two mode factor matrix represent more details in their component. Especially for the week mode which has especially high similarity coefficient of 0.95. However, the week correlation and information has not been fully explored in a matrix. As a result, more information may be taken advantage in a tensor based traffic model and decomposition
The multi-detector traffic data chosen in Wilson Way could also be generated as a tensor based data such as . Such complex traffic data is hard represent in matrix pattern without loss of information If we
combine all the temporal data into a dimension and transfer the, it inevitably
losses some temporal correlation in day and week. As the tensor pattern can represent multi-correlations in traffic data while keeping the structure of traffic data. From the view of exploring more intrinsic correlations of the traffic data, tensor-based representation is a better way than matrix-based representation.
3.3 data pattern comparison
From the above analysis of principal component and correlations of traffic data, and to make full use of the modes correlation and traffic spatial-temporal information, traffic data need to be constructed into multi-way data set.
Some suggestions are proposed. Fortunately, tensor pattern based traffic data can be well used to model the multi-dimensional traffic data. This helps keeping the original structure and employing enough traffic spatial-temporal information. For a single detector, if the period of traffic data surpass two week, we suggest to construct
the data as a tensor , day stands for 7 days in a week, the time stands for 288 time point in
each day with 5 minutes sample time. As we find that the correlation between each hour is low, the data model is not suggested.
Based on the high correlation of weekend and weekday mode, we can divide a tensor based traffic pattern
into two tensors, and which will take
use of the correlation in weekends and weekdays respectively. Inner correlations are utilized respectively which may result a better performance in missing data imputation process.
For multi-detectors, traffic data can be constructed as a tensor . Consider for
example of traffic data of ten detectors within 56 days can be represented as 4. Experiments
In this section, the tensor based imputation algorithms are compared to the matrix based imputation algorithms to test the tensor model s advantage, and to verify the assumption that higher correlations in a tensor may achieves better results.
Two classic tensor based imputation algorithms, EM-Tucker3 and CP-Wopt, are evaluated in this section. BPCA, due to its high performances reported in (Qu et al., 2009), is chosen as matrix-based method for
comparison. For comparing evenly, the same data is used for all methods. These imputation methods are all implemented under the Matlab environment. All the experiments are conducted and timed on the same desktop
with an AMD thlon(tm) 640 Processor 3GHZ CPU and 4GB RAM.
4.1 Randomly missing data imputation
The imputing performance is evaluated by the root mean squared error (RMSE) between the estimated missing
points and the original data points . RMSE is a commonly used error criteria, which reflects the average
performance for the missing data imputing. It is defined in (Qu et al., 2008; Qu et al., 2009),
ሺͳͲሻ
where and are the m-th elements of the known real value and the estimated value, respectively.Mis the number of missing data, which can be used to calculate the missing ration, as follows,
(11) wherermeans the ratio of missing data,Nmeans the total data number of test data.
4.2 Imputation methods verification
There are three kinds of imputation methods for dealing with missing traffic data in the past literatures, vector-based, matrix-based and tensor-based. Comparing with vector based imputation methods, matrix based imputation methods can product a high performance, which are usually used. In recent years, tensor based imputation method has been proposed to deal with the missing traffic data. In section 3, we analyze the multi-mode correlations of traffic data. In above three kind methods, tensor based methods can employ the multi-multi-mode correlations and keep the multi-dimensional structure. To verify the performance of those methods, we chose the classic matrix based imputation method (BPCA) and the popular tensor based imputation methods(EM-Tucker and CP-Wopt). The test data is downloaded from PeMs traffic volume datasets (California Performance Measurement System, http://pems.eecs.berkeley.edu ), which lasts for 56 days, from April 4 to May 29, 201. For
tensor-based methods, we model the data set as a tensor of size . And for the matrix-based methods,
the data is modeled as a 56 288 matrix. The missing ratio is set from 10% to 90% and the missing data areff produced randomly.
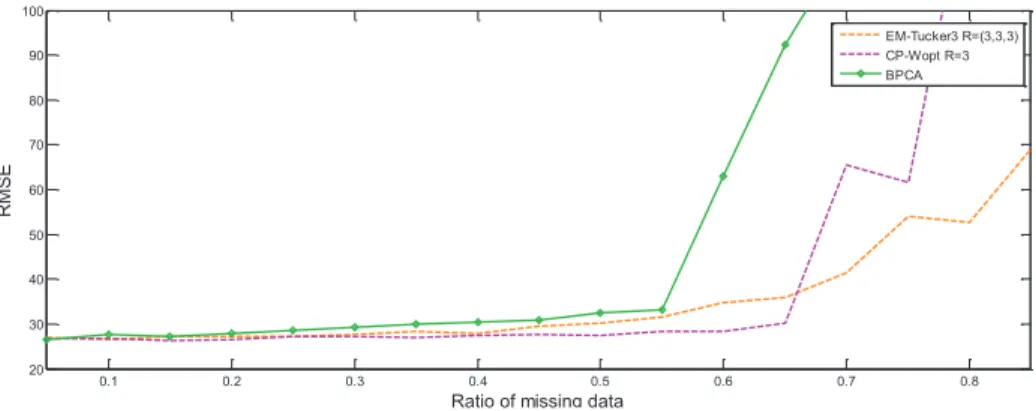
Fig. 3 RMSE curves for tensor-based methods and matrix based method.
0.1 0.2 0.3 0.4 0.5 0.6 0.7 0.8 20 30 40 50 60 70 80 90 100
Ratio of missing data
R M SE EM-Tucker3 R=(3,3,3) CP-Wopt R=3 BPCA
Fig. 3 shows that RMSE curves for tensor-based methods outperform matrix-based method (BPCA) at almost all the missing rates. The reason is that the tensor-based methods can utilize the spatial-temporal information of multiple modes simultaneously, while matrix-based method only mines data correlations in one mode. Furthermore, the imputation performance of BPCA degrades sharply when the missing ratio is higher than 55%. But tensor-based methods can work when missing ratio is up to 0.8. Hence, tensor based imputation method has a significant advantage for dealing with missing traffic data.
4.3 Missing data imputation for recommend data pattern
Usually, traffic data are formulated to tensor pattern with in single detector. After
comparison analysis on tensor pattern for traffic data in section 3, the tensor pattern, is
our recommending data pattern. To fairly verify this two tensor pattern of traffic data, we chose the same test data set. The whole period of test data lasts for 56 days, from April 4 to May 29, 2011, which is downloaded from PeMs traffic volume datasets (California Performance Measurement System, http://pems.eecs.berkeley.edu ). The
test data can be constructed into and respectively. Here, the EM-Tucker3
imputation method is adopted to do the experiment.
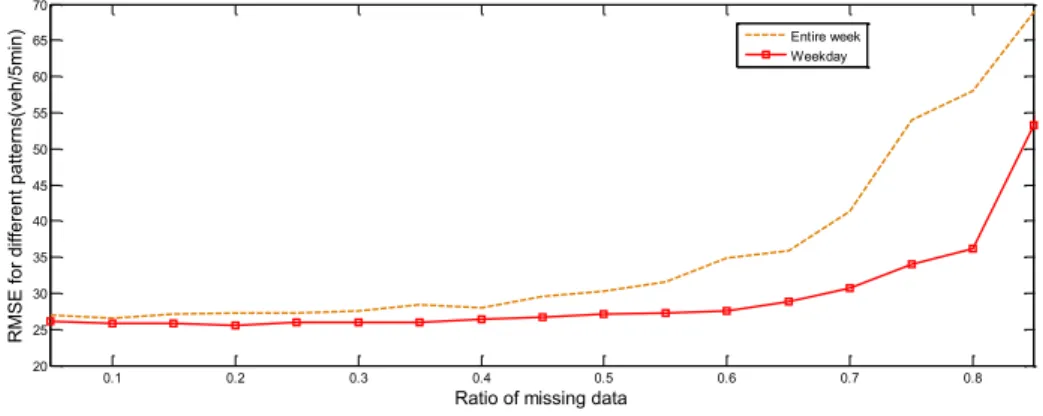
Fig. 4 RMSE curves using entire week and weekday s data
As is shown in Fig.4, the RMSE curve of weekday model is lower than the entire week model s, the gaps between weekday pattern and week pattern is rising up with missing ratio increasing. The experiment results show that our recommending data pattern is superior to the common tensor pattern for traffic data. Both data patterns contain three mode correlations. The only difference is that weekday pattern has higher similarity coefficient than week pattern in week mode. Hence, constructing tensor pattern with high similarity for traffic data is useful to improving the imputation performance.
Based on the above analysis, tensor based imputation method can product a higher imputation performance than other imputation method to some extent. Tensor pattern is also a critical factor to impacting imputation performance. The way to constructing the tensor pattern for traffic data is very important.
5. Conclusion
In this paper, we try to explain why and how to build a tensor based traffic model in traffic data imputation from the aspect of multi-correlation/principal component. The tensor based traffic model is better than the matrix based model because tensor based approach can keep the nature structure of traffic data while tensor based approach can utilize the intrinsic multi-correlations in traffic data. The comparisons of tensor based imputation
0.1 0.2 0.3 0.4 0.5 0.6 0.7 0.8 20 25 30 35 40 45 50 55 60 65 70
Ratio of missing data
RMSE for different patterns(veh/5min)
Entire week Weekday
approach and matrix based imputation approach on PeMS database verify tensor s advantage in traffic imputation. We recommend several tensor patterns which may be more suitable for traffic volume imputation under the assumption that using higher multi-mode correlations tensor may produce better performance. The experiment results verify that the two recommended data patterns (week by day by time three order tensor, or the divided weekdays and weekends sub-tensors) achieve better performances in missing traffic volume estimation.
In the experiments, the necessary number of components or the rank in each mode to reconstruct the original data has not fully explored from the angle of principal components. It s meaningful to investigate this issue in our future work.
Acknowledgements
This work was supported by National Natural Science Foundation of China (61271376, 61171118, 91120010 and 91120015), and Beijing Natural Science Foundation (4122067).
References
Acar, E., Dunlavy, D. M., Kolda, T. G., Mørup, M. (2011). Scalable Tensor Factorizations for Incomplete Data.Chemometrics and Intelligent Laboratory Systems 106(1), 41-56
Kolda, T.G., Bader, B.W. (2009). Tensor decompositions and applications. SIAM Review 51(3), 455-500.
Tan, H., Feng, G., Feng, J., Wang, W., Zhang, Y.J., Li, F. (2013). A Tensor-based Method for Missing Traffic Data Completion. Transportation Research Part C, 28, 15-27.
Ishteva, M. (2009). Numerical methods for the best low multilinear rank approximation of higher-order tensors. PhD thesis, Department of Electrical Engineering, Katholieke Universiteit Leuven
Qu, L., Li, L., Zhang, Y., Hu, J., (2009). PPCA-Based missing data imputation for traffic flow volume: a systematical approach. IEEE Transactions on Intelligent Transportation Systems 10 (3), 512 522.
Qu L., Zhang Y., Hu J., Jia L., and Li L., 2008. A BPCA based missing value imputing method for traffic flow volume data, in Proc. IEEE Conf. Intell. Vehicle Symp, Eindhoven, 985 990.
Tucker L. R. Implications of factor analysis of three-way matrices for measurement of change, in Problems in Measuring Change, C. W. Harris, ed., University of Wisconsin Press, 1963: 122 137.
Tabachnick, B. G., Fidell, L. S., & Osterlind, S. J. (2001). Using multivariate statistics.
Harshman, R. A., & Lundy, M. E. (1994). PARAFAC: Parallel factor analysis.Computational Statistics & Data Analysis, 18(1), 39-72. Sun, J., Tao, D., & Faloutsos, C. (2006, August). Beyond streams and graphs: dynamic tensor analysis. In Proceedings of the 12th ACM SIGKDD international conference on Knowledge discovery and data mining (pp. 374-383). ACM.
Grung, B., & Manne, R. (1998). Missing values in principal component analysis.Chemometrics and Intelligent Laboratory Systems, 42(1), 125-139.
Treiber, M., & Helbing, D. (2002). Reconstructing the spatio-temporal traffic dynamics from stationary detector data. Cooperative Transportation Dynamics, 1(3), 3-1.
sRuhe, A. (1974). Numerical computation of principal components when several observations are missing. University of Umea, Institute of Mathematics and Statistics Report (mimeographed).
Stathopoulos, A., & Karlaftis, M. G. (2001). Spectral and cross-spectral analysis of urban traffic flows. In Intelligent Transportation Systems, 2001. Proceedings. 2001 IEEE (pp. 820-825). IEEE.
WILLIAMS B M, DURVASULA P K, BROWN D E. Urban freeway traffic flow prediction: Application of seasonal autoregressive integrated moving average and exponential smoothing models. Transportation Research Board 1644, Transportation Research Board. Washington. DC: TRB. 1998: 132-141