Borrowing Practices of College Students and Parallel
Debt Knowledge Management
Chad Smith, Clarion University of Pennsylvania Gustavo Barboza, Clarion University of Pennsylvania
ABSTRACT
This paper examines the effects of debt management practices that college students have while viewing their current borrowing practices. Empirical estimates of an Order Probit model using a sample of 283 students indicates that academic status and age are both positively related to the amount of debt a student carries. In this regard females are more likely to hold debt compared to males. The coefficient for the Work variable is not significant indicating that students leverage themselves above their means, and more importantly even when they are not generating revenue. This high level of debt relative to their income implies that students live beyond their means and consequently developing unhealthy financial management practices. Overconfidence, lack of personal financial knowledge and easy access to credit are at the core of high debt accumulation for college students. Furthermore, the exuberant irrational behavior of over borrowing is reinforced by students’ academic status, gender (females) and age.
INTRODUCTION
Irrational exuberance in the financial markets in the last years resulted in unnecessary risk behavior by investors and borrowers alike. Over confidence on the sustainability of market performance, and significant reliability on the practical implications of the efficiency market hypothesis, let to excessive lending under what are now clear moral hazard situations. These practices resulted in an alarmingly high rate of bankruptcies that today continues to reveal the depth of the financial crisis as risk loving behavior allowed individuals and firms to borrow beyond their capacities. These unhealthy business practices culminated in the most serious and profound economic recession since the Great Depression. In this regard, lenders expanded credit to those technically less qualified to borrow, yet promising an above average return on the investment. High levels of leveraging resulted in inability to fulfill financial obligations and consequently the necessary liquidation of assets. Incorrect asset pricing valuation made it even more difficult for lending institutions to recuperate the total amount of principal lent. Others suffer today what the markets call, under the water equity as the value of their assets are less than the amount borrowed, as downward price correction in assets leaves customers exposed. All in all, one cannot stop but wonder, how and why managers and decision makers engage in this
irrational behavior, and whether these individuals and institutions thought that their behavior was justified by the prevalent market conditions. This irrational behavior –both on the lenders and borrowers- whether justified or unjustified, can be reformed however. Under these circumstances, reinforcing financial responsibility and increasing financial literacy, through active teaching and education programs, becomes a priority. It is in this regard, that we propose to study borrowing practices of individuals and parallel knowledge on debt management, to determine if overconfidence and/or lack of knowledge on debt management are key determinants to total debt.
Notwithstanding, explaining how we arrived and failed to anticipate the current financial crisis remains a conundrum. Nevertheless, it is reasonable to assume that irrational financial management or overconfidence in the capabilities of superior financial performance under uncertain risky scenarios is at the core of the current financial tribulations. In this regard, personal financial turmoil can easily migrate to the workplace and affect workers performance negatively, and spillover to the dynamics in the work place. Thus, personal financial knowledge – or the lack of it – can directly affect the financial performance of managers’ practices at the organization’s or corporation’s level. For instance, Kim, Sorhaindo, Garman (2006) suggest “[c]lients with high levels of financial stress are more likely to experience higher levels of absenteeism; thus spending work hours handling personal finances, which decreases the time they are at work” (p. 474).They continue arguing that financial education and assistance for employees with financial strains might provide direct benefits to companies’ performance. Thus we post the question, what is the current, if any, responsibility of educators to prepare students for life’s financial challenges? Kim, Sorhaindo, and Garman (2006) note “the great majority of secondary schools and colleges do not offer students courses in personal finance” (p.474). Ornelas and Kleiner (2003); Chen and Volpe (2002); and Kim, Garman and Quach (2005) bring forth the hypotheses that absenteeism, health issues, job satisfaction, and reduced productivity can result from personal financial stress. Taking this into consideration, a need to educate students becomes apparent.
This paper proceeds as follows. The next section reviews the most relevant literature on the personal financial knowledge and debt management. The third section describes the research design, the estimation model and the data. We then provide a thorough interpretation of the Order PROBIT model estimations and conduct the corresponding impact analysis. The last section presents some general conclusions and policy recommendations.
LITERATURE REVIEW
The issues of financial literacy, debt management and college education remain a relatively unexplored topic in the field of financial education. In particular the literature on financial knowledge of college students reveals the existence of a significant gap between the formal and informal means of instruction. A series of studies, (Chen and Volpe 1998 & 2002; Lusardi and Tufano 2009; Peng et al 2007; Wells 2007; Allen et al 2007; among others), explore the causes and implication of how financial realms relates to stress, education, the role gender, etc. This literature review focuses on financial literacy, financial experiences, education delivered, and influences and experiences of college students.
Chen and Volpe (1998) studied financial literacy levels and financial decision making skills of students involving a sample of 924 college students from 13 different campuses. Based on a 55.56% failing median score on a financial knowledge test, Chen and Volpe (1998) reported
that 89% of students were able to make good spending decisions in a hypothetical situation if he or she had higher levels of financial literacy. In comparison only 68% of the students made adequate choices when she or he had lower levels of financial literacy. Their study also found that demographic variables such as age, gender, class ranking, and work experience are significant predictors of better decision making process regarding spending habits.
Further research by Chen and Volpe (2002) placed a larger emphasis on gender differences among college students as a determinant for personal financial literacy performance. The findings demonstrate that on average women know less about personal finance than men. They conclude that women have less interest and confidence in personal finance. Another finding reveals business majors were more likely to know about personal finance than non-business majors. The participants also noted that they acquire financial knowledge primarily through informal channels – such as parents- and indicated not deriving much financial knowledge through formal education. Similarly, Allen, Edwards, Hayhoe, and Leach (2007) surveyed 1,293 college students for imagined interactions they have with parents about money and credit. They found interaction pleasantness was greatest when parents worked together to form a plan for debt and lowest when parents argued.
Along the same lines Peng, Bartholomae, Fox, and Garvener (2007) investigated the impact of personal finance education delivered in high school and colleges. Using a sample size of 1,039 alumni, Peng et al measured investment knowledge, savings, financial education, financial experience, income and inheritance, and demographics. The results of the survey provided significant evidence in support of the hypothesis that a class on personal finance while attending college resulted in improved investment knowledge. In addition, the study finds that financial experience appeared to have a positive relationship with investment knowledge.
On a related issue, Lusardi and Tufano (2009) studied the set of financial experiences of individuals, above and beyond the traditional behavior of debt management. Using a sample size of 1000 individuals, they report that low levels of debt literacy are the norm for elderly, women, certain minorities, and people at the lower income distribution brackets. In general, Lusardi and Tufano note that those with less financial knowledge paid a disproportionately larger percentage of fees and finance charges than otherwise. In this regard, the results point out that only about one-third of the population seems to comprehend how compounding interest is calculated or even how credit cards function. Their study revealed that ignorance in financial literacy can be a costly mistake.
However, Lusardi, Mitchell, and Curto (2009) using a dataset from the NLSY97 including 7,138 respondents found that only 27% of those surveyed possessed knowledge in basic financial concepts concluding that most young adults are not equipped to make financial decisions. The research reveals women and minorities show even less of an understanding of financial literacy. An interesting aspect to the research found that young adults receive financial literacy through two main sources, parents and the education system. Those young adults with college educated parents tend to have a better understanding of financial concepts.
Another relevant issue brought up in the literature is that relating to the attitudes concerning money and debt for college students. For instance, Wells (2007) studied why student were not concerned about mounting personal debt and the effects of such debt in their futures. Wells’ (2007) findings point out to the interesting observation that students optimism was greatest about debt as freshmen and sophomore’s, whereas an observed reversal on optimism takes place for graduate students, seniors, and juniors as they grow more concerned about the accumulated debt. Roberts and Jones (2001) investigated the role money attitudes and credit
cards played in compulsive buying among college students in the United States. Their sample size consisted of 406 college students with an approximately equal distribution between females and males. Their findings support the common belief that credit cards have a significant role in the compulsive buying of college students and consequent debt accumulation. Furthermore, they note the existence of a close relationship between attitudes (power, prestige, distrust, and anxiety) and compulsive buying.
Borden, Lee, Serido, and Collins (2007) conducted a pilot study on the influence of changing college students’ financial knowledge, attitudes, and behaviors toward the use of credit cards after a 1 ½ hour educational seminar. The findings suggest the seminar effectively increased the financial knowledge from pre-testing to post-testing. In this regard, Borden et al (2007) results support those from Volpe et al., where male college students show more financial knowledge than female students.
Lastly, DesJardins, Ahlburg, and McCall (2002) used a sample size of 3,975 students over 22 trimesters focusing on how changes in financial-aid packaging affect students’ departure decisions over time. The results suggest that financial aid packages do reduce first stopout probabilities compared to no financial aid being provided. The researchers also discovered not all financial aid had the same impact. Grants had no impact on averting stopout. However, scholarships and work/study employment had an impact on departures depending on the year and rank of the students.
This literature review provided findings that suggest college students who are more financially literate make better financial decision. It also supports gender, personal, and financial experiences play a role in good financial decision making. Our agenda for this research is to understand more about the debt college students have and their perceptions of financial management.
THE DATA
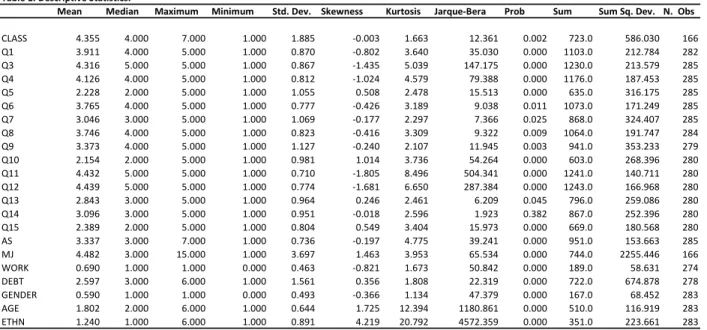
Data for this research comes from a survey administered to a sample of 283 graduate and undergraduate students attending a Pennsylvania Higher Education System University. For the dependent variable, defined as the total amount of existing debt at the time of the survey, the following order is used: 1=$0-$2,000, 2=$2,001-$5,000, 3=$5,001-$10,000, 4=$10,001-$25,000, 5=$25,001-$50,000, and 6=greater than $50,000. The independent variables of current debt status include a series of demographic characteristics such as academic status, major, employment, gender, age, and ethnicity. We complete the list of independent variables with series of variables oriented to assess the participants’ knowledge of debt management while trying to understand his or her own current borrowing practices. The answer scales ranged from strongly disagree, disagree, neutral, agree, and strongly agree. The questionnaire was the result of ten years of consulting experience by one of the authors providing personal financial services. Table 1 presents the descriptive statistics and a copy of the survey is available in the Appendix.
<<<Insert Table 1 here>>> MODEL DESCRIPTION
Since students’ responses are coded using a categorical order variable, we need to use an order dependent variable model to determine the effects of a series of independent variables on the discrete ordered student debt amounts. The basic model description has the following general specification:
(1) where are assumed independent and identically distributed random variables as usual, is the matrix of explanatory variables, β is the vector of coefficients to be estimated and is unobserved. The vector of independent variables includes both demographic elements such as gender, age, work status, and class standing; and financial literacy variables designed to capture individual’s knowledge of budgeting and finance as they relate to debt management. According to Greene (2003) what one does observe is
(2)
. :
where are unknown parameters to be estimated with . It follows that the probabilities associated with achieving each event are given by
(3a) (3b) (3c)
Under the condition that , then all probabilities will be positive. It is relevant to keep in mind that in order to provide a meaningful interpretation of the results, we first need to transform the estimated coefficients from equation 1 into marginal effects. Conventional use of Ordinary Least Square estimates is not appropriate when using discrete data. Alternatively, in the order probit model the marginal effects of x on the probabilities of occurrence of each of the events are not equal to the coefficient estimates β as in the conventional LS estimations. In order to obtain the marginal effects we need to take the partial derivative of the probability function with respect to the vector of parameters x. Thus, the marginal analyses of changes in the regressors on the probabilities in the case of three categories are given by:
(
4a) (4b)(4c)
In this regard, to obtain the marginal effects of changes in the explanatory variables we require the standard normal cumulative distribution function evaluated at and
respectively. According to the marginal effects function, the probability of occurrence of one particular categorical response increases, assuming that the corresponding β is positive, as the value of the explanatory variable increases. In other words, as x increases then probability of achieving higher values of y increases as well. In the reverse case, when β<0 then as x increases the probability of achieving lower values of y increases. Furthermore, in our case an increase in the probability value reflects an increase in the overall debt level as revealed by students’ responses. Therefore positive β coefficients indicate that higher survey values (higher debt levels) increase overall outstanding debt.
RESULTS AND DISCUSSION
Empirical estimations of the Order Probit Model, estimated probabilities for the alternative models are reported in Tables 2, 3, and 4, respectively. We perform three sets of estimations to cover all possible scenario of our model described above. Our first set of estimates include demographic variables; the second set covers opinion variables as detailed in the survey (Appendix); the third and final set of estimations merges all variables to gain a full understanding of the interaction of demographic and perception variables interacting together.
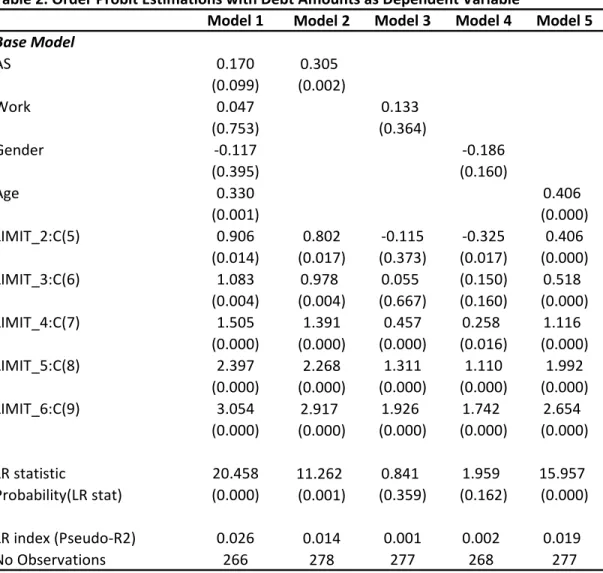
For the first set of estimates Table 2 provides five alternative models. Coefficient estimates (β) reported in Table 2, need to be interpreted with caution as they only indicate the direction of the effect and the relative economic significance across them; yet are not directly meaningful in absolute terms. We repeat this process for the other two sets of estimates.
Model 1 includes all demographic variables as they relate to the amount of outstanding debt. In this first model we observe that Academic Status (AS) and Age are both positively related to the amount of debt and are statistically significant at the 10% and 1% level of confidence. These results should not come as surprise, as it is well known that college education is expensive both from the direct and indirect cost of it. This is to say, as students advance in their academic programs, they are likely to accumulate debt to finance their studies. By the same token, being in school creates an implicit cost in the form of foregone income – opportunity cost of staying in school over a full time job – that generates the need for borrowing to successfully complete school. This positive effect of academic status on debt is reinforced by the age factor, as older students have more personal responsibilities and also have most likely been in school longer. Gender is negatively related (Male=1, Female=0) to debt indicating that females are more likely to hold debt than males are. However, this estimate is not statistically significant at conventional levels; but does provide some evidence indicating that females face a relatively more difficult situation securing financial resources to successfully complete college education. Work status reports a positive relationship to debt amount, but it is not statistically significant and very small in economic terms. This final result is of particular interest as one would expect borrowing capacity directly related to the income generation capability of borrowers. The fact that this coefficient is not significant
indicates that students leverage themselves above and beyond their means, even when they are not generating revenue. This is a particular result that has long term implications in terms of the financial stability of those graduating from college. High levels of debt relative to their income imply that students are living beyond their means and consequently developing unhealthy financial management practices, which are clearly not sustainable. College status seems to be a predictor of future financial performance.
<<<Insert Table 2 here>>>
The rest of the models in Table 2 confirm the result of those found in Model 1. When estimated separately, all demographic variables retain their economic and statistical significance as presented in Model 1.
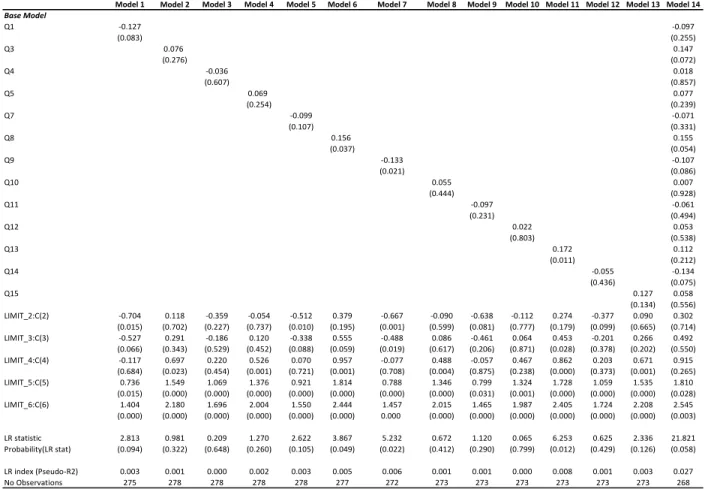
Estimation results of the categorical responses in the questionnaire section – Part I - of the survey (Appendix) are presented in Table 3 below.
<<< Insert Table 3 here>>>
Several results of the respondents’ perceptions are relevant. In particular, let us explore the estimated coefficients of the variables labeled Q1, Q3, Q8, Q9, Q13 and Q14 (See Appendix Part I of survey for variable description). First, the negative coefficient on Q1 is indicative in favor of the hypothesis that those we some knowledge on how to handle money tend to have a lower probability to accumulate debt. Secondly, Q3 indicates a positive relationship between students’ perception on their knowledge on balancing a checkbook and the amount of debt holding. However, while basic bookkeeping knowledge is relevant for useful budgeting, this should not be taken directly as capacity to manage debt better. Third, the preferences for a personal finance class to be offered indicate that students acknowledge their current knowledge in this regard is limited. However, the positive estimated coefficient reflects the fact that lack of knowledge does translate in more debt. Indeed a troublesome result that requires attention to prevent students from taking debt obligations above and beyond their means. Four, Q13 provides a very interesting result as it confirms the fact that those who borrow the most are the ones that know the least about how to effectively and efficiently manage money. We believe this is a serious situation requiring immediate attention. Not only is this coefficient positive in Model 11 Table 3, but also holds one of the largest coefficients at 0.172. Lastly, Q14 (rich people have budgets) indicates that students perceive there is no need to have budgets to be financially successful and therefore assume a high risk borrowing behavior, with increase debt as they perceive budgeting to be less needed. The rest of the coefficients are not statistically significant at conventional levels.
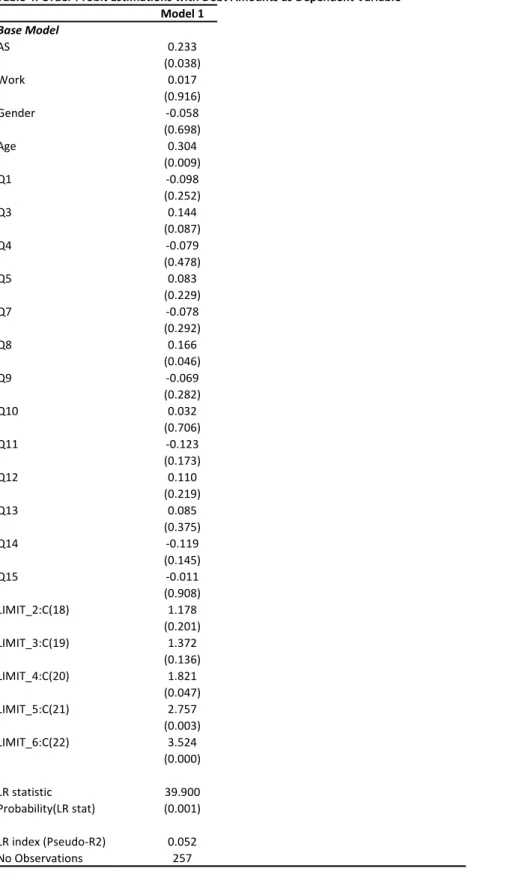
The last set of estimations is reported in Table 4. This estimation combines both the demographic and opinion based answers. Particular interesting results are those from variables Q3 and Q8 that remain statistically significant under all model specifications. First, Q3 (knows how to balance a checkbook), indicates the positive relationship between debt and perceived knowledge. Secondly, and perhaps more importantly, Q8 is robust to alternative model specifications, indicating the lack of knowledge on personal finances is a major cause for unhealthy borrowing practices. Q8 is significant both economically and statistically, after controlling for demographic characteristics.
<<< Insert Table 4 here>>> Impact Analysis and Marginal Probabilities
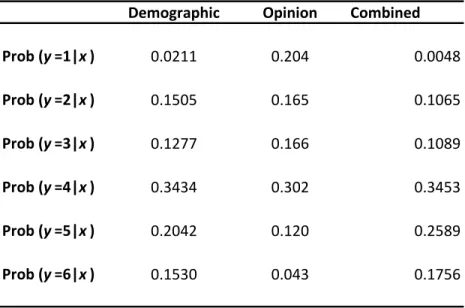
As indicated earlier, we need to transform β estimates into corresponding probabilities in order to obtain meaningful results. Predicted probabilities of the Order Probit model are reported in Table 5 below. Calculating the probabilities of holding different debt levels requires the use of the Limit values reported in Table 2, 3 and 4. Given the cumulative normal function , and with some significant amount of computations, the corresponding probabilities evaluated at the average value of all explanatory variables and using the corresponding estimated coefficients, along Equations (3a-c) are:
<<< Insert Table 5 here>> >
Insert Predicted Probabilities under alternative model specification here
We compute values in Table 5 using the average value for each of the independent variables. We repeat the process for the three alternative models as indicated in the table. We select only the most comprehensive model in each of the estimations. Thus, for instance in the case of Demographic Model in Table 5, we use the average values for the demographic variables as reported in Table 1 (Descriptive Statistics). Using the corresponding β estimates from Model 1 in Table 2, the resulting =2.031 and the corresponding =-0.948 for the first limit, -0.526, 0.366 and 1.023 for the rest of limits as reported in Table 2. We repeat this computation for each of the alternative models (Opinion and Combined). Values are then computed using the normal cumulative probability function. Thus, results from Table 5 indicate that estimated probabilities are very similar under the Demographic and Combined models. In fact the results are consistent to indicate that the probability of holding more debt increases after controlling for the students’ profiles and their perception on debt management. An interesting result derived from these probability computations is that students have a higher chance of accumulating large amounts of debt than otherwise. Results from the third model (Opinion) indicate opposite results compared to the previous ones. Under this model students have a higher probability to hold lower amounts of debt.
<< Insert Table 6 & Table 7 here>>
Insert Marginal Effects on Overall Debt Amount Holdings Here
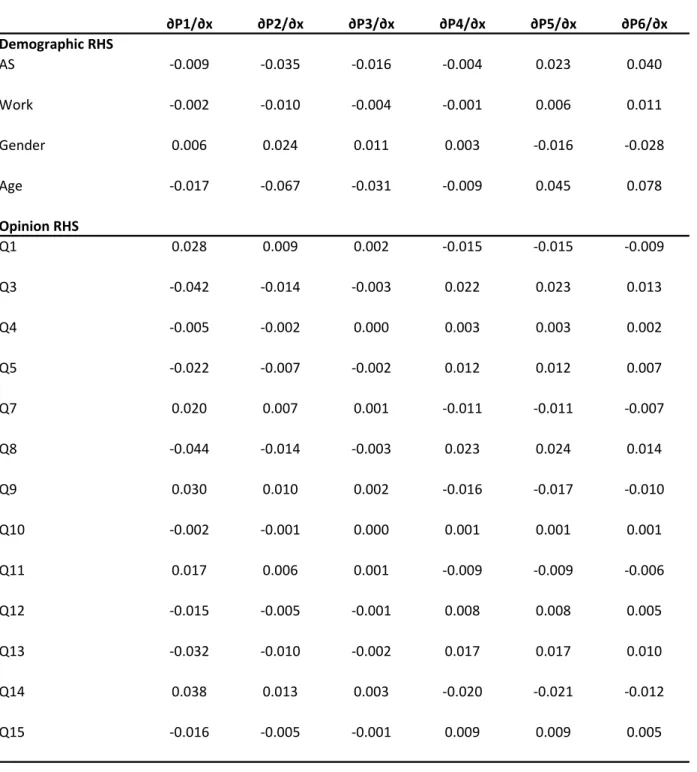
With the probability information computed and with a fair amount of extra calculation we can now proceed to compute the marginal effects of changes in the explanatory variables, and therefore provide a clear interpretation of the estimated coefficients. We now use Equation 4a-c. The results of the marginal effects are reported in Table 6 and 7 above. Table 6 reports the results for two separate models; first the demographic model, and then the Opinion model. The results of the two models need to be interpreted separately. Table 7 presents the marginal effects of the combined model (corresponding to Table 4). To illustrate how we compute the marginal effect, let us indicate that we calculate the marginal effects of AS (Academic Status) in Table 6 by computing the densities values for =2.031 and
=-0.948 for the first limit value, with corresponding results of 0.0507 and 0.2546. We repeat this computation for all other limit values, and then for all model specifications we use to compute the corresponding marginal effects reported in Tables 6 & 7. Notice that the sum of the marginal effects equals zero, as expected because all limit values are positive and increasing for the combined models.
Let us first look at the top portion of Table 6 under (Demographic RHS). Under this construct, Working (currently holding a job) increases marginally the probability of holding
larger levels of debt, while at the same time affect negatively the amount of lower debt amount. In other words, those that are currently employed need to borrow more at the high end, but are required to borrow less at intermediate levels. This particular reversal in the probability marginal effects brings forth the question as to whether the relation causation runs the opposite way, i.e., those that work do so, because they need to repay existent debt. Secondly, we look at AS (Academic Status) and find a significant positive relationship for students to borrow more (heavily) as they make more progress in their schooling status. This is to say, that the probability of holding more debt increases at the expense of student holding lower amounts of debt at early stages in school. In other words, by the time students finish college they will hold high amounts of debt. On itself, this is a very concerning result as it indicates that most students will enter the professional job market already holding debt amount beyond their financial capacity. We however, recognize that for most students, there may be very little options to finance their education if it is not through loans. The question then is, whether the current amount of debt composition is mostly on student loans or credit used to finance day-to-day purchases. Clearly, further research is needed here. Nevertheless, the experience of one of the authors when providing financial consulting is that most people do indeed hold debt amounts of excess to their financial means.
When looking at the Gender classification we observe that Females tend to have a higher probability to hold large amounts of debt (0.028) compared to the male counterpart. Males tend to hold debt amount on the second range ($2,001-$5,000) with a probability of 0.024. All in all this result raises the question, as to why females are more likely to hold higher amounts of debt? Finally, the AGE variable indicates that older people do hold larger amounts of debt with a probability effect of 0.078. While this result is expected, still begets the question if this relationship is independent of academic status or not.
When analyzing the lower portion of Table 6 (Opinion RHS), our focus turn to those variables with statistical significance in Table 3 under Model 14; i.e. Q3, Q8, Q9 and Q14. Several facts are worth mentioning. First, we observe a pairing in probability effects (both magnitude and sign) between Q3-Q8 and then Q9-Q14. Also the probability between the pairs is reversed, i.e. when Q3-Q8 are negative, Q9-Q14 are positive and vice versa. In general the combination of these effects indicates that the more one acknowledges the importance of good debt management practices and the role that education plays in it, the less likely a person is to hold large amounts of debt. Also, lack of knowledge of financial management – or at least the recognition that you wish more financial knowledge was available to you – implies that you are more likely to end up having more debt than less, as indicated by the negative coefficients at low levels of debt and positive coefficients at the high debt levels on Q8. As noted, Q9 and Q14 reinforced these effects, due to the reversed signs of their respective coefficients in relation to the Q3-Q8 pair. Thus when combined the marginal effect of having a debt amount on level 5 is 0.085 and 0.049 for the highest debt level.
The last variable we analyze is the perception that students have on those who appear rich and how they manage their money. The marginal effects indicate that students’ perception on debt management support the argument that holding a budget results in financial solvency as indicated by lower debt amounts. Empirical results indicate that the marginal effect on outstanding debt at the highest level decreases by 0.021 and 0.012 when students acknowledge the importance that perceived good management practices, by those that appear to be wealthy, have (Q14). The recognition of this fact by students is a positive indication of their awareness on how debt must be used and how their professional
performance in the future relates to their perception of good managers and their current debt holdings. By the same token, the reversal argument is that those that do not find good managers’ budgeting practices relevant are more likely to hold higher levels of debt. Education on proactive and positive business practices could prevent students from borrowing above and beyond their capacity. This result is also drawn from the recognition that students have on the desire to receive a personal finance class (Q8). On itself, these marginal effects on debt knowledge management are crucial to understand why students borrow more than they can effectively manage. Once again, financial education becomes a very strong predictor of good debt management and lower overall debt holdings.
The above mentioned results is also corroborated by the acknowledging in Q9, that not living beyond ones means results in overall lower debt holdings. It is okay to borrow as long as you do not go above and beyond your repayment capacity. This is a lesson that would go a long way in today’s financial markets.
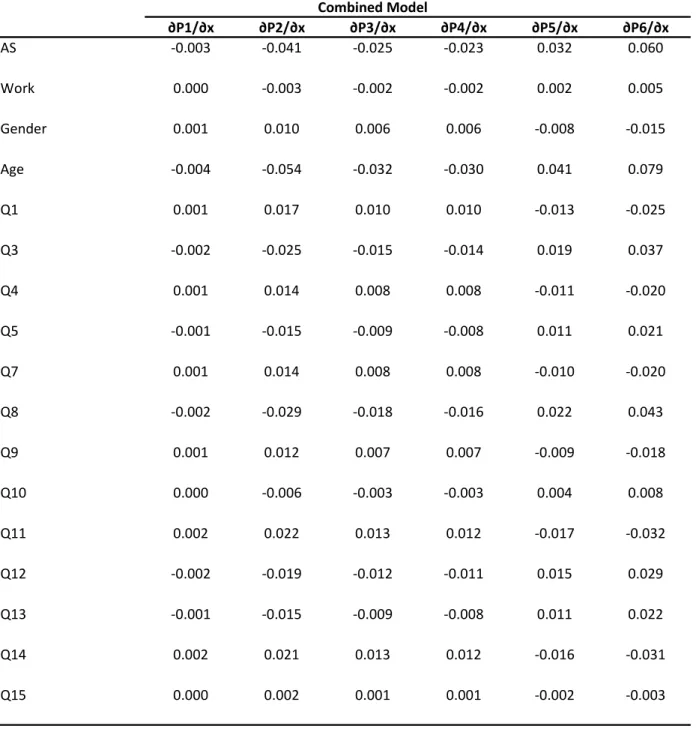
We find similar results under the combined model in Table 7. In particular we observe an increase in the marginal effects of AS, Q3, Q8, Q9 and Q14. In general, the observed relevance of the importance of knowledge on holding large amounts of debt increases under the combined model. We give particular attention to the significant increase in the Q8 marginal effect from 0.014 to 0.043. In addition, AS reports a significant larger marginal effect increasing from 0.04 to 0.06. In summary, the two model specifications and corresponding marginal effects provide robust estimates that support our hypothesis, financial knowledge reduces the probability of accumulating large debt amount. Furthermore, college students could significantly benefit from financial literacy in regards to debt management practices. Acquiring this knowledge early on in their college experience will aid them in not accumulating large amounts of debt, and consequently on becoming better managers overall.
CONCLUSIONS
Overconfidence, lack of personal financial knowledge and easy access to credit are at the core of high debt accumulation for college students. Furthermore, the exuberant irrational behavior of over borrowing is reinforced by students’ academic status, gender (females) and age. In this regard, there is direct evidence that an upper level female student is significantly more likely to hold higher amounts of debt, and corresponding excessive leverage, as graduation approaches. While some of these results should not be surprising at first glance - since it is highly expected that the more years of schooling the more potential for debt accumulation -, the results are striking in terms of the significant dominant probabilities to accumulate larger debts over lower debt amounts. Our results reinforce those found in other studies such as Chen and Volpe (1998, 2002); Peng, et al (2007); Lusardi and Tufano (2009); Borden et al (2007); Foberts and Jones (2001); DesJardins, Ahlburg, and McCall (2002).
A second relevant implication of our research points out to the possible positive effects in term of debt reduction – even better lack of accumulation of debt in the first place – the more personal financial education students receive, and the early on they receive this education. In particular, while the results indicate that both males and females would greatly benefit from a formal personal financial education class, the evidence is clear to indicate that the largest positive benefit would be drawn by freshmen and sophomore female students that do not hold currently a job. Thus, taking an active role in personal financial education could provide college students with adequate instrumental to both gain control of their personal
finances, and consequently develop positive spillover effects of financial management into the workplace. Our findings support those of Chen and Volpe (2002); and Borden, Lee, Serido, and Collines (2007).
We also noticed that borrowing capacity is not directly related to the income generation capability as measured by the Work variable. This finding implies that students are living beyond their means and consequently developing unhealthy financial management practices, before they actually hold a steady job. As Wells (2007) study showed, students’ optimism of being able to pay off debt decreased as they moved from freshmen to seniors. The reality is that students are failing to recognize currently the financial burden they are getting into, until they are ready to graduate. In some cases this maybe too late. In this regard, financial education/literacy early on in their college careers could have a tremendous potential to reduce the amount of debt absorbed.
Finally, our results also provide evidence supporting our hypothesis that financial knowledge reduces the probability of accumulating large debt amount. Acquiring this knowledge early on in their college experience will aid them in not accumulating large amounts of debt, and consequently on becoming better managers overall. We argue that teaching financial knowledge to all college students may create the necessary synergy to provide better financial management knowledge as they enter the workforce.
This paper has shed light in the relevant issues of debt management and financial literacy knowledge. Our results are exploratory in nature and therefore subject for further research. Several questions remain still unanswered. For instance, why if students recognize the need of financial literacy to better manage their finances, they fail to act upon it and be more proactive searching for this knowledge?
REFERENCES
Allen, W. M., Edwards, R., Hayhoe R. C., Leach, L. (2007). Imagined interactions, family money management patterns and coalitions, and attitudes toward money and credit. J Fam Econ Iss. 28: 3 -22
Borden, M. L., Lee, U., Serido, J., Collins, D. (2008). Changing College Students’ Financial Knowledge, Attitudes, and Behavior through Seminar Participation. Journal of Family and Economic Issues. 29: 23-41.
Bowen, F. C., Jones, M. H. (2006). Empowering Young Adults to Control Their Financial Future. Journal of Family and Consumer Sciences. 98: 33-40.
Chen, H., & Volpe P. R. (2002). Gender Differences in Personal Financial Literacy Among College Students. Financial Service Review. 11; 289 – 307.
Chen, M. (2005). Ethics: An Urgent Competency in Financial Education. Journal of American Academy
of Business, Cambridge. 6: 74-80.
DesJardins, L. S., Ahlburg, A. D., McCall, P. B. (2002). Simulation the Longitudinal Effects of Changes in Financial Aid on Student Departure from College. The Journal of Human Resources. 37: 653-679.
Ford, W. M., Devoto, S., Kent, W. D., Harrison, T. (2007). Threat, Intimidation, and student Financial Knowedge: An Empirical Study. Journal of Education for Business. 82: 131-140.
Ford, W. M., Kent, W. D., Devoto, S. (2007). Learning From the Pros: Influence of Web-Based Expert Commentary on Vicarious Learning About Financial Markets. Decision Sciencees Journal of
Innovative Education. 5: 43 -49
Jennings R. J. (October 2007). Higher Education Must Fill the Void in Student Financial Management.
Diverse Issues in Higher Education, 24: pg 46.
Jinhee, K. (2007). Workplace Financial Education Program: Does It Have an Impact on Employees’ Personal Finances? Journal of Family and Consumer Sciences. 99; 43-48.
Kim, J., Garman T. E., Quach, A. (2005). Workplace Financial Education Participation And Retirement Savings By Employees and Their Spouses. Journal of Personal Finance 4; 92 -108.
Kim, J. , Sorhaindo, B, Garman, T. E. (2006). Relationship between Financial Stress and Wrokplace Absenteeism of Credit Counseling Clients. Journal of Family Economic Issues 27: 458-478. Lusardi, A., Mitchell, S. O., Curto, V. (2009). Financial Literacy among the Young: Evidence and
Implications for Consumer Policy. PRC Working Paper Pension Research Council. WP2009-09; 1-35.
Lusardi, A., Tufano, P. (2009). Debt Literacy, Financial Experiences, and Overindebtedness. NBER
Working Papter Series. JEL No. D91; 1-35.
Lyons, C. A., Neelakantan, U. (2008). Potential and Pitfalls of Applying Theory the to Practice of Financial Education. The Journal of Consumer Affairs. 42; 106-113.
Ornelas, S. & Kleiner H. B. (2003). New Developments in Management Job Related Stress. Equal
Opportunities International. 22; 64 – 70.
Peng, M. T., Bartholomae, S., Fox, J. J., Carvener, G. (2007). The Impact of Personal Finance Education Delivered in High School and College Courses. Journal Family Economic Issues. 28; 265-284. Roberts, A. J., Jones, E. (2001). Money Attitudes, Credit Card Use, and Compulsive Buying among
American College Students. The Journal of Consumer Affairs. 35; 213-240.
Stone, D., Wier, B., Bryant, M. S. (2007). Does Financial Literacy Contribute to Happiness? The CPA
Journal. 77; 6-9.
Volpe, R.P., Chen, H., & Pavlicko, J.J. (1996). Personal investment literacy among college students: A survey. Financial Practice and Education. 6, 68-94
Wells, C. (2007). Optimism, Intertemporal Choice, and College Student Debt. Journal of personal
Finance, 5,4; 44-66.
Table 1. Descriptive Statistics.
Mean Median Maximum Minimum Std. Dev. Skewness Kurtosis Jarque‐Bera Prob Sum Sum Sq. Dev. N. Obs CLASS 4.355 4.000 7.000 1.000 1.885 ‐0.003 1.663 12.361 0.002 723.0 586.030 166 Q1 3.911 4.000 5.000 1.000 0.870 ‐0.802 3.640 35.030 0.000 1103.0 212.784 282 Q3 4.316 5.000 5.000 1.000 0.867 ‐1.435 5.039 147.175 0.000 1230.0 213.579 285 Q4 4.126 4.000 5.000 1.000 0.812 ‐1.024 4.579 79.388 0.000 1176.0 187.453 285 Q5 2.228 2.000 5.000 1.000 1.055 0.508 2.478 15.513 0.000 635.0 316.175 285 Q6 3.765 4.000 5.000 1.000 0.777 ‐0.426 3.189 9.038 0.011 1073.0 171.249 285 Q7 3.046 3.000 5.000 1.000 1.069 ‐0.177 2.297 7.366 0.025 868.0 324.407 285 Q8 3.746 4.000 5.000 1.000 0.823 ‐0.416 3.309 9.322 0.009 1064.0 191.747 284 Q9 3.373 4.000 5.000 1.000 1.127 ‐0.240 2.107 11.945 0.003 941.0 353.233 279 Q10 2.154 2.000 5.000 1.000 0.981 1.014 3.736 54.264 0.000 603.0 268.396 280 Q11 4.432 5.000 5.000 1.000 0.710 ‐1.805 8.496 504.341 0.000 1241.0 140.711 280 Q12 4.439 5.000 5.000 1.000 0.774 ‐1.681 6.650 287.384 0.000 1243.0 166.968 280 Q13 2.843 3.000 5.000 1.000 0.964 0.246 2.461 6.209 0.045 796.0 259.086 280 Q14 3.096 3.000 5.000 1.000 0.951 ‐0.018 2.596 1.923 0.382 867.0 252.396 280 Q15 2.389 2.000 5.000 1.000 0.804 0.549 3.404 15.973 0.000 669.0 180.568 280 AS 3.337 3.000 7.000 1.000 0.736 ‐0.197 4.775 39.241 0.000 951.0 153.663 285 MJ 4.482 3.000 15.000 1.000 3.697 1.463 3.953 65.534 0.000 744.0 2255.446 166 WORK 0.690 1.000 1.000 0.000 0.463 ‐0.821 1.673 50.842 0.000 189.0 58.631 274 DEBT 2.597 3.000 6.000 1.000 1.561 0.356 1.808 22.319 0.000 722.0 674.878 278 GENDER 0.590 1.000 1.000 0.000 0.493 ‐0.366 1.134 47.379 0.000 167.0 68.452 283 AGE 1.802 2.000 6.000 1.000 0.644 1.725 12.394 1180.861 0.000 510.0 116.919 283 ETHN 1.240 1.000 6.000 1.000 0.891 4.219 20.792 4572.359 0.000 351.0 223.661 283
Table 2. Order Probit Estimations with Debt Amounts as Dependent Variable
Model 1 Model 2 Model 3 Model 4 Model 5
Base Model AS 0.170 0.305 (0.099) (0.002) Work 0.047 0.133 (0.753) (0.364) Gender ‐0.117 ‐0.186 (0.395) (0.160) Age 0.330 0.406 (0.001) (0.000) LIMIT_2:C(5) 0.906 0.802 ‐0.115 ‐0.325 0.406 (0.014) (0.017) (0.373) (0.017) (0.000) LIMIT_3:C(6) 1.083 0.978 0.055 (0.150) 0.518 (0.004) (0.004) (0.667) (0.160) (0.000) LIMIT_4:C(7) 1.505 1.391 0.457 0.258 1.116 (0.000) (0.000) (0.000) (0.016) (0.000) LIMIT_5:C(8) 2.397 2.268 1.311 1.110 1.992 (0.000) (0.000) (0.000) (0.000) (0.000) LIMIT_6:C(9) 3.054 2.917 1.926 1.742 2.654 (0.000) (0.000) (0.000) (0.000) (0.000) LR statistic 20.458 11.262 0.841 1.959 15.957 Probability(LR stat) (0.000) (0.001) (0.359) (0.162) (0.000) LR index (Pseudo‐R2) 0.026 0.014 0.001 0.002 0.019 No Observations 266 278 277 268 277
Table 3. Order Probit Estimations with Debt Amounts as Dependent Variable
Model 1 Model 2 Model 3 Model 4 Model 5 Model 6 Model 7 Model 8 Model 9 Model 10 Model 11 Model 12 Model 13 Model 14
Base Model Q1 ‐0.127 ‐0.097 (0.083) (0.255) Q3 0.076 0.147 (0.276) (0.072) Q4 ‐0.036 0.018 (0.607) (0.857) Q5 0.069 0.077 (0.254) (0.239) Q7 ‐0.099 ‐0.071 (0.107) (0.331) Q8 0.156 0.155 (0.037) (0.054) Q9 ‐0.133 ‐0.107 (0.021) (0.086) Q10 0.055 0.007 (0.444) (0.928) Q11 ‐0.097 ‐0.061 (0.231) (0.494) Q12 0.022 0.053 (0.803) (0.538) Q13 0.172 0.112 (0.011) (0.212) Q14 ‐0.055 ‐0.134 (0.436) (0.075) Q15 0.127 0.058 (0.134) (0.556) LIMIT_2:C(2) ‐0.704 0.118 ‐0.359 ‐0.054 ‐0.512 0.379 ‐0.667 ‐0.090 ‐0.638 ‐0.112 0.274 ‐0.377 0.090 0.302 (0.015) (0.702) (0.227) (0.737) (0.010) (0.195) (0.001) (0.599) (0.081) (0.777) (0.179) (0.099) (0.665) (0.714) LIMIT_3:C(3) ‐0.527 0.291 ‐0.186 0.120 ‐0.338 0.555 ‐0.488 0.086 ‐0.461 0.064 0.453 ‐0.201 0.266 0.492 (0.066) (0.343) (0.529) (0.452) (0.088) (0.059) (0.019) (0.617) (0.206) (0.871) (0.028) (0.378) (0.202) (0.550) LIMIT_4:C(4) ‐0.117 0.697 0.220 0.526 0.070 0.957 ‐0.077 0.488 ‐0.057 0.467 0.862 0.203 0.671 0.915 (0.684) (0.023) (0.454) (0.001) (0.721) (0.001) (0.708) (0.004) (0.875) (0.238) (0.000) (0.373) (0.001) (0.265) LIMIT_5:C(5) 0.736 1.549 1.069 1.376 0.921 1.814 0.788 1.346 0.799 1.324 1.728 1.059 1.535 1.810 (0.015) (0.000) (0.000) (0.000) (0.000) (0.000) (0.000) (0.000) (0.031) (0.001) (0.000) (0.000) (0.000) (0.028) LIMIT_6:C(6) 1.404 2.180 1.696 2.004 1.550 2.444 1.457 2.015 1.465 1.987 2.405 1.724 2.208 2.545 (0.000) (0.000) (0.000) (0.000) (0.000) (0.000) 0.000 (0.000) (0.000) (0.000) (0.000) (0.000) (0.000) (0.003) LR statistic 2.813 0.981 0.209 1.270 2.622 3.867 5.232 0.672 1.120 0.065 6.253 0.625 2.336 21.821 Probability(LR stat) (0.094) (0.322) (0.648) (0.260) (0.105) (0.049) (0.022) (0.412) (0.290) (0.799) (0.012) (0.429) (0.126) (0.058) LR index (Pseudo‐R2) 0.003 0.001 0.000 0.002 0.003 0.005 0.006 0.001 0.001 0.000 0.008 0.001 0.003 0.027 No Observations 275 278 278 278 278 277 272 273 273 273 273 273 273 268
Table 4. Order Probit Estimations with Debt Amounts as Dependent Variable Model 1 Base Model AS 0.233 (0.038) Work 0.017 (0.916) Gender ‐0.058 (0.698) Age 0.304 (0.009) Q1 ‐0.098 (0.252) Q3 0.144 (0.087) Q4 ‐0.079 (0.478) Q5 0.083 (0.229) Q7 ‐0.078 (0.292) Q8 0.166 (0.046) Q9 ‐0.069 (0.282) Q10 0.032 (0.706) Q11 ‐0.123 (0.173) Q12 0.110 (0.219) Q13 0.085 (0.375) Q14 ‐0.119 (0.145) Q15 ‐0.011 (0.908) LIMIT_2:C(18) 1.178 (0.201) LIMIT_3:C(19) 1.372 (0.136) LIMIT_4:C(20) 1.821 (0.047) LIMIT_5:C(21) 2.757 (0.003) LIMIT_6:C(22) 3.524 (0.000) LR statistic 39.900 Probability(LR stat) (0.001) LR index (Pseudo‐R2) 0.052 No Observations 257
Table 5. Predicted Probabilities
Demographic Opinion Combined
Prob (y=1|x) 0.0211 0.204 0.0048 Prob (y=2|x) 0.1505 0.165 0.1065 Prob (y=3|x) 0.1277 0.166 0.1089 Prob (y=4|x) 0.3434 0.302 0.3453 Prob (y=5|x) 0.2042 0.120 0.2589 Prob (y=6|x) 0.1530 0.043 0.1756 y=1 $0‐$2,000, y=$2,001‐5,000 y=3 $5,001‐$10,000, y=4 $10,001‐$25,000 y=5 $25,001‐$50,000, y=6 $50,000‐up
Table 6. Marginal Effects on Outstanding Debt ∂P1/∂x ∂P2/∂x ∂P3/∂x ∂P4/∂x ∂P5/∂x ∂P6/∂x Demographic RHS AS ‐0.009 ‐0.035 ‐0.016 ‐0.004 0.023 0.040 Work ‐0.002 ‐0.010 ‐0.004 ‐0.001 0.006 0.011 Gender 0.006 0.024 0.011 0.003 ‐0.016 ‐0.028 Age ‐0.017 ‐0.067 ‐0.031 ‐0.009 0.045 0.078 Opinion RHS Q1 0.028 0.009 0.002 ‐0.015 ‐0.015 ‐0.009 Q3 ‐0.042 ‐0.014 ‐0.003 0.022 0.023 0.013 Q4 ‐0.005 ‐0.002 0.000 0.003 0.003 0.002 Q5 ‐0.022 ‐0.007 ‐0.002 0.012 0.012 0.007 Q7 0.020 0.007 0.001 ‐0.011 ‐0.011 ‐0.007 Q8 ‐0.044 ‐0.014 ‐0.003 0.023 0.024 0.014 Q9 0.030 0.010 0.002 ‐0.016 ‐0.017 ‐0.010 Q10 ‐0.002 ‐0.001 0.000 0.001 0.001 0.001 Q11 0.017 0.006 0.001 ‐0.009 ‐0.009 ‐0.006 Q12 ‐0.015 ‐0.005 ‐0.001 0.008 0.008 0.005 Q13 ‐0.032 ‐0.010 ‐0.002 0.017 0.017 0.010 Q14 0.038 0.013 0.003 ‐0.020 ‐0.021 ‐0.012 Q15 ‐0.016 ‐0.005 ‐0.001 0.009 0.009 0.005
Table 7. Marginal Effects on Outstanding Debt Combined Model ∂P1/∂x ∂P2/∂x ∂P3/∂x ∂P4/∂x ∂P5/∂x ∂P6/∂x AS ‐0.003 ‐0.041 ‐0.025 ‐0.023 0.032 0.060 Work 0.000 ‐0.003 ‐0.002 ‐0.002 0.002 0.005 Gender 0.001 0.010 0.006 0.006 ‐0.008 ‐0.015 Age ‐0.004 ‐0.054 ‐0.032 ‐0.030 0.041 0.079 Q1 0.001 0.017 0.010 0.010 ‐0.013 ‐0.025 Q3 ‐0.002 ‐0.025 ‐0.015 ‐0.014 0.019 0.037 Q4 0.001 0.014 0.008 0.008 ‐0.011 ‐0.020 Q5 ‐0.001 ‐0.015 ‐0.009 ‐0.008 0.011 0.021 Q7 0.001 0.014 0.008 0.008 ‐0.010 ‐0.020 Q8 ‐0.002 ‐0.029 ‐0.018 ‐0.016 0.022 0.043 Q9 0.001 0.012 0.007 0.007 ‐0.009 ‐0.018 Q10 0.000 ‐0.006 ‐0.003 ‐0.003 0.004 0.008 Q11 0.002 0.022 0.013 0.012 ‐0.017 ‐0.032 Q12 ‐0.002 ‐0.019 ‐0.012 ‐0.011 0.015 0.029 Q13 ‐0.001 ‐0.015 ‐0.009 ‐0.008 0.011 0.022 Q14 0.002 0.021 0.013 0.012 ‐0.016 ‐0.031 Q15 0.000 0.002 0.001 0.001 ‐0.002 ‐0.003
Appendix I
Budgeting Questionnaire-Survey
Part I
1) I have had some form of instruction on how to handle my money?
Strongly Disagree ___ Disagree ___ Neutral ___ Agree ___ Strongly Agree ___
If you “Agree” or “Strongly Agree”: please provide instruction: ________________ (Family, Friends, High School, College, Other)
2) I feel confident in my ability to handle my finances?
Strongly Disagree ___ Disagree ___ Neutral ___ Agree ___ Strongly Agree ___ 3) I know how to balance my check book?
Strongly Disagree ___ Disagree ___ Neutral ___ Agree ___ Strongly Agree ___ 4) I understand how a budget works?
Strongly Disagree ___ Disagree ___ Neutral ___ Agree ___ Strongly Agree ___ 5) Being in debt can be an advantage in my finances?
Strongly Disagree ___ Disagree ___ Neutral ___ Agree ___ Strongly Agree ___ 6) Most people do not know how to manage money?
Strongly Disagree ___ Disagree ___ Neutral ___ Agree ___ Strongly Agree ___ 7) I have a budget I use for my finances?
Strongly Disagree ___ Disagree ___ Neutral ___ Agree ___ Strongly Agree ___ 8) I wish a class on personal finance was available?
Strongly Disagree ___ Disagree ___ Neutral ___ Agree ___ Strongly Agree ___ 9) I do not live beyond my financial means?
Strongly Disagree ___ Disagree ___ Neutral ___ Agree ___ Strongly Agree ___ 10) If I made more money I would not need a budget?
Strongly Disagree ___ Disagree ___ Neutral ___ Agree ___ Strongly Agree ___ 11) A good manager should also be good at budgeting?
Strongly Disagree ___ Disagree ___ Neutral ___ Agree ___ Strongly Agree ___ 12) Debt adds stress?
Strongly Disagree ___ Disagree ___ Neutral ___ Agree ___ Strongly Agree ___ 13) I want to manage my money better but do not know how?
Strongly Disagree ___ Disagree ___ Neutral ___ Agree ___ Strongly Agree ___ 14) Most people who appear rich have budgets?
Strongly Disagree ___ Disagree ___ Neutral ___ Agree ___ Strongly Agree ___ 15) Most people I know can manage money better than me?
Strongly Disagree ___ Disagree ___ Neutral ___ Agree ___ Strongly Agree ___ 16) I know of at least one person who lives on a budget?
If “Agree” or” Strongly Agree”: Do they seem more content than other people?
Strongly Disagree ___ Disagree ___ Neutral ___ Agree ___ Strongly Agree ___ Part II
1) Academic Status: (AC STAT)
1 Freshman ____ 2 Sophomore ____ 3 Junior ____ 4 Senior ____ 5 Master ____ 6 Doctoral ____ 7 Other ____ 2) Major (s): (MJ) _________________________________________ 1) MBA
2) Management & Marketing 3) Accounting & Management 4) Marketing
5) Economics
3) Are you presently employed? (EMP) ______ 1) Yes
2) No
4) Current debt status (CDS) 1) ______ $0 - $2,000 2) ______ $2,001 – $5,000 3) ______ $5,001 - $10,000 4) ______ $10,001 - $25,000 5) ______ $25,001 - $50,000 6) ______ $50,000 - UP
5) Gender: (MF) Male _____ Female ______ 1) Male 0) Female 6) Age (AGE) _____ 1) 18 - 20 2) 21 - 24 3) 25 – 28 4) 29 – 32 5) 33 – 36 6) 37 - 100 7) Ethnicity (ETH)
1) White (not of Hispanic origin) ____
2) Black (African American) ____ 3) Asian or Pacific Islander ____
4) Hispanic ____
5) American Indian ____