c
Rinton Press
A COMPARISON OF PREDICTION ALGORITHMS FOR PREFETCHING IN THE CURRENT WEB
JOSEP DOMENECH, JULIO SAHUQUILLO, JOSE A. GIL, and ANA PONT Department of Computer Engineering, Universitat Politecnica de Valencia
Cami de Vera s/n, Valencia, 46022, Spain
[email protected];{jsahuqui,jagil,apont}@disca.upv.es
Received September 29, 2010 Revised December 26, 2011
This paper reviews a representative subset of the prediction algorithms used for Web prefetching classifying them according to the information gathered. Then, the DDG algorithm is described. The main novelty of this algorithm lies in the fact that, unlike previous algorithms, it creates a prediction model according to the structure of the current web. To this end, the algorithm distinguishes between container objects and embedded objects. Its performance is compared against important existing algorithms, and results show that, for the same amount of extra requests to the server, DDG always outperforms those algorithms by reducing the perceived latency up to 70% more without increasing the complexity order.
Keywords: Web prefetching, web performance Communicated by: D. Lowe & R. Baeza-Yates
1 Introduction
Latencies in the Internet communications still remain high. These latencies are mainly related to the amount of intermediate hops and to the hardware load of the interconnection points. Reducing latencies by working on the hardware may involve a high cost. Besides, there exist limits, such as the signal propagation time, that cannot be surpassed.
Nevertheless, due to the characteristics of the World Wide Web, it is possible to hide a significant part of the Internet latencies to the users, that is, to reduce the user-perceived latency. To this end, techniques such as content distribution networks (CDN), web caching and web prefetching have been developed. The goal of a CDN is to bring close to the users the content they want to retrieve. By reducing the physical distance between users and contents the latency is also reduced. Web caching consists in reusing web objects previously requested and locally stored, so some requests are served locally and, therefore, faster. Web prefetching predicts following user requests in order to process (usually download) them in advance, so when the user actually demands the objects, they have been already retrieved and thus, the perceived latency is reduced. Prefetching systems are usually based on an extension of a generic web architecture. This technique is implemented by means of two extra elements: the prediction and the prefetching engines. These engines can be located in the same or different elements of the system. The prediction engine is the part of the prefetching system aimed
at guessing the following user accesses. This engine can be located at any part of the web architecture: clients, proxies, and servers, or even in a collaborative way at several elements. To predict future accesses, the most widely used option is to learn from the past access patterns. These patterns of web browsing differ depending on the element of the architecture in which the prediction engine is implemented because the information that each element can gather is different. The output of the prediction engine is a hint list, which is composed of a set of URIs which are likely to be requested by the user in a near future. Nevertheless, this list can also be a set of servers if only the connection is going to be prefetched. Due to the fact that in many proposals the hint list is included in the HTTP headers of the server response, the time taken by the predictor to provide this list should be short enough to avoid delaying every user request and, therefore, degrading overall performance.
The predictor must distinguish between those objects that can be prefetched (and therefore predicted) and those that cannot. For this reason, the hint list can only contain prefetchable URIs. According to the definition proposed in [1], a web resource is prefetchable if and only if it is cacheable and its retrieval is safe. Browsers based on Mozilla consider that a resource is not prefetchable if the URI contains a query string.
The prefetching engine is aimed at preprocessing those object requests predicted by the prediction engine. By processing the requests in advance, the user waiting time when the object is actually demanded is reduced. In the literature, this preprocessing has been mainly concentrated on the transference of requested objects in advance although there are other approaches that consider the preprocessing of a request by the server [2, 3], or focus on the pre-establishment of connections to the server [4]. For this reason, the prefetching engine can be located at the client, the proxy, the server, or at several elements.
In addition, to avoid the interference of prefetching requests with the current user requests, the prefetching engine can take into account external factors to decide whether to prefetch an object hinted by the prediction engine or when to prefetch it. These external factors could be related to any part of the web architecture. For instance, when the prefetching engine is located at the client, some commercial products (e.g., Mozilla Firefox and Google Web Accelerator) wait for the browser connections to be idle to start prefetching requests. If it is located at the proxy, the prefetching engine could prefetch objects only when the bandwidth availability is higher than a given threshold. For the case of the predictor located at the server, it could allow prefetching only when its current load permits an increase of requests.
The capability of reducing the user-perceived latency by means of web prefetching depends on where this engine is located. In this way, the closer to the client the prefetching engine is, the more latency can be avoided. Therefore, a prefetching engine located at the client can reduce the whole user-perceived latency. Besides, this represents the current trend included in commercial products like Mozilla Firefox and Google Web Accelerator. Figure 1 shows a basic example of prefetching architecture in which the prediction engine is located at the server side while the prefetching engine is at the client side.
This paper reviews a representative subset of the prediction algorithms used for web prefetching, classifying them according to the information used to make the predictions. Then, the Double Dependency Graph (DDG) is introduced and evaluated. This algorithm improves prefetching performance by considering the structure of the web.
Fig. 1. Example of prefetching architecture in which the prediction engine is located at the web server and the prefetching engine is located at the client.
Fig. 2. Classification of web prediction algorithms.
prediction algorithms. Section 3 evaluates the benefits of the DDG algorithm by comparing it against two well-known prediction algorithms. Finally, Section 4 presents some concluding remarks.
2 Web prediction algorithms
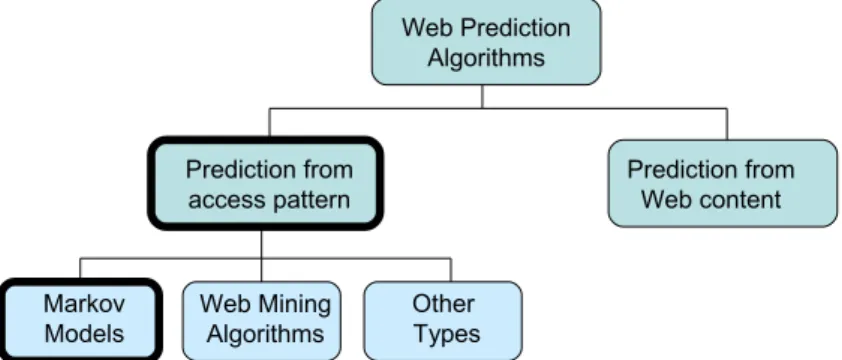
This section examines the large variety of prediction algorithms that can be found in the literature classifying them into two main categories according to the data taken into account to make the predictions, as shown in Figure 2.
The first category includes those algorithms that predict future accesses considering the observed pattern of past accesses. Algorithms falling in the second category make the pre-diction by analyzing the content of the recently visited web pages to find links with a high probability of being clicked.
2.1 Prediction from the access pattern
Algorithms in this category lie in the statistical inference about future user accesses from the past ones. The prediction of user accesses has usually been made by adapting prediction
algorithms from other fields of computing to deal with web accesses. According to the amount of research works found, this is the most important category.
The algorithms can be classified into three subcategories depending on the statistical technique used to compute the predictions: i) those based on Markov models, ii) those using data mining techniques, and iii) other techniques. Algorithms in the first subcategory are the ones that require much less CPU time to make predictions. Consequently, the algorithms based on Markov models are the main candidates to be implemented in a web prefetching system to achieve the best reduction of user-perceived latency.
2.1.1 Markov models
A Markov model is a finite-state machine where the next state depends only on the current state. Associated with each arc of the finite-state machine network (a directed cyclic graph) is the probability of making the given transition. When applied to the prediction of user accesses, each state represents the context of the user, i.e., their recent past accesses, and the transitions represent a user request. In this sense, the probability attached to each transition is the probability of accessing a given object.
The main parameter of any Markov model is the order, which refers to the size of the window of accesses that defines each different context. Usually, the higher order the more precision. However, an increase in the order of the model also implies an increase in the resources required to compute the prediction.
There exist a high amount of works that describe web prediction algorithms based on Markov models. Basic Markov models considering the accesses sequence of different orders have been explored in the literature.
The top-10 algorithm proposed in [5] can be considered as a Markov model of order 0, that is, the prediction result does not depend on the context (i.e., last requests). In [6], the author considers first and second order Markov chains to predict requests. The optimal results in [7] with Prediction by Partial Match (PPM) algorithm, which combines several Markov models to make the predictions, are achieved when a second order model is applied. However, in [8] better results are obtained when implementing the model with orders higher than 3. Most of these studies only focus on the precision of the prediction to determine the appropriate order of the model without taking into account that precision is not correlated to the reduction of the user-perceived latency [9].
When Markov models of higher orders are explored, the use of techniques to reduce the resource requirements of the implementation is needed. Different authors have explored how to deal with such a large amount of data. Techniques such as data compression or different types of branches in the prediction tree have been proposed and analyzed [10, 11, 12].
Other works propose algorithms that make predictions with Markov models that are built considering the referrer information provided in the HTTP protocol. Those models can be built using only referrers [13] or by combining referrer and sequence information [14].
The Dependency Graph (DG) algorithm, which is evaluated in this work, lies in a predictor of accesses to a local file system. Several versions of the DG algorithm can be found in the literature [?, 16, 17] but basically they construct a dependency graph that depicts the pattern of accesses to the objects. The Double Dependency Graph (DDG) algorithm has as main novelty that it takes into account the structure of web pages to make predictions for reducing
the user-perceived latency to a higher extent [18]. To do so, the algorithm differentiates two classes of dependencies: between objects of the same page and between objects of different pages.
Algorithms based on Markov models have been proposed to be applied either to each object access or to each page (i.e., to each container object) accessed by the user. In addition, two ways have been used to select which object or page will be predicted: predicting the
top-n likely objects and predicting those objects with more probability of being accessed than a given confidence threshold.
2.1.2 Web mining algorithms
Several prediction algorithms benefiting from web mining techniques have been developed. Web mining is defined in [19] as the application of data mining techniques to extract knowledge from Web data, where at least one structure (hyperlink) or usage (Web log) data is used in the mining process (with or without other types of Web data). It has been found that two data mining techniques are used to make web access predictions: clustering and association rules mining.
Clustering algorithms are applied in [20] to a three dimensions cube representation of web accesses. To make the predictions, the transition probability matrix for pages that belong to the same cluster is calculated. The prediction model used in [21] takes into account data both from the accesses sequence of each session and from the user thinking time of each page in the session. Then, user sessions are clusterized and the prediction is made by considering the most similar session in the cluster.
Rule-assisted prefetching strategy is another option to make predictions. The technique presented in [22] gives priority to recently added links over those older, whereas [?] tries first to find a rule generated from the user that is currently accessing the web. The algorithm (W Mo) [24, 25] deals with random accesses that could be in the access patterns, although
the other user accesses must be in the same order as found in the pattern. That proposal also takes into account the graph of the web site structure to allow only those patterns with transitions included in the graph.
2.1.3 Other algorithms
Other approaches to web access prediction from the access pattern can be found in the liter-ature. The prediction engine presented in [?] is based on an evolutionary finite-state machine (FSM). In this FSM, user requests are represented by transitions, but unlike the FSM rep-resentation of Markov models, each node in their model represents a prediction instead of a context. The algorithm is initially set up with a set of FSMs that evolves according to genetic operators: recombination, mutation and natural selection. The authors propose a fitness func-tion to evaluate the goodness of each FSM related to two predicfunc-tion metrics: precision and applicability. This function helps the evolution of the FSMs to achieve better performance.
The algorithm presented in [27] takes into account object characteristics not considered in other algorithms to maximize hit rate to bandwidth ratio. This technique relies on accounting the contribution to the hit rate and to the bandwidth ratio of each object, but needs extra information about the objects like access frequency, size, lifetime, etc.
In [28], the author explores how the prefetching should be conducted to minimize the user-perceived latency, despite not considering the costs of the prefetching. The proposed
prefetching system sorts the objects with respect to their (unconditional) probability of being requested, and then fetches sequentially all the documents.
2.2 Prediction from web content
Kahn and Tao suggest in [29] that the prediction of user accesses can be improved if the algorithm considers the organization of the webspace. Therefore, the second subset of web prediction algorithms are those whose predictions are made from the analysis of the content of the web pages (usually HTMLs) that the user has requested instead of using only the sequence of accesses. As a consequence, the complexity of these algorithms is significantly higher than the complexity of just analyzing the references.
The first attempt to predict next user accesses from the HTML content was presented in [?]. This work combines the analysis of the content with usage profiles that are generated by the web servers.
In other work [?], Ibrahim and Xu apply neural networks to keywords extracted from the HTML content in order to make the predictions. Their evaluation, which is performed from the prediction point of view, only focuses on news web servers where key word extraction is easier.
The technique presented in [?] sorts the links found in an HTML according to their prob-ability of being clicked. This order is given by the similarity of each text context of the links to the text context of the previously clicked link. The context is composed of the words that appear near the anchor tag in the HTML.
In a more recent work, Sidiropoulos et al. [33] identify clusters of “correlated” web pages in a site (web site communities), and make these communities the basic outsourcing unit of content to be prefetched. The approach is based only on the hyperlink information, since it is assumed that two pages are “similar” or “correlated” if there exists a link between them. 3 Performance comparison of web prediction algorithms
In this section we evaluate the benefits of the DDG algorithm by comparing it against the most widely used prediction algorithms in the literature: Prediction by Partial Match (PPM) [?] and Dependency Graph (DG) [?].
3.1 Dependency Graph (DG)
The DG prediction algorithm constructs a dependency graph that depicts the pattern of accesses to the objects. The graph has a node for every object that has ever been accessed. There is an arc from node A to B if and only if at some point in time a client accessed to B within w accesses after A, where w is thelookahead window size. The weight of the arc is the ratio of the number of accesses to B within a window after A to the number of accesses to A itself. The prefetching aggressiveness can be controlled by applying a cutoff threshold parameter to the weight of the arcs.
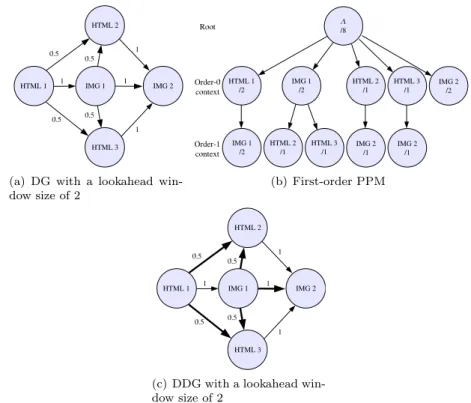
For illustrative purposes, we use a working example. Let us suppose that the algorithms are trained by two user sessions. The first one contains the following accesses: HTML1, IMG1, HTML2, IMG2. The second session includes the accesses: HTML1, IMG1, HTML3, IMG2. Note that IMG2 is embedded both in HTML2 and in HTML3. We found this characteristic common through the analyzed workload, where different pieces of news (i.e., HTML files)
(a) DG with a lookahead win-dow size of 2
(b) First-order PPM
(c) DDG with a lookahead win-dow size of 2
Fig. 3. State of the graphs of the algorithms after the accesses HTML1, IMG1, HTML2, IMG2 by one user; and HTML1, IMG1, HTML3, IMG2 by other user
contain the same embedded images, since they are included in the site structure. Figure 3(a) shows the state of the graph of the DG algorithm for a lookahead window size of 2 corre-sponding to the mentioned training. Each node in the graph represents an object whereas the weight of each arc is the confidence level of the transition.
3.2 Prediction by Partial Match (PPM)
The PPM prediction algorithm uses Markov models ofm orders to store previous contexts. Predictions are obtained by comparing the current context to each Markov model, where each context consists of then last accesses of the user, wheren is the order of the context plus 1. To select which objects are predicted, the algorithm uses a confidence threshold.
Figure 3(b) shows the graph obtained when the PPM algorithm is applied to the training used in the previous example. Each node represents a context, where the root node is in the first row, the order-0 context is in the second, and the order-1 context is in the third one. The label of each node also includes the number of times that a context appears, so one can obtain the confidence of a transition by dividing the counter of a node by the counter of its parent. The arcs indicate the possible transitions. For instance, the label of the IMG2 in order-0 context is 2 because IMG2 appeared twice in the training; once after HTML2 and another after HTML3. IMG2 has two nodes in the order-1 context, i.e., one per each HTML on which it depends.
3.3 Double Dependency Graph (DDG)
The DDG algorithm is based on a graph that keeps track of dependencies among the resources accessed by the user and of the structure of the web site. Dependencies among resources are recorded in a similar way to DG. That is, there are as many nodes as resources in the web site. Then, there is an arc from node A to B if and only if at some point in time a client accessed to B within w accesses to A after B, where w is the lookahead window size. The weight of this arc is computed as the ratio of the number of accesses to B within a window after A to the number of accesses to A itself.
To keep track of the structure of the web site, DDG distinguishes two classes of arcs, so that it is possible to differentiate access dependencies between resources in the same page from dependencies between resources of different pages. An arc from node A to node B is a primary arc if A and B are objects of subsequent pages. That is, either B is an HTML resource or the client accessed to one HTML resource between A and B. When there are more than one HTML document between A and B, no arc is included in the prediction model.
The confidence of each primary or secondary transition (i.e., the confidence of each arc) is calculated by dividing the counter of the arc by the amount of appearances of the node, both for primary and for secondary arcs. This algorithm has the same order of complexity as the DG, since it makes the same graph but distinguishing two classes of arcs.
Figure 3(c) shows the state of the DDG algorithm corresponding to the working example. Arrows with bold lines represent primary arcs while thin lines represent secondary arcs.
Once the prediction model is generated, it is possible to make the predictions. To do so, DDG applies a cutoff threshold to the weight of the primary arcs that leave the node of the last user access. Then, to predict the embedded objects of the following page, the algorithm applies a secondary threshold to the secondary arcs that leave the nodes of the objects predicted in the first step. The hint list consists of those resources represented by the nodes reached after applying the path mentioned above.
The DDG algorithm includes the option of disabling the prediction of HTML objects. This option might be useful in those cases in which the cost of downloading an HTML object (i.e., its size) is very high when compared to the contained objects (e.g., images), as it occurs in one of the workloads used. The algorithm determines if a given object is an HTML file by looking at its MIME type in the response header given by the web server.
3.4 Experimental Framework
We used the experimental framework proposed in a previous work [35] for the performance evaluation study. The framework consists of three main parts: the server, the surrogate, and the client. The implementation combines both real and simulated parts in order to provide flexibility and accuracy. To perform prefetching tasks, a prediction engine implementing different algorithms has been included in the surrogate.
The framework emulates a real surrogate, which is used to access an Apache web server. The surrogate, which provides no caching, acts as a predictor by adding HTTP headers to the server response with the hints provided by the prediction algorithm. Clients take the generated hints to download those objects in advance.
The client part represents the behavior of the users surfing the Web with a prefetching enabled browser. To model the set of users that access concurrently to a given server, the
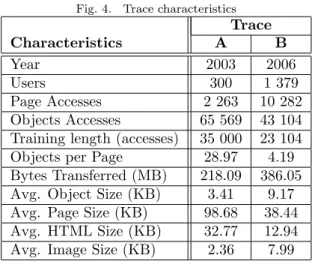
Fig. 4. Trace characteristics Trace Characteristics A B Year 2003 2006 Users 300 1 379 Page Accesses 2 263 10 282 Objects Accesses 65 569 43 104
Training length (accesses) 35 000 23 104
Objects per Page 28.97 4.19
Bytes Transferred (MB) 218.09 386.05
Avg. Object Size (KB) 3.41 9.17
Avg. Page Size (KB) 98.68 38.44
Avg. HTML Size (KB) 32.77 12.94
Avg. Image Size (KB) 2.36 7.99
simulator is fed by real traces. Simulated clients obtain the results of the prediction engine from the response, and prefetch the hinted object in their idle times, as implemented in Mozilla Firefox.
To reproduce the behavior pattern of users in the web, we used two different workloads, whose main characteristics are summarized in Table 4. Trace A contains accesses to the most popular news web server in Spain during May 2003. It was obtained by filtering accesses to this web server in the log file of a Squid proxy of the Universitat Politecnica de Valencia. Trace B includes users accessing the institutional web site of the Computer Science School of the same university during February 2006. Both traces contain dynamic but prefetchable URIs.
3.5 Performance Metrics
The performance of the algorithms has been evaluated by using the main metrics related to the user-perceived performance and prefetching costs (e.g., traffic increase or processor time) [9].
• Latency per page ratio: It is the ratio of the latency per page that prefetching achieves
to the latency without prefetching. The latency per page is calculated by comparing the time between the browser initiation of an HTML page GET and the browser reception of the last byte of the last embedded image or object for that page.
• Traffic Increase: The bytes transferred through the network when prefetching is
em-ployed divided by the bytes transferred in the non-prefetching case. Notice that this metric includes both the extra bytes wasted by prefetched objects that the user will never use and the network overhead caused by the transference of the prefetch hints. The variant Object Traffic Increase measures this cost taking into account only the amount of objects.
3.6 Analysis Methodology
The primary goal of web prefetching is the reduction of the user-perceived latency. However, when predictions fail, prefetched objects waste user and server resources, which can lead to a
performance degradation either to the user himself or to other users. Consequently, the main cost of achieving the latency reduction is the increment of the network load. This increment has two side effects: the first is the increase in the amount of bytes transferred (measured by theTraffic Increase metric), and the second is the increase of the number of requests to the server (measured by the Object Traffic Increase metric). As a consequence, the performance analysis should consider the benefits of reducing the user-perceived latency at the expense of increasing the network traffic and the amount of requests to the server.
Comparisons of two different algorithms can only be fairly done if either the benefit or the cost have the same or close value. For instance, when two algorithms have the same or very close values of traffic increase, the best proposal is the one that presents less user-perceived latency, and vice versa. For this reason, the performance comparisons we present in Section 3.7 are made through curves that include pairs of traffic increase and latency per page ratio for each algorithm. To obtain each point in the curve we varied the aggressiveness of the algorithm, i.e., how much an algorithm will predict. This aggressiveness is controlled by the confidence threshold parameter. The set of tested threshold values was the same for all three algorithms, which includes values between 0.1 and 0.9. Since the three considered metrics are outputs of the simulation, the same set of input parameters leads to different ranges of output values.
Results for a given algorithm are shown in a curve so that a single plot presents as many curves as algorithms compared. By drawing a horizontal line over the desired latency reduction in the plot, one can obtain the traffic increase of each algorithm. The best algorithm for achieving that latency per page is the one having less traffic increase. We can proceed in a similar way with the object traffic increase metric.
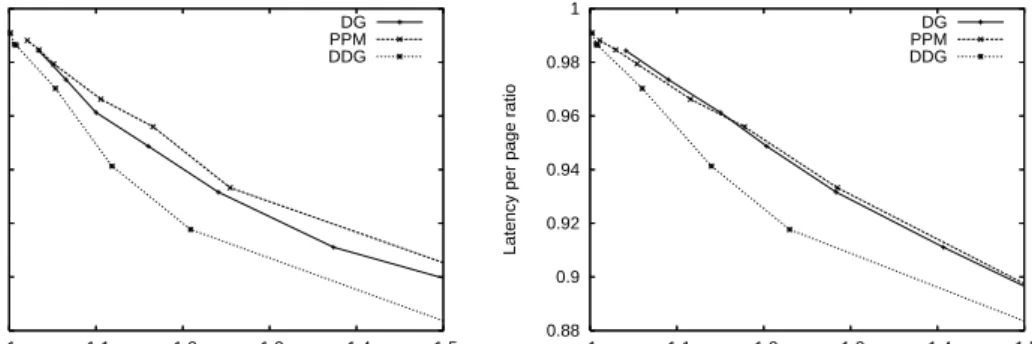
3.7 Latency per page ratio
All three algorithms were tuned to achieve their best performance. The best configuration of DG and PPM is the one with less complexity, that is, DG with a lookahead window size of 2, and a first-order PPM. In a previous work we showed that extra complexity in these algorithms does not involve better performance [36] in current web due to the increase in the amount of embedded objects in each page. When DDG is configured to use a lookahead window size of 2 under workload A, its latency reduction is always below 3% due to the lack of primary arcs. Since similar ranges of latency or traffic increase are needed to perform a fair comparison, a window size of 12 is used. Results for this configuration are similar within range of window size of 2, but with a wider range both in traffic increase and latency reduction Under workload B, a lookahead window size of 2 is used since it provides ranges similar to DG.
Figure 5(a) shows that for any value of traffic increase in bytes, the algorithm that provides the lowest user-perceived latency under workload A is always the DDG. Similar results can be extracted when considering as main cost the traffic increase measured in amount of objects (see Figure 5(b)): DDG curve always falls below the other algorithms curves. Figure 6 shows the relative improvement of the DDG algorithm compared to the best of the other two algorithms (i.e., the DG). Figure 6(a) shows that given a value of latency per page ratio, DDG requires between 25% and 60% less of bytes transference and between 15% and 65% less requests to the server than the DG algorithm. On the other hand, given a value of traffic
0.88 0.9 0.92 0.94 0.96 0.98 1 1 1.1 1.2 1.3 1.4 1.5
Latency per page ratio
Traffic Increase DG PPM DDG
(a) Latency per page ratio as a function of Traffic increase (workload A) 0.88 0.9 0.92 0.94 0.96 0.98 1 1 1.1 1.2 1.3 1.4 1.5
Latency per page ratio
Object Traffic Increase DG PPM DDG
(b) Latency per page ratio as a function of Object Traffic increase (workload A)
0.86 0.88 0.9 0.92 0.94 0.96 0.98 1 1 1.05 1.1 1.15 1.2 1.25 1.3
Latency per page ratio
Traffic Increase DG PPM DDG
(c) Latency per page ratio as a function of Traffic increase (workload B) 0.86 0.88 0.9 0.92 0.94 0.96 0.98 1 1 1.05 1.1 1.15 1.2 1.25 1.3
Latency per page ratio
Object Traffic Increase DG PPM DDG
(d) Latency per page ratio as a function of Object Traffic increase (workload B)
Fig. 5. Algorithms comparison
0 0.1 0.2 0.3 0.4 0.5 0.6 0.7 0.88 0.9 0.92 0.94 0.96 0.98 1
Relative traffic savings (%)
Latency per page ratio Bytes Objects
(a) Relative improvement in traffic increase as a function of latency per page ratio
0 0.1 0.2 0.3 0.4 0.5 0.6 0.7 1 1.1 1.2 1.3 1.4 1.5
Relative latency savings (%)
Traffic Increase Bytes Objects
(b) Relative improvement in latency reduction as a function of traffic increase
Fig. 6. Relative performance comparison of DDG vs DG algorithms under workload A. The higher values the better is the DDG against DG.
10000 20000 30000 40000 50000 60000 70000 80000 90000 100000 2 4 6 8 10 12 14 16 18 20 #Arcs in model
Lookahead window size DDG
DG
Fig. 7. Arcs represented in the prediction model as a function of the lookahead window size
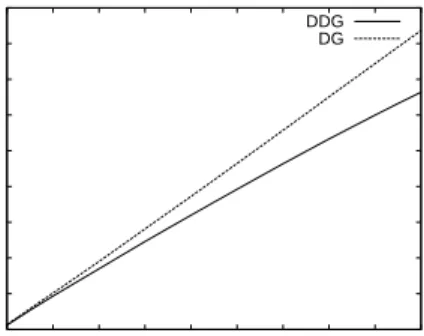
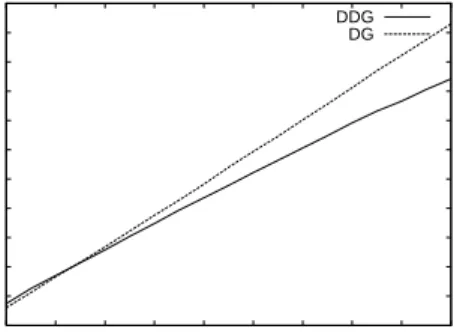
increase in bytes, DDG achieves a latency reduction between 15% and 45% higher than DG (see the continuous curve in Figure 6(b)). The benefits could rise up to 60% of extra perceived latency reduction when taking into account the object traffic increase, as the dashed curve in Figure 6(b) shows.
Figures 5(c) and 5(d) show the results obtained under workload B. Plot 5(c) shows similar results for all algorithms when only the traffic increase (i.e., the network load) is taken into account. However, when looking at the server load, measured by the object traffic increase index (see plot 5(d)), the DDG always outperforms clearly the DG and the PPM algorithms.
3.8 Space
The space overhead required by PPM is usually measured by means of the number of nodes required in the prediction model. However, this metric is not valid for analyzing DG and DDG because they require, for any lookahead window size, as many nodes as different files are in the server. In these algorithms, the amount of arcs in the model is the main metric of space overhead. Figure 7 shows that DDG requires fewer arcs than DG. Differences are higher as larger the lookahead window size is, reaching about 20% for a size of 20. That is due to the limitation introduced by DDG in which there is no arc between two objects in the same lookahead window when the arc goes through more than one HTML.
On the other hand, PPM has much more memory requirements than DG and DDG. For instance, a first-order PPM model requires, under the considered workload, 12,678 nodes. Moreover, this value increases up to 743,065 nodes when considering a 20-order model, that is, about one order of magnitude higher than the DG and DDG algorithms.
3.9 Processor time
Looking at the description of the DDG algorithm, one can realize that this algorithm has the same order of complexity as DG. Figure 8 shows the processor time taken to generate the prediction model. DDG has similar processor time requirements to DG when considering small lookahead window sizes. However, for larger windows, it requires significatively less time to generate the prediction model. That is because DDG processes less arcs than DG.
The time taken by PPM to generate the prediction model is not presented because it exceeds significantly the range of the plot. For instance, the generation of the first-order PPM model takes 2,300 ms, whereas the 20-order model takes 20,200 ms, i.e., one order of
350 400 450 500 550 600 650 700 750 800 850 900 2 4 6 8 10 12 14 16 18 20
Prediction model generation time (ms)
Lookahead window size DDG
DG
Fig. 8. Time required to create the prediction model as a function of the lookahead window size. PPM is not represented due to the higher computing time required (between 2,300 and 20,200 ms)
magnitude higher. 4 Conclusions
This paper has presented a review of the web prediction algorithms appeared in the literature, classifying them according to the information they use to generate the predictions. We also have compared the performance achieved by the most used algorithms (DG and PPM) with a novel algorithm called DDG.
In this paper we have claimed that the way in which previous prediction algorithms manage the objects of a web page does not work fine in the current web. Unlike this common way, the main novelty of the proposed algorithm lies in the fact that it deals with the characteristics of the current web. To this end, the DDG algorithm distinguishes between container objects (HTMLs) and embedded objects (e.g., images) to create the prediction model and to make the predictions.
Experimental results have shown that given an amount of requests to the server, the proposed algorithm outperforms the existing ones by reducing the perceived latency between 15% and 60% more with the same extra requests. Furthermore, these results were achieved not only without increasing the order of complexity with respect to existing algorithms, but also by reducing the processor time and memory requirements if the same lookahead window size is considered.
Acknowledgments
This work has been partially supported by the Spanish Ministry of Science and Innovation under Grant TIN2009-08201, the Generalitat Valenciana under Grant GV/2011/002 and the Universitat Politecnica de Valencia under Grant PAID-06-10/2424.
References
1. B.D. Davison , Assertion: Prefetching with GET is not Good , inProceedings of the 6th Interna-tional Workshop on Web Caching and Content Distribution(Boston, USA, 2001)
2. H.K. Lee and G. Vageesan, K.H. Yum, and E.J. Kim, A PROactive Request Distribution (PRORD) Using Web Log Mining in a Cluster-Based Web Server, inProceedings of the International Con-ference on Parallel Processing (ICPP’06)(Columbus, USA, 2006)
3. S. Schechter, M. Krishnan, and M.D. Smith, Using Path Profiles to Predict HTTP Requests, in
Proceedings of the 7th International World Wide Web Conference(Brisbane, Australia, 1998) 4. E. Cohen and H. Kaplan, Prefetching the means for document transfer: a new approach for
reducing Web latency,Computer Networks39(4) pp437-455 (2002)
5. E. Markatos and C. Chronaki, A Top-10 Approach to Prefetching on the Web, inProceedings of the INET’ 98(Geneva, Switzerland, 1998)
6. Ramesh Sarukkai, Link prediction and path analysis using Markov chains.,Computer Networks, 33(1-6) pp377-386 (2000), DBLP, http://dblp.uni-trier.de
7. L. Fan, P. Cao, W. Lin, and Q. Jacobson, Web Prefetching Between Low-Bandwidth Clients and Proxies: Potential and Performance., in Proceedings of the ACM SIGMETRICS Conference on Measurement and Modeling Of Computer Systems Atlanta, USA, 1999, DBLP, http://dblp.uni-trier.de
8. Z. Su, Q. Yang, Y. Lu, and H-J Zhang, WhatNext: A prediction system for web requests using N-gram sequence models, inProceedings of the 1st International Conference on Web Information Systems and Engineering Conference(Hong Kong, China, 2000)
9. J. Dom`enech, J. ´e A. Gil, J. Sahuquillo, and A. Pont, Web prefetching performance metrics: A survey ,Performance Evaluation63(9–10) pp988–1004 (2006)
10. J. Zhu, J. Hong, and J.G. Hughes, Using Markov Models for Web Site Link Prediction, in Pro-ceedings of the 13th ACM Conference on Hypertext and Hypermedia(College Park, USA, 2002) 11. J. Pitkow and P. Pirolli, Mining Longest Repeating Subsequences to Predict World Wide Web
Surfing, in Proceedings of the 2nd USENIX Symposium on Internet Technologies and Systems
Boulder, USA, 1999
12. J. Verma, A.K. Sharma. A. Goel A Framework for Prefetching Relevant Web Pages using Predic-tive Prefetching Engine (PPE),International Journal of Computer Science Issues7(2010) 13. B. de la Ossa, A. Pont, J. Sahuquillo, and J.A. Gil Referrer Graph: a Low-cost Web Prediction
Algorithm, in Proceedings of the 25th Symposium On Applied Computing (Sierre, Switzerland, 2010)
14. I. Zukerman, D.W. Albrecht, and A.E. Nicholson, Predicting Users’ Requests on the WWW, in
Proceedings of the 7th International Conference on User Modeling(Banff, Canada, 1999) 15. V.N. Padmanabhan and J.C. Mogul, Using Predictive Prefetching to Improve World Wide Web
Latency,Computer Communication Review26(3) pp22–36 (1996)
16. Z. Jiang and L. Kleinrock, An Adaptive Network Prefetch Scheme, IEEE Journal on Selected Areas in Communications16(3) pp358–368 (1998)
17. G. Pallis, A. Vakali, and J. Pokorny A clustering-based prefetching scheme on a Web cache environment, Computers & Electrical Engineering 34 pp309 - 323 (2008), doi:10.1016/j.compeleceng.2007.04.002
18. J. Domenech, J.A. Gil, J. Sahuquillo, and A. Pont Using current web page structure to improve prefetching performance,omputer Networks54(9) pp404 – 1417 (2010)
19. H. Kargupta, A. Joshi, K. Sivakumar, and Y. Yesha (eds),Data Mining: Next Generation Chal-lenges and Future Directions, Chapter 3 (AAAI Press, 2004)
20. author = Q. Yang, J.Z. Huang, and M. Ng, title = A data cube model for prediction-based web prefetching,Journal of Intelligent Information Systems20(1) pp11–30 (2003)
21. S. Gunduz and M. T. Zsu, A Web page prediction model based on click-stream tree representation of user behavior, in KDD ’03: Proceedings of the ninth ACM SIGKDD international conference on Knowledge discovery and data mining, pp535–540 (Washington, D.C., 2003)
22. B. Lan, S. Bressan and B.C. Ooi, and K-L Tan, Rule-assisted prefetching in Web-server caching, in CIKM ’00: Proceedings of the ninth international conference on Information and knowledge management(McLean, Virginia, 2000)
23. Y-F Huang and J-M Hsu, Mining Web Logs to Improve Hit Ratios of Prefetching and Caching , in Proceedings of the 2005 IEEE / WIC / ACM International Conference on Web Intelligence
(Compiegne, France, 2005)
Enhancement, inLecture Notes in Artificial Intelligence (LNAI),2356pp68–87 (Springer-Verlag, 2002)
25. A. Nanopoulos, D. Katsaros, and Y. Manolopoulos, A Data Mining Algorithm for Gen-eralized Web Prefetching. IEEE Trans. Knowl. Data Eng. 15 (5) pp1155-1169 (2003), http://csdl.computer.org/comp/trans/tk/2003/05/k1155abs.htm, DBLP, http://dblp.uni-trier.de 26. D. Bonino, F. Corno, and G. Squillero , Dynamic Prediction of Web Requests , inProceedings of
the IEEE Congress on Evolutionary Computation (Canberra, Australia, 2003)
27. B. Wu and A.D. Kshemkalyani, Objective-Optimal Algorithms for Long-term Web Prefetching,
IEEE Transactions on Computers55(1) pp2–17 (2006)
28. M. Angermann, Analysis of Speculative Prefetching, ACM Mobile Computing and Communica-tions Review6(2) (2002)
29. J.I. Khan and Q. Tao, Exploiting Webspace Organization for Accelerating Web Prefetching, in
Proceedings of the IEEE/WIC International Conference on Web Intelligence (Halifax, Canada, 2003)
30. D. Duchamp, Prefetching Hyperlinks , inProceedings of the 2nd USENIX Symposium on Internet Technologies and Systems (Boulder, USA, 1999)
31. T.I. Ibrahim and C.Z. Xu, Neural Nets based Predictive Prefetching to Tolerate WWW Latency, in Proceedings of the 20th IEEE International Conference on Distributed Computing Systems
(Taipei, Taiwan, 2000)
32. B.D. Davison, Learning Web Request Patterns, inWeb Dynamics - Adapting to Change in Con-tent, Size, Topology and Usepp435-460 (Springer, 2004)
33. A. Sidiropoulos, G. Pallis, D. Katsaros, K. Stamos, A. Vakali, and Y. Manolopoulos Prefetching in Content Distribution Networks via Web Communities Identification and Outsourcing, World Wide Web11pp39 – 70 (2008), doi: 10.1007/s11280-007-0027-8
34. T. Palpanas and A. Mendelzon, Web Prefetching Using Partial Match Prediction, inProceedings of the 4th International Web Caching Workshop(San Diego, USA, 1999)
35. J. Domenech, A. Pont, J. Sahuquillo, and J. Antonio Gil, An Experimen-tal Framework for Testing Web Prefetching Techniques, in Proceedings of the 30th EUROMICRO Conference 2004 pp214–221 (Rennes, France, 2004), http://csdl.computer.org/comp/proceedings/euromicro/2004/2199/00/21990214abs.htm
36. J. Dom`enech, A. Pont, J. Sahuquillo, and J.A. Gil, A User-Focused Evaluation of Web Prefetching Algorithms ,Computer Communications10(30) pp2213–2224 (2007)