Control of
fl
ow separation on a contour bump by jets in a Mach
1.9 free-stream: An experimental study
Kin Hing Lo
n, Hossein Zare-Behtash, Konstantinos Kontis
University of Glasgow, School of Engineering, University Avenue, G12 8QQ, UK
a r t i c l e i n f o
Article history:Received 14 December 2015 Accepted 12 April 2016 Available online 28 April 2016 Keywords:
Contour bump Active jet
Supersonic free-stream
a b s t r a c t
Flow separation control over a three-dimensional contour bump using jet in a Mach 1.9 supersonic free-stream has been experimentally investigated using a transonic/supersonic wind tunnel. Jet total pressure in the range of 0–4 bar was blowing at the valley of the contour bump. Schlieren photography, surface oil flow visualisation and particle image velocimetry measurements were employed forflow visualisation and diagnostics. Experimental results show that blowing jet at the valley of the contour bump can hinder the formation and distort the spanwise vortices. The blowing jet can also reduce the extent offlow separation appears downstream of the bump crest. It was observed that this approach offlow control is more effective when high jet total pressure is employed. It is believed that a pressure gradient is gen-erated as a result of the interaction between theflow downstream of the bump crest and the jet induced shock leads to the downwardsflow motion around the bump valley.
&2016 The Authors. Published by Elsevier Ltd. on behalf of IAA. This is an open access article under the CC BY license (http://creativecommons.org/licenses/by/4.0/).
1. Introduction
Research on two- and three-dimensional contour bumps is an active research topic in the aerospace sector because of their applic-ability in both transonic and supersonic vehicles. Studies on wave drag reduction using contour bumps in transonic aircraft wings have been well documented in the literature[1–14]. It was found that around 10 to 20% of wave drag reduction could be achieved by using thisflow control strategy. In addition, NASA proposed the concept of the Di-verterless Supersonic Inlet (DSI) which implemented three-dimen-sional contour bumps as part of the supersonic inlet in 1950s[15]. Later studies concluded that compared to the other conventional su-personic inlet configurations, DSI could achieve higher total pressure recovery and lowerflow distortion in supersonic speeds[16–20]. The results from these studies eventually materialised and DSI wasfirst implemented into the engines of the Lockheed-Martin F-35 Lightning supersonicfighter aircraft[21].
Although using contour bumps could provide desire performance in drag reduction and high total pressure recovery in transonic and supersonic aircraft, it is known that adverse effects can be induced by flow separation and spanwise vortices formation appear downstream of the bump crest of the bumps[3,14,17]. As a result, it is important to investigate theflow separation characteristics of contour bumps in order to have better understanding in the physics of bump flow.
Surprisingly, only a few studies have been conducted in this area for both subsonic and supersonic speeds. Although the subject matter of the present study is contour bumpflow separation control in super-sonic speed, some background information about theflow physics of contour bumps in subsonic free-stream is also included to provide a more complete literature survey.
In subsonicflow, Byun[22]and Byun et al.[23]investigated ex-perimentally the formation of spanwise vortices downstream of the bump crest for a range of three-dimensional rounded contour bumps. The authors concluded that the number and size of the spanwise vortices that formed depended on the width and apex height of the bump. In addition, large-scale three-dimensionalflow structures were observed which indicated the presence of a wake region downstream of the bump crest. Recently, Yakeno et al. [24] numerically in-vestigated the streamwise flow pattern over a two-dimensional rounded contour bump in laminarflow. The results obtained suggest thatflow separation appears immediately downstream of the bump crest which leads to the formation of three-dimensionalflow struc-tures in the wake region. The authors found that their size and shape depend on the Reynolds number of theflow and a similar conclusion was also drawn by Iaccarino et al.[25]in turbulentflow.
Lo[26], Lo and Kontis[27]and Lo et al.[28,29]investigated ex-perimentally theflow pattern around a three-dimensional rounded contour bump in both Mach no. 1.3 and 1.9 supersonic free-stream. Experimental data showed that flow separation did appear im-mediately downstream of the bump crest which led to the formation of a large wake region. In addition, the authors in these studies showed that counter-rotating spanwise vortices were formed in the bump valley which is agreed with thefinding obtained by Konig et al. Contents lists available atScienceDirect
journal homepage:www.elsevier.com/locate/aa
Acta Astronautica
http://dx.doi.org/10.1016/j.actaastro.2016.04.033
0094-5765/&2016 The Authors. Published by Elsevier Ltd. on behalf of IAA. This is an open access article under the CC BY license (http://creativecommons.org/licenses/by/4.0/).
nCorresponding author.
E-mail addresses:[email protected](K.H. Lo), [email protected](H. Zare-Behtash), [email protected](K. Kontis).
[3]. In addition, the results shown in these studies suggested that the size of the wake region and spanwise vortex pairs that formed downstream of the bump crest decreased when the free-stream Mach number was increased fromM1¼1.3–1.9.
Svensson [30] conducted a numerical study to investigate the streamwise and spanwiseflow patterns over different rounded three-dimensional contour bumps in both subsonic, transonic and super-sonic free-stream to investigate the applicability of contour bumps with various geometries in DSI. The author concluded that for a contour bump with a given bump width and apex height, the size of the wake region and the spanwise vortices that formed in the bump valley increases with increasing free-stream Mach number (M1) whenM1o1. In contrast, whenM141, the size of the wake region and the spanwise vortices decreases with increasing free-stream Mach number. This is agreed with the results shown by Lo[26]and Lo et al.
[28,29].
It is clear that the occurrence offlow separation and the formation of the spanwise vortices increase the pressure drag generated by the bumps. In addition, when contour bumps are used in DSI, these effects lower the total pressure recovery that can be achieved and also affect the uniformity offlow entering the engines[17,30]. Therefore, effec-tive measures must be established in order to achieveflow separation control in contour bumps. Jet blowing is one effective way to achieve flow separation control and it has been extensively investigated in the subsonicflow regime. In contrast, using continuous jet blowing in flow separation control in supersonicflow is less common. The studies conducted by Zubkov et al.[31], Glagolev et al.[32,33], Glagolev and Panov[34]and very recently Beketaeva et al.[51]were some of the earliest experimental studies to investigate the interaction between the injected sonic/supersonic jet and the supersonic free-stream. In these studies, the gaseous jet was injected from aflat plate through orifices of different sizes. Experimental data in these studies showed that complicated three-dimensional compression waves are formed upstream of the injected jet. In addition, a pair of counter-rotating horseshoe-shaped vortices appears immediately downstream of the injected jet and the tips of these horseshoe vortices propagated downstream from the jet.
One of thefirst experimental studies that investigated theflow physics of supersonicflow past aflying object with sonic and super-sonic jet injection employed was conducted by Zubkov et al.[35]. Experimental data in[35]showed that the interaction between the injected jet and the supersonic free-stream leads to the formation of a shock wave immediately upstream of the jet. In addition, counter-rotating vortices were observed in the leeward side of the model. Koike et al.[36]found that by blowing jet continuously at the leeward face of a micro-ramp in a Mach 2.6 free-stream could reduce the extent offlow separation that occurred. The authors explained that the blowing jets reduced the size of the spanwise vortices that formed and also led to the formation of a streamwise vortex pair downstream of the micro-ramp. These streamwise vortices facilitateflow mixing between the low energy boundary layer and the high energy free-stream. As a result, the boundary layer was re-energised and thus
delayedflow separation. Lo et al.[26,28]experimentally investigated flow separation control in a three-dimensional contour bump using active blowing jet in a Mach 1.3 free-stream. Similar to the conclusion obtained by Zubkov et al.[35]and Koike et al.[36], the authors found that the blowing jet hindered the formation of the spanwise vortices and also reduced the size of the wake region that appeared in the bump valley.
The present study aims to extend the previous studies con-ducted by Lo et al.[26,28]to a higher free-stream Mach number to simulate the working conditions of a diverterless supersonic inlet. This experimental study aims tofirstly look at theflow physics of a three-dimensional rounded contour bump with and without ac-tive sonic jet blowing involved in a Mach 1.9 free-stream. Sec-ondly, the effect of the jet total pressure in affecting the stream-wise and spanstream-wiseflow patterns over the contour bump is also included in this study.
2. Experimental setup
2.1. Tri-sonic wind tunnel
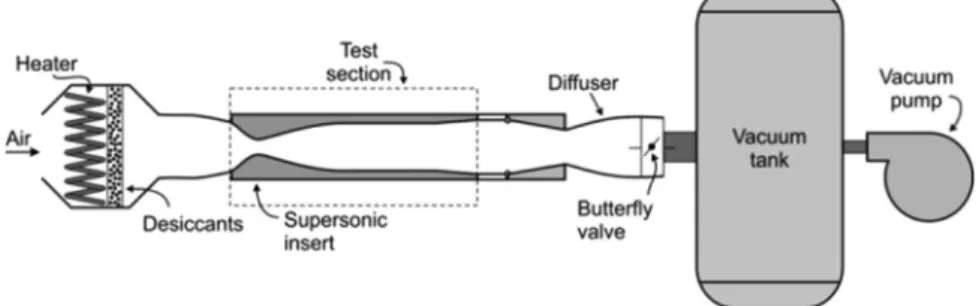
All of the experiments in this campaign were conducted in an intermittent in-draught type tri-sonic wind tunnel. An inter-mittent in-draught type wind tunnel means that the airflow inside it is maintained by means of a pressure difference between the atmosphere (upstream) and vacuum (downstream). A schematic of this wind tunnel facility is shown inFig. 1. The same trisonic wind tunnel was also employed in the experimental studies con-ducted by Lo[26], Lo and Kontis[27], Lo et al.[28,29], Zare-Beh-tash et al.[46,47], and Ukai et al.[48–50]. The wind tunnel has a rectangular test section with dimensions of 485.5 mm (length)
150 mm (width)216 mm (height). The three-dimensional roun-ded contour bump model wasfloor mounted at the middle of the wind tunnel test section. Optical access is achieved through the two quartz side and the top windows which is also made of quartz. A quick opening butterfly valve is situated between the test sec-tion and the vacuum tank. When the butterfly valve is opened, a pressure difference is generated between the upstream of the wind tunnel and the vacuum tank. As a result, a stable airflow is developed inside the wind tunnel. The required Mach 1.9 super-sonic free-stream was generated by expanding the airflow inside the wind tunnel through a pair of convergent–divergent nozzles situated upstream of the test section.
The free-stream Mach number (M1) at the wind tunnel test section was calculated from the total pressure ratio between the upstream and at the test section of the wind tunnel[37]. Pitot probes were inserted into the wind tunnel to obtain information about total pressures at the two different locations. The end of each pitot probe was connected to a Kulite XT-190M pressure transducer viaflexible tubes. The voltage signals from the pres-sure transducer were captured by a National Instruments (NI)
NI-USB-6259 Data Acquisition (DAQ) system at a sampling rate of 20 kHz over a sampling period of 10 s. The tri-sonic wind tunnel has a stable runtime of 6 s. AtM1¼1.9, theflow Reynolds number per unit length (Re/m) is Re/m¼9106 and the maximum tur-bulent intensity level of the free-stream is about 0.7% Under the same initial conditions, the variation of the free-stream Mach number at the test section is aboutM1¼1.970.1.
The velocity profile of theflow measured at the location 10 mm upstream of the contour bump model is shown inFig. 2. A tur-bulentflow velocity profile can be observed fromFig. 2and the boundary layer thickness, based on 99% of the free-stream velocity (
δ
99), is aboutδ
99¼8 mm. Therefore, the boundary layer thickness is about 80% of the bump height.2.2. Contour bump
A three-dimensional rounded contour bump model with jet or-ifices situated in the bump valley (hereafter referred to as the active jet bump) was used in this experimental study. The schematic of the active jet bump is shown inFig. 3. The dimensions of the active jet bump are 75 mm (length)50 mm (width)10 mm (apex height). Three 2 mm diameter jet orifices, aligned at 45°with respect to the transverse direction, are situated in the bump valley 5 mm below the bump crest. One of these three jet orifices is located at the centreline of the bump while the other two are situated 3 mm away from the centreline in the two sides. Sonic air jet at different total pressures (Pjet ) is blowing from these orifices in attempt to affect theflow pattern downstream of the bump crest. Totally, six different jet total pressures ranging from 0 bar (i.e. no jet) to 4 bar were used in the present study. 2.3. High-speed schlieren photography
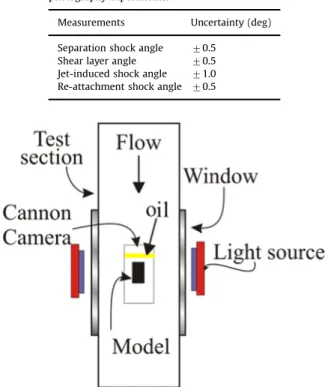
Topler's z-type Schlieren photography technique[38,39]was employed forflow visualisation in the streamwise direction within the tri-sonic wind tunnel. The Schlieren system contains a 450 W continuous Xenon arc-lamp light source, a focusing lens, a slit with 2 mm width, a horizontal knife edge, a set of Hoya 49 mm
diameter close-up lens, and two parabolic mirrors. The diameter and the focal length of each parabolic mirror are 203.2 mm and 2088 mm, respectively. It should be noted that a 5°offset angle with respect to the axis of each parabolic mirror was set to minimise the ‘coma’effect. Schlieren images were captured by a Photron Fastcam SA1.1, monochrome, high-speed camera. The frame rate of the camera was set to 5000 frames per second at a resolution of 1024 pixels1024 pixels. The exposure time of the camera was set to 1
μ
s for capturing unsteadiness effects in the flowfield. The schematic setup of the Schlieren photography ex-periments is shown inFig. 4.The uncertainty of angle measurements using images obtained from the high-speed Schlieren photography experiments is cal-culated using Eq.(1).
σ= ∑ ( − ̅) − ( ) = R R n 1 1 i n i 1 2
In Eq.(1),Riis the angle which measured from an individual Schlieren image andR̅is the mean angle which is measured from n samples. Using Eq.(1), the uncertainties of the separation shock angle, shear layer angle, the reattachment shock angle and the jet-induced shock angle, based on the measurement of 200 individual Schlieren images are calculated and tabulated inTable 1. 2.4. Surfacefluorescent oilflow visualisation
An in-house developedfluorescent oil recipe was used in the surface oil flow visualisation experiments. This fluorescent oil mixed from this recipe is able to follow theflow streaklines ac-curately in supersonic speeds [26–29,32–36]. Fig. 5 shows the schematic setup of the surface oilflow visualisation experiments. Illumination in the surface oilflow experiments was provided by two UV LED (Light Emission Diode) panels with 225 LED units ar-ranged in a 1515 array included in each panel. These two UV LED panels were located adjacent to the two side windows to ensure the entire wind tunnel test section was uniformly illuminated. A layer of fluorescent oil of approximately 10 mm (length)150 mm (width)
5 mm (thickness) was applied 100 mm upstream of the contour bump model. In order to increase contrast, the model wasfirst sprayed with five layers of matt black acyclic paint prior to the experiments. In-stantaneous oil trails along the contour bump model were captured by a ceiling mounted Cannon EOS 600D digital SLR camera which has a maximum resolution of 14 Mp. The ISO speed, shutter speed, and F-number were set to ISO400, 1/4000 s, and F11, respectively. 2.5. Particle image velocimetry
Particle Image Velocimetry (PIV) was employed to measure velocity and otherflow properties along the contour bump mod-els. The laser illumination is provided by a Litron Nano L-series, Nd:YAG Model LPU550 Q-switched double-pulsed laser. The maximum pulse energy output of the system is 200 mJ at 15 Hz repetition rate. The wavelength and the duration of the laser pulses is 532 nm and 4 ns, respectively. The laser beam generated was delivered to the wind tunnel test section via a movable laser guide arm and expanded through a series of optics to form a thin laser sheet (0.8 mm in width). This thin laser sheet illuminated along the centerline of the contour bump model. A schematic setup of the PIV experiments is shown inFig. 6.
The separation time between the two consecutive laser pulses (
δ
t) was set toδ
t¼0.9μ
s. This is calculated based on the theoretically predictedflow speed of the Mach 1.9 free-stream and the size of the interrogation windows that used. Through this setting the displace-ment of the tracer particles between two consecutive frames was 6 pixels. Flow seeding is achieved using olive oil particles generated by Fig. 2.Flow velocity profile in the wind tunnel at 10 mm upstream of the contourbump model.
a TSI Model 9307 oil droplet generator with an aerosolflow rate of 30 L/min. The particle density (
ρ
p) and diameter (dp) are 911 kg/m3 and 1μ
m, respectively so that the corresponding Stokes number (Stk) of the seeder particles is Stk¼0.048. This ensures the seeder particles could trace theflow accurately during the measurements. PIV images were captured by a LaVision Imager Pro X 2 M CCD camera with 1600 pixels1200 pixels which viewed the laser sheet orthogonally. A Nikon 28 mm to 85 mm zoom lens was mounted on the camera. In addition, a 532 nm narrow band-passfilter was placed in front of the lens to minimise the background noise effects.Approximately 80 pairs of wind-on images were recorded during each PIV measurement. Each test case was repeated at leastfive times to ensure thefinal averaged velocity vectorfield was constructed by averaging at least 300 image pairs. The recoded image pairs were processed by the software DaVis 7.2 using cross-correlation algorithm. Multiple stages and passes processing techniques were employed to improve the accuracy of the averaged vector field which resolved
[40,50]. The PIV images were first divided into a number of 64 pixels64 pixels interrogation windows at which two times of cross-correlation were conducted. Then, at the second stage, the in-terrogation windows were refined to 32 pixels32 pixels and an-other three times of cross-correlation calculation were conducted. A
50% of overlapping between two neighbour interrogation windows was used for both stages of vector processing in order to reduce the number of spurious vectors appeared in the processed vectorfield.
The method used in this study to determine the uncertainty of PIV measurements was proposed and adopted by Lusk[41] and Lusk et al.[44,45]. There are three main sources of uncertainties associated with the PIV measurements. These errors include the error arises during the cross-correlation process, the accuracy of the seeder particles to follow theflow streamlines and also the uncertainty in velocity measurement using PIV. The error due to the cross-correlation analysis using the Davis 7.2 software is about 3% of the total number of vectors that are resolved by the cross-correlation algorithm[41,44]. For the accuracy of the seeder par-ticles to follow theflow streamlines, Samimy and Lele[42]shows that the error of the seeder particles to follow theflow increases linearly with the Stokes number (Stk) when Stko1. Typically, when Stk¼0.2, the error of the seeder particles to follow theflow streamlines is about 2%. In the presence study, the maximum Stoke number is Stk¼0.048. Therefore, the maximum error of the seeder particles to follow theflow streamlines is 0.48%.
Grant and Owens[43]proposed a formula (Eq.(2)) to calculate the uncertainty of the velocity measurement (
ε
s) by using PIV under a turbulentflow:ϵ = ( + ) ( ) σ z N T 2 1 2 2 c i2
In Eq.(2),Nis the total number of images obtained from the PIV measurement andzcis the confidence coefficient,Tiis the local turbulent intensity of theflow. Eq.(2)is valid when the turbulent intensity in any part of theflow is smaller than 30%[43]. For a 95% of confidence level, the corresponding confident coefficient iszc ¼1.96. Since at least 300 pairs of images (i.e. minimum 600 ima-ges) are used to produce a time-averaged PIV image and noting that maximum local turbulent intensity of theflow is about 8%, the maximum error in local velocity measurement (
ε
s) using PIV is about 5.6%. By combining all individual errors that occurred in the PIV measurements, the overall uncertainty of the PIV measure-ments is about 6.4%.In addition, the average flow acceleration characteristic (aflow) of the active jet bump with 4 bar total pressure blowing jet employed is evaluated along various normalisedx-locations (i.e.x/hwherehis the apex height of the contour bump). The result obtained is tabulated in
Table 2.
3. Results and discussion
3.1. Surface oilflow visualisation
Fig. 7(a)–(f) show the spanwiseflow pattern over the active jet bump with jet blowing at different total pressures obtained from the surface oilflow visualisation experiments.
Fig. 4. Schematic of the setup of the Schlieren photography experiments.
Table 1
Estimated uncertainties in angle measurements using images obtained from high-speed Schlieren photography experiments.
Measurements Uncertainty (deg) Separation shock angle 70.5
Shear layer angle 70.5 Jet-induced shock angle 71.0 Re-attachment shock angle 70.5
It can be seen fromFig. 7(a)–(f) that upstream of the bump crest the spanwiseflow pattern remains similar for all cases being studied. The incomingflow was deflected upward and sideway by the ramp-shaped front surface of the active jet bump. As a result, theflow followed the contour and moved along the front part of the bump and eventually reached the bump crest. Due to the rapid change in the contour along the bump valley theflow separated downstream of the bump crest which is evidenced by the presence of a separation line (S.L.) at the bump crest.
Theflow pattern along the bump valley of the active jet bump is affected by the blowing jet and cannot be generalised. In the baseline case when no jet is blowing in the bump valley (Fig. 7(a)) two big counter-rotating spanwise vortices (V) are formed in the bump valley. It is deduced that as a result of theflow separation, a low pressure wake region is formed downstream of the bump crest. This low pressure zone attracts the relatively high pressure flow from the two sides of the bump to circulating in the bump valley which eventually leads to the formation of the spanwise vortex pair. Interesting changes appear when jet starts blowing in the valley of the active jet bump. When the total pressure of the blowing jet is set to 0.5 bar (Fig. 7(b)), the two large spanwise vortices shown in the baseline case with no jet blowing (Fig. 7(a)) disappear. Instead, two highly distorted spanwise vortices are formed in the upper part of the bump valley. Similarflow pattern also appears when the jet total pressure is increased to 1 bar (Fig. 7 (c)). In this case, the stronger jet further distorted the spanwise vortex pair that results in the presence of the smaller spanwise vortices in the bump valley.
Further changes appear when higher total pressure jet is used. When the total pressure of the blowing jet is set to 2 bar (Fig. 7
(d)), four mini-vortices (M.V.) are presented in the bump valley. Two of these mini-vortices are formed near the two jet orifices located at the two sides while another two are situated in the lower part of the bump valley. Similarflow pattern can also be
observed once the total pressure of the blowing jet is increased to 3 bar (Fig. 7(e)) and 4 bar (Fig. 7(f)). FromFig. 7(e) and (f), it can be seen that, with these two jet total pressures, the size of the two mini-vortices that situated near the jet orifices reduced sig-nificantly and they could only barely be seen. In contrast, the two mini-vortices located near the rear end of the active jet bump become bigger and more clearly defined.
To summarised, it is observed that the blowing jet can distort and reduce the size of the spanwise vortices that formed in the bump valley, particularly in those cases with high jet total pres-sures employed. In fact, the effects of the injected sonic jet in af-fecting the vortical structures that formed in the leeward side of an object in supersonic free-stream was also documented in[35]. Although a different test model was used by Zubkov et al. [35], some similarity in terms of the effects of injected jet in altering the size and formation location of the spanwise vortices can be ob-served from[35]. It is believed that the blowing jet increases the local pressure level in the area around the three jet orifices in the bump valley. Therefore, lessflow is attracted to move to the bump valley from the two sides which eventually leads to the formation of the smaller spanwise vortices.
There is one point should be noted here. It would be useful if the pressure distributions over various cross sections of the con-tour bump are measured. Unfortunately, no pressure measure-ments were conducted due to the design constraint of the contour bump model. A gas plenum that connected with the three jet or-ifices is situated at the underside of the contour bump model. Therefore, it is not feasible to implement any pressure taps on the bump model as they would have to penetrate through the gas plenum that would completely change theflow pattern over the contour bump.
3.2. Schlieren photography
Schlieren photography images shown inFig. 8(a)–(f) are used to show the streamwise flow pattern along the active jet bump. Flow compression occurred when the incoming Mach 1.9 super-sonic free-stream reaches the front of the active jet bump which results in the formation of a separation shock (S.S.) at the begin-ning of the bump. Across the separation shock, the supersonicflow follows the ramp-shaped front surface of the bump to reach the Fig. 6. Schematic of the setup of the particle image velocimetry experiments.
Table 2
Flow acceleration characteristic along various normalisedx-locations (x/h) of the active jet bump with 4 bar total pressure jet blowing in the bump valley.
aflow(ms2) atx/h¼0 atx/h¼0.25 atx/h¼0.5 atx/h¼0.75
bump crest at which theflow is expanded. This is evidenced by the presence of a series of expansion waves (E.W.) around the bump crest as seen in the Schlieren images. As theflow is separated from the bump immediately downstream of the bump crest, therefore, a shear layer in formed downstream of the bump crest.
Theflow pattern behind the bump crest depends on whether the blowing jet in the bump valley is being turned on. In the baseline case with no jet blowing (Fig. 8(a)), no noticeableflow
feature can be observed along the bump valley. However, in those cases with active jet blowing employed (Fig. 8 (b)–(f)), a shock wave known as the jet induced shock (J.S.) is presented adjacent to the three jet orifices in the bump valley. Its formation is due to the ramping effects induced by the blowing jet. In fact, similar con-clusions and flow features appear around the injected jet were also documented and shown in Zubkov et al. [31,35], Glagolev et al.[32,33]and Glagolev and Panov[34]. Basically, immediately Fig. 8.Schlieren images of the active jet bump with: (a) no jet blowing (0 bar), (b) 0.5 bar, (c) 1 bar, (d) 2 bar, (e) 3 bar, and (f) 4 bar jet total pressure.
upstream of the injected jet, complicated three-dimensional compression waves appear and the collision of these compression waves at a more downstream location leads to the formation of the jet induced shock. In addition, turbulentflow structures are formed immediately downstream of the injected jet. According to Zubkov et al.[31,35], Glagolev et al.[32,33]and Glagolev and Pa-nov [34], these turbulent flow structures are actually a pair of horseshoe-shaped vortices that propagate downstream. Finally, at the rear end of the active jet bump, another shock known as the reattachment shock (R.S.) appears. Across the reattachment shock, theflow becomes parallel to the free-stream direction again.
An interesting observation should be noted here. FromFig. 8
(b)–(f), it can be seen that the shear layer seems to be deflected downward by the jet or the jet induced shock in those cases with jet blowing in the bump valley. It is evidenced by plotting the average shear layer angle (
δ
S.L.) of the active jet bump with and without jet blowing employed (Fig. 9). It should be noted that the averaged shear layer angle in each case is calculated by averaging the shear layer angle of 200 instantaneous Schlieren images. FromFig. 9, it can be seen that the shear layer angle is the largest (i.e. the least downwards) when no jet is blowing in the bump valley. Once jet blowing is activated, the shear layer angle decreases progressively when the total pressure of the blowing jet is in-creased from 0.5 to 2 bar. The shear layer angle is then remained relatively constant with increasing jet total pressure from 2 to 4 bar. From this it is concluded that the blowing jet could deflect the shear layer downwards which, in turn, might affect the size of the wake region that formed downstream of the bump crest. 3.3. Particle image velocimetry (PIV) measurements
Qualitative and quantitative data obtained from Particle Image Velocimetry (PIV) measurements are presented in this sub-section. The time-averagedx- andy-velocity contours along the centerline of the active jet bump with and without jet blowing employed are shown in Figs. 10and 11, respectively. As already mentioned in subsections 3.1 and 3.2, similarflow pattern appears upstream of the bump crest of the active jet bump regardless whether the jet blowing is activated. This can be observed fromFigs. 10and11that similar x- and y-velocity contours are shown upstream of the bump crest in all cases being studied.
It is evidenced by plotting the normalised velocity profiles inx -and y-directions at the normalised location x/h¼3 (i.e. at the middle of the bump front surface) where h is the apex height of the bump (Fig. 12). It should be noted that theflow velocity inx -andy-directions is normalised with the mean free-stream velocity (U1) whereU1¼487 ms1. As very similar velocity profiles are obtained in all cases being studied as seen inFig. 12, this indicates that the blowing jet in the bump valley does not exert any effects in affecting theflow pattern upstream of the bump crest. Although smallfluctuations in the velocity profiles in different cases being
studied can be observed inFig. 12, it is believed that thosefl uc-tuations are caused by small velocityfluctuation during the wind tunnel operation and might be ignored.
In contrast, theflow pattern downstream of the bump crest is strongly influenced by the blowing jet and the total pressure of the jet. In exact, the blowing jet in the bump valley affects the shear layer angle and also the size of the wake region downstream of the bump crest. This can be confirmed by observing the x-velocity contour along the centerline of the active jet bump (Fig. 10). In the baseline case with no jet blowing is employed (Fig. 10(a)), a long and wide low pressure region, i.e. the wake region, appears downstream of the bump crest of the active jet bump. The for-mation of this low pressure wake region is caused by theflow separation that happens immediately downstream of the bump crest. The length (lwake) and the maximum height (hwake) of the wake region are aboutlwake¼0.53candhwake¼0.13c, wherecis the length of the bump. This indicates that the length of the wake region in this case is more than half of the length of the active jet bump.
However, some changes in the size of the wake region occur in those cases with jet blowing employed. In the case when the blowing jet is at 0.5 bar total pressure (Fig. 10(b)), a considerably shorter and narrower wake region is formed in the bump valley compared to the baseline case. Quantitatively, the length and the maximum height of the wake region arelwake¼0.37cand hwake ¼0.11c, respectively. This means that the jet at 0.5 bar total pres-sure could reduce the size of the wake region by 41% compared to the baseline uncontrolled case. Similar results can also be ob-served in those cases when the total pressure of the blowing jet is set to above 0.5 bar (Fig. 10(c)–(f)). When the total pressure of the blowing jet is at 1 bar (Fig. 10 (c)), the size of the wake region becomes marginally smaller than that when the blowing jet pressure is at 0.5 bar. In this case, the length and the maximum height of the wake region are aboutlwake¼0.31candhwake¼0.11c, respectively. This indicates that the wake region is around 51% smaller than that in the baseline case.
Significant changes occurs in the case with 2 bar total pressure jet blowing in the bump valley. As seen inFig. 10(d), a short and narrow wake region is formed downstream of the bump crest. In fact, the size of the wake region in this case is aroundlwake¼0.25c andhwake¼0.09cwhich is 67% smaller than that as seen in the baseline case. The presence of this small wake region indicates that the separated flow quickly reattached downstream of the bump crest. This implies that the extent of flow separation is significantly controlled by the 2 bar total pressure jet in the bump valley. However, the size of the wake region remains relatively constant once the total pressure of the blowing jet is increased to above 2 bar. It can be revealed by observingFig. 10(e) and (f) for the cases in which the total pressure of the blowing jet is at 3 and 4 bar, respectively. Quantitatively, the wake region has the size of lwake¼0.26candhwake¼0.1cat 3 bar whilelwake¼0.24candhwake ¼0.09cat 4 bar jet total pressure. This indicates that the size of the wake region in these two cases is similar to that with 2 bar total pressure jet employed as shown inFig. 10(d).
It is therefore clear that flow separation control in contour bumps can be achieved effectively in supersonic speeds using active jet blowing. In this study, thisflow control strategy is par-ticularly effective when the jet total pressure of the blowing jet is at 2 bar. It is deduced that the blowing jet provides two effects in achievingflow separation control. First of all, the momentum of theflow is increased by the blowing jet which accelerates the re-attachment of the separatedflow downstream of the bump crest. Secondly, the blowing jet seems to be able to reduce the size of the wake region which formed downstream of the bump crest by deflecting the shear layer more downwards. This is partially sup-ported by visualising they-velocity contour along the centerline of Fig. 9. Shear layer angle of the active jet bump at different jet total pressures.
the active jet bump shown inFig. 11. FromFig. 11(a) to (f), a region that shows negativey-velocity (i.e. downwardflow movement) exists slightly downstream of the bump crest in all cases being
studied. However, the size and strength of this region vary with the total pressure of the blowing jet. In the baseline case in which no jet blowing is used (Fig. 11(a)), the region that shows negative Fig. 10.The time-averagedx-velocity contour along the active jet bump with jet total pressure of: (a) no jet, (b) 0.5 bar, (c) 1 bar, (d) 2 bar, (e) 3 bar and (f) 4 bar.
y-velocity is considerably small.
However, once the blowing jet is activated the size of that re-gion increases progressively with increasing jet total pressure from
0.5 to 2 bar (Fig. 11(b)–(d)). This indicates that the flow shows progressively stronger downward movement downstream of the bump crest which, in turn, leads to the formation of progressively Fig. 11.The time-averagedy-velocity contour along the active jet bump with jet total pressure of: (a) no jet, (b) 0.5 bar, (c) 1 bar, (d) 2 bar, (e) 3 bar and (f) 4 bar.
smaller wake region. Interestingly, once the total pressure of the blowing jet increased further to 3–4 bar (Fig. 11(e) and (f)), the region that shows downwardflow movement becomes similar to that as seen in the baseline case (Fig. 11(a)). However, stronger downward flow movement is shown downstream of the bump crest in these cases. This is evidenced by considering the nor-malisedy-velocity profiles of theflow (v/U1) at the normalised locationsx/h¼6 to 8 (Fig. 13), i.e. the wake region that presence downstream of the bump crest, for the cases with jet total pres-sure set to 2–4 bar. In general, the flow shows progressively stronger downward motion at the normalised locationsx/h¼6 and 7 with increasing jet total pressure from 2 to 4 bar. This explains why the wake region remains relatively constant in size once the jet total pressure is above 2 bar although a smaller region which shows downwardflow motion exists.
Time-averagedz-vorticity contour shown in Fig. 14is used to investigate the steadiness of theflow along the active jet bump with and without jet blowing employed. In the baseline case (Fig. 14(a)), theflow immediately downstream of the bump crest is highly rotational resulting from theflow separation that hap-pens there. This is evidenced by the presence of a region that shows relatively high negative z-vorticity downstream of the bump crest. However, once the blowing jet in the bump valley is activated (Fig. 14(b)–(f)), theflow immediately downstream of the bump crest becomes less rotational. It is believed that the blowing jet stabilised the separatedflow by increasing its momentum. In addition, fromFig. 14(a)–(f), it can be seen that in all cases being studied, a region which shows high levels of positivez-vorticity appears in the bump valley. This is due to the presence of the wake region resulting from the flow separation downstream of the bump crest. However, as seen inFig. 14, the size of the region which shows high levels of positivez-vorticity becomes progres-sively smaller when the total pressure of the blowing jet increases progressively from 0 bar (Fig. 14(a)) to 2 bar (Fig. 14(d)) and re-mains relatively constant afterwards. This result further confirmed that blowing jet in the bump valley could effectively achieveflow separation control in contour bumps in supersonic speeds.
4. Conclusions
This study experimentally investigated theflow patterns of the active jets bump with and without jet blowing in the bump valley.
The jet total pressure employed was in the range of 0 bar (i.e. no jet) to 4 bar. Surface oilflow visualisation, Schlieren photography technique and particle image velocimetry measurements were used forflow visualisation and diagnostics. Results obtained from the surface oilflow visualisation experiments suggested that the blowing jet could distort the spanwise vortices that formed in the bump valley. In addition, it was observed that the blowing jet could reduce the size of the spanwise vortices. It is believed that the jet increases the local pressure level, thus hindered the for-mation of the spanwise vortices at the centre portion of the bump valley. Also, it was found that high total pressure jet is more ef-fective is reducing the size of the spanwise vortices in the bump valley. It is deduced that a high total pressure jet exerts effect to a large area in the bump valley, thus making the formation of the spanwise vortices becomes more difficult.
From the Schlieren photography images, it was observed that the blowing jet does not exert any upstream effects to theflow. However, the interaction between the blowing jet and the flow downstream of the bump crest leads to the formation of the jet induced shock in the bump valley. It is believed that the jet in-duced shock or the blowing jet could deflect the shear layer downwards such that it could affect the size of the wake region in the bump valley. In fact, by measuring the average angle of the shear layer for the active jet bump with different jet total pressure employed, it was observed the shear layer angle becomes more negative (i.e. shows stronger downward movement) when the total pressure of the blowing jet is increased from 0 (i.e. no jet) to 2 bar. However, further increase the total pressure of the blowing jet to above 2 bar exerts no significant influence in further chaining the shear layer angle.
From the results obtained from the PIV measurements, it was concluded that the blowing jet in the bump valley could effectively reduce the extent offlow separation appears downstream of the bump crest. It was observed that the size of the wake region be-came progressively smaller when the blowing jet total pressure was progressively increased from 0 to 2 bar and remained rela-tively constant afterwards. In the case when the total pressure of the blowing jet is at 2 bar, the size of the wake region is about 67% smaller than that as seen in the baseline case in which no jet blowing is employed in the bump valley. It is believed that the blowing jet increases the momentum of the separated flow downstream of the bump crest as well as the blowing jet deflects the shear layer downwards. It is deduced that the combination of Fig. 12.The normalised velocity profiles inx- andy-directions of the active jet bump with different jet total pressures at the normalised locationx/h¼3 (i.e. middle of the bump front surface).
these two effects lead to the quick reattachment of the separated flow downstream of the bump crest which eventually reduces the size of the wake region.
Finally, it was concluded from thez-vorticity contour plots that the flow downstream of the bump crest shows lower vorticity
when jet is blowing in the valley of the active jet bump compared to the baseline case. This, in turns, indicated that the blowing jet in the bump valley could increase the steadiness of theflow down-stream of the bump crest of the active jet bump, particularly when the blowing jet has high total pressure. This is believed to be due Fig. 13.The normalisedy-velocities of theflow at the normalised locationsx/h¼6, 7 and 8 (i.e. in the wake region of the model) of the active jet bump with (a) 2 bar, (b) 3 bar and (c) 4 bar jet total pressure.
to the blowing jet in the bump valley increases the momentum and thus, stabilised theflow downstream of the bump crest of the active jet bump.
Author contributions
Kin Hing Lo: Experimental Campaign, data analysis and Fig. 14.The time-averagedz-vorticity contour along the active jet bump with jet total pressure of: (a) no jet, (b) 0.5 bar, (c) 1 bar, (d) 2 bar, (e) 3 bar and (f) 4 bar.
manuscript preparation. Hossein Zare-Behtash and Kostas Kontis are project supervisors.
Conflicts of Interest
The authors declare no conflict of interest.
Acknowledgements
The authors would like to acknowledge the EPSRC (Grant number: EPSRC iCASE/DSTL/MBDA 12440107) for funding this re-search project. In addition, the authors also would like to ac-knowledge the EPSRC loan pool for the Photon FastCam SA1.1 monochrome camera used in this experimental study.
References
[1] M. Kutzbach, T. Lutz, S. Wagner, Investigations on shock control bumps for infinite swept wings, in: Proceedings of the 2nd AIAA Flow Control Con-ference, Portland, Orlando, June 27–July 1, 2004.
[2]N. Qin, W.S. Wong, A. Le Moigne, Three-dimensional Contour Bumps for Transonic Wing Drag Reduction, Proc. I MECH E Part G J. Aerosp. Eng. 222 (5) (2008) 619–629.
[3]B. Konig, M. Patzold, T. Lutz, E. Kramer, H. Rosemann, K. Richter, H. Uhlemann, Numerical and experimental validation of three-dimensional shock control bumps, J. Aircr. 46 (2) (2009) 675–682.
[4] P.R. Ashill, J. L. Fulker, A. Shires, A novel technique for controlling shock strength of laminarflow aerofoil sections, in: Proceedings of the First Eur-opean Symposium on Laminar Flow, Hamburg, March 1992.
[5]J. Birkemeyer, H. Rosemann, E. Stanewsky, Shock control on a swept wing, Journal. Aerosp. Sci. Technol. 4 (3) (2000) 147–156.
[6] G. Liu, Y. Tao, Q. Guo, Y. Sun, Transonic drag reduction with contour bump on a supercritical airfoil, in: Proceeding of the Second International Conference on Intelligent Systems Design and Engineering Application, Sanya, Hainan, Jan-uary 6–7, 2012.
[7] M. Patzold, T. Lutz, T. Kramer, S. Wagner, Numerical optimisation offinite shock control bump, in: Proceedings of the 44th AIAA Aerospace Sciences Meeting and Exhibition, Reno, Nevada, United States, January 9–12, 2006. [8] B. König, M. Pätzold, t. Lutz, E. Krämer, Shock Control Bumps on Flexible and
Trimmed Transport Aircraft in Transonic Flow, New Results in Numerical and Experimental Fluid Mechanics VI, Notes on Numerical Fluid Mechanics and Multidisciplinary Design (NNFM), vol. 96, 2007, pp. 80–87.
[9]W.E. Miholen II, L.R. Owen, On the application of contour bumps for transonic drag reduction (invited), AIAA Pap. (2005) 2005-0462.
[10]R. Duvigneau, P. Chandrashekar, Kriging-based optimisation applied toflow control, Int. J. Numer. Methods Fluids 69 (11) (2012) 1701–1714.
[11]D.S. Lee, G. Bugeda, J. Periaux, E. Onate, Robust active shock control bump design optimization using hybrid parallel MOGA, Comput. Fluids 80 (2013) 214–224.
[12]H. Ogawa, H. Babinsky, M. Patzold, T. Lutz, Shock-wave/boundary-layer in-teraction control using three-dimensional bumps for transonic wings, AIAA J. 46 (6) (2008) 1442–1452.
[13] H. Rosemann, K. Richter, J. Birkemeyer, A.-M. Rodde, V. Schmitt, Application of a 3D shock control bump on a transport aircraft configuration, in: Proceedings of ONERA-DLR Congress, June 2003.
[14]Y. Yang, X. Liu, S. Asif, Transonic drag reduction on supercritical wing section using shock control bumps, Trans. Nanjing Univ. Aeronaut. Astronaut. 29 (3) (2012).
[15] P.C. Simon, D.W. Brown, R.G. Huff, Performance of External-Compression Bump Inlet at Mach Numbers of 1.5 and 2.0, NACA Report, NACA-RM-E56L19, 1957.
[16]W. Xie, R. Guo, A ventral diverterless high offset S-shaped inlet at transonic speeds, Chin. J. Aeronaut. 21 (3) (2008) 207–214.
[17] J. Masud, F. Akram, Flowfield and performance analysis of an integrated di-verterless supersonic inlet, in: Proceedings of the 48th AIAA Aerospace Sci-ences Meeting Including the New Horizons Forum and Aerospace Exposition, Orlando, Florida, United States, January 4–7, 2010.
[18]Y.K. Yang, Research of bump inlet design and test, Acta Aerodyn. Sinica 25 (3) (2007) 336–338.
[19]B. Tillotson, E. Loth, J. Dutton, J. Mace, B. Haeffele, Experimental study of a Mach 3 bump-compressionflowfield, J. Propuls. Power 25 (3) (2009) 545–554. [20]Y.C. Zhong, S.Z. Yu, Q. Wu, Research of bump inlet (DSI) model design and its
aerodynamic properties, J. Aerosp. Power 20 (5) (2005) 740–745.
[21] P. Wooden, Use of CFD in developing the JSF F-35 outer mold lines, in: Pro-ceedings of the 24th AIAA Applied Aerodynamics Conference, San Francisco, California, United States, June 5–8, 2006.
[22]G. Byun PhD thesis, Structure of Three-dimensional Separated Flow on Sym-metric Bumps, Virginia Polytechnic Institute and State University, Blacksburg, Virginia, 2005.
[23]G. Byun, C. Long, R. Simpson, Study of vortical separation from three-dimen-sional symmetric bumps, AIAA Journal. 42 (4) (2004) 754–765.
[24]A. Yakeno, S. Kawai, T. Nonomura, K. Fujii, Separation control based on tur-bulence transition around a two-dimensional hump at different Reynolds numbers, Int. J. Heat Fluid Flow 55 (2015) 52–64.
[25] G. Iaccarino, C. Marongiu, P. Catalano, M. Amato, RANS simulation of the se-paratedflow over a bump with active control, Annual Research Briefs, Centre for Turbulence Research, 2003, pp. 389–397.
[26]K.H. Lo PhD thesis, Experimental Studies on Contour Bumps and Cavities at Supersonic Speed, University of Manchester, Manchester, United Kingdom, 2014.
[27] K.H. Lo, K. Kontis, Flow physics of a three-dimensional rounded contour bump in a Mach 1.3 supersonic free-stream, in: Proceedings of AIAA Aviation 2015, Dallas, Texas, United States, June 22–26, 2015.
[28] K.H. Lo, H. Zare-Behtash, K. Kontis, Flow characteristics along an active jets equipped contour bump in a supersonic freestream and its potential to be applied on transonic aircraft for drag reduction: an experimental study, in: Proceedings of the 53rd AIAA Aerospace Sciences Meeting Kissimmee, Florida, January, 5–9, 2015.
[29] K.H. Lo, H. Zare-Behtash, M. Johnson, K. Kontis, Control offlow separation on a contour bump by jets: an experimental study. in: Proceedings of the 29th International Symposium on Shock Waves, Madison, United States, July 14–19, 2013.
[30] M. Svensson, A CFD Investigation of a Generic Bump and its Application to a Diverterless Supersonic Inlet, Linkopings Universitet, Master Thesis, Linkop-ing, Sweden, 2013.
[31] A.I. Zubkov, A.I. Glagolev, Yu. A. Panov, J.S. Hopkins, Discharge of gas jets into a supersonic stream from orifices in the lateral surface of a body, Technical Report, Defense Technical Information Center, Feb 1969, pp. 1–15.
[32]A.I. Glagolev, A.I. Zubkov, Yu. A. Panov, Supersonicflow past a gas jet obstacle emerging from a plate, Fluid Dyn. 2 (1967) 60–64.
[33]A.I. Glagolev, A.I. Zubkov, Yu. A. Panov, Interaction between a supersonicflow and gas issuing from a hole in a plate, Fluid Dyn. 3 (1968) 65–67.
[34]A.I. Glagolev, Yu. A. Panov, Interaction of a sonic boundary-layer counter-jet with a supersonicflow, Fluid Dyn. 12 (1977) 795–798.
[35]A.I. Zubkov, A.I. Glagolev, Yu. A. Panov, Injection of gaseous jets in supersonic
flow from orifices located on a side wall of aflying body, Mosc. Univ. Mech. Bull., Ser. 1 Math., Mech. No 5 (1968) 66–72.
[36]S. Koike, K. Suzuki, E. Kitamura, M. Hirota, K. Takita, G. Masuya, M. Matsumoto, Measurement of vortices and shock waves produced by ramp and twin jets, J. Propuls. Power 22 (2006) 1059–1067.
[37]A. Pope, K.L. Goin, in: Robert E. Krieger (Ed.), High-speed Wind Tunnel Testing. Huntington, Publishing Company, New York, 1978.
[38]G.S. Settles, Schlieren and Shadowgraph Techniques, Springer Verlag, New York, 2001.
[39]L. Yang, H. Zare-Behtash, E. Erdem, K. Kontis, Application of AA-PSP to hy-personicflows: the double ramp model, Sens. Actuators B: Chem. 161 (2012) 100–107.
[40]J.W. Bradley, J.S. Oh, O.T. Olabanji, C. Hale, R. Mariani, K. Kontis, Schlieren photography of the outflow from a plasma jet, IEEE Trans. Plasma Sci. 39 (11) (2011) 2312–2313.
[41]W.T. Lusk, Control of Supersonic Cavity Flow by Leading Edge Blowing, Uni-versity of Florida, United States, 2011, Master thesis.
[42]M. Samimy, S.K. Lele, Motion of particles with inertia in a compressible free shear layer, Phys. Fluids 3 (1991) 1915–1923.
[43]I. Grant, E.H. Owens, Confidence interval estimates in PIV measurements of turbulentflows, Appl. Opt. 29 (10) (1990) 1400–1402.
[44] T. Lusk, J. Dudley, L. Ukeiley, L. Cattafesta,flowfield effects on control on supersonic open cavities, in: Proceedings of the 49th AIAA Aerospace Sciences Meeting Including the New Horizons Forum and Aerospace Exposition, Or-lando, Florida, United States, 4–7 January, 2011.
[45]T. Lusk, L. Cattafesta, L. Ukeiley, Leading edge slot blowing on an open cavity in supersonicflow, Exp. Fluid 53 (2012) 187–199.
[46]H. Zare-Behtash, K.H. Lo, K. Kontis, T. Ukai, S. Obayashi, Transverse jet-cavity interactions with the influence of an impinging shock, Int. J. Heat Fluid Flow 53 (2015) 146–155.
[47]H. Zare-Behtash, K.H. Lo, L. Yang, K. Kontis, Pressure sensitive paint mea-surements at high Mach numbers, Flow Meas. Instrum. (2016), In press. [48] H. Zare-Behtash, K.H. Lo, T. Ukai, K. Kontis, S. Obayashi, Experimental
in-vestigation of impinging shock-cavity interactions with upstream transverse jet injection, Trans. Jpn. Soc. Aeronaut. Space Sci. Aerosp. Technol. Jpn. 12 (ists29) (2014) 57–62,http://dx.doi.org/10.2322/tastj.12.Pe_57.
[49]T. Ukai, H. Zare-Behtash, E. Erdem, K.H. Lo, K. Kontis, S. Obayashi, Effectiveness of jet location on mixing characteristics inside a cavity in supersonicflow, Exp. Therm. Fluid Sci. 52 (2014) 59–67.
[50]T. Ukai, H. Zare-Behtash, K.H. Lo, K. Kontis, S. Obayashi, Effectiveness of dual jets distance on mixing characteristics andflow path within a cavity in su-personic crossflow, Int. J. Heat Fluid Flow 50 (2014) 254–262.
[51]A.O. Beketaeva, P. Bruel, A. Zh Naimanova, Vortical structures behind a transverse jet in a supersonicflow at high jet to crossflow pressure ratios, J. Appl. Mech. Tech. Phys. 56 (2015) 777–788.