Mahumud, Rashidul Alam and Sultana, Marufa and Sarker, Abdur
Razzaque (2017) Distribution and determinants of low birth weight in
developing countries. J Prev Med Public Health, 50 (1). pp. 18-28. ISSN
1975-8375 , http://dx.doi.org/10.3961/jpmph.16.087
This version is available at http://strathprints.strath.ac.uk/59673/
Strathprints is designed to allow users to access the research output of the University of Strathclyde. Unless otherwise explicitly stated on the manuscript, Copyright © and Moral Rights for the papers on this site are retained by the individual authors and/or other copyright owners. Please check the manuscript for details of any other licences that may have been applied. You may not engage in further distribution of the material for any profitmaking activities or any commercial gain. You may freely distribute both the url (http://strathprints.strath.ac.uk/) and the content of this paper for research or private study, educational, or not-for-profit purposes without prior permission or charge.
Any correspondence concerning this service should be sent to Strathprints administrator: [email protected]
Preventive Medicine
&
Public Health
J Prev Med Public Health 2017;50:18-28 • https://doi.org/10.3961/jpmph.16.087
Distribution and Determinants of Low Birth Weight in
Developing Countries
Rashidul Alam Mahumud1, Marufa Sultana1, Abdur Razzaque Sarker1,2 1
Health Economics and Financing Research, Health Systems and Population Studies Division, International Centre for Diarrhoeal Disease Research, Bangladesh (icddr,b), Dhaka, Bangladesh; 2Department of Management Science, University of Strathclyde, Glasgow, United Kingdom
Original Article
Objectives: Low birth weight (LBW) is a major public health concern, especially in developing countries, and is frequently related to
child morbidity and mortality. This study aimed to identify key determinants that inluence the prevalence of LBW in selected devel-oping countries.
Methods: Secondary data analysis was conducted using 10 recent Demography and Health Surveys from developing countries based
on the availability of the required information for the years 2010 to 2013. Associations of demographic, socioeconomic, community-based, and individual factors of the mother with LBW in infants were evaluated using multivariate logistic regression analysis.
Results: The overall prevalence of LBW in the study countries was 15.9% (range, 9.0 to 35.1%). The following factors were shown to
have a signiicant association with the risk of having an LBW infant in developing countries: maternal age of 35 to 49 years (adjusted odds ratio [aOR], 1.7; 95% conidence interval [CI], 1.2 to 3.1; p<0.01), inadequate antenatal care (ANC) (aOR, 1.7; 95% CI, 1.1 to 2.8;
p<0.01), illiteracy (aOR, 1.5; 95% CI, 1.1 to 2.7; p<0.001), delayed conception (aOR, 1.8; 95% CI, 1.4 to 2.5; p<0.001), low body mass index (aOR, 1.6; 95% CI, 1.2 to 2.1; p<0.001) and being in the poorest socioeconomic stratum (aOR, 1.4; 95% CI, 1.1 to 1.8; p<0.001).
Conclusions: This study demonstrated that delayed conception, advanced maternal age, and inadequate ANC visits had independent
efects on the prevalence of LBW. Strategies should be implemented based on these indings with the goal of developing policy op-tions for improving the overall maternal health status in developing countries.
Key words: Developing countries, Global health, Low birth weight, Odds ratio
Received: September 19, 2016, Accepted: December 19, 2016
Corresponding author: Rashidul Alam Mahumud, MSc 68 Shaheed Tajuddin Ahmed Sarani, Mohakhali, Dhaka, Bangladesh Tel: +880-2-9827001-10, Fax: +880-2-8811568
E-mail: [email protected]
This is an Open Access article distributed under the terms of the Creative Commons Attribution Non-Commercial License (http://creativecommons.org/licenses/by-nc/4.0/) which permits unrestricted non-commercial use, distribution, and repro-duction in any medium, provided the original work is properly cited.
INTRODUCTION
Infant birth weight is a signiicant predictor of the immedi-ate and future health status of a newborn. Low birth weight
pISSN 1975-8375 eISSN 2233-4521
(LBW) is a major public health concern and one of the stron-gest single risk factors for early neonatal mortality and mor-bidity [1,2]. According to the World Health Organization, the prevalence of LBW is 15.5% globally, and 96.5% of LBW infants are born in developing countries [3,4]. LBW has been deined as a birth weight of less than 2500 g regardless of gestational age. Consequently, LBW is considered to be associated with a greater risk of early childhood death than is associated with normal birth weight [5]. Furthermore, it is a signiicant factor associated with higher probabilities of infection, greater sus-ceptibility to childhood illness, lower chances of child survival, long-term physical and mental deiciencies, and problems re-lated to behavior, learning, and psychosocial improvements
during childhood [2,6]. In the perinatal period, LBW infants are in a critical state with regard to survival, and approximately half of all neonatal deaths are directly or indirectly linked to LBW [7]. This adverse pregnancy outcome may be inluenced by several conditions, such as heart disease, diabetes, hyper-tension, behavioral disorders, impaired cognitive function, psychological disorders, and a substantial risk of complications related to the stoma includes the esophagus, stomach, duode-num, ileum, colon, pleural cavity, ureters, urinary bladder, and kidney pelvis etc. [8], and usually incurs long-term financial burdens for households [9,10]. Furthermore, with the demo-graphic change of increased life expectancy at birth in devel-oping countries, children born with LBW can cause an in-creased economic burden and an inin-creased disease burden [10,11]. Consequently, LBW is considered as a universal threat for developing countries that creates a barrier for child devel-opment [12,13]. Previous studies have shown several factors to be determinants of LBW and have demonstrated that pre-venting those factors can help reduce early childhood morbid-ity and mortalmorbid-ity [14]. The determinants of LBW can be broadly classiied as genetic, constitutional, obstetric, nutritional, relat-ed to maternal morbidities in the antenatal period, toxic expo-sure-related, and linked to antenatal care (ANC). Other factors including smoking, maternal age, birth spacing, ANC, anemia, genital infections, maternal ill health, and stress have also been reported [15]. Research on the prevalence and determi-nants of LBW has been conducted using nationwide popula-tion-based survey data, with some studies focusing on devel-oping countries. However, most of the multi-country studies were conducted using recalled birth weight data, with moth-ers reporting information about the size of their newborn baby (e.g., very small, small, normal, large, and very large) from memory, which may have affected the accuracy of the results regarding LBW [16]. This study used a continuous type of birth weight data derived from Demography and Health Surveys (DHSs) among 10 selected developing countries. However, global development has entered a new era, as world leaders have evaluated the achievements of the Millennium Development Goals and adopted the 2030 Agenda for Sus-tainable Development in the name of SusSus-tainable Develop-ment Goals (SDGs). The specific SDGs known as the health goal (goal No. 3) aims to “ensure healthy lives and promote well-being for all at all ages,” with one of the important targets being to ensure universal access to reproductive health care services, including family planning, information and
educa-tion, and the integration of reproductive health into national strategies and programs. The aim of this study was to investi-gate the distribution and determinants of LBW in selected de-veloping countries so that policy makers in all countries can design efective plans for building stronger communities, em-phasizing a comprehensive approach to reach their objectives, particularly SDG-3.
METHODS
Study Design
Secondary data analysis was carried out using DHS data for the period of 2010 to 2013 from the following least-developed countries as deined by the World Bank: US (2010), Cambodia (2010), Colombia (2010), Indonesia (2012), Jordan (2012), Ne-pal (2011), Pakistan (2012-2013), Tanzania (2010), Uganda (2011), and Zimbabwe (2010-2011). Moreover, those surveys used continuous of birth weight data, which was another cri-terion for choosing those countries.
Data Collection and Sampling Technique
The DHS collected national-level household-based survey data on birth weight retrospectively from mothers whose youngest child was under five years of age. The DHS used a stratified, two-stage cluster sampling design. The first stage involved selecting samples from a master sampling frame constructed from enumeration, and the second stage involved systematic sampling of the households listed from each clus-ter, to ensure that adequate numbers of completed individual interviews were obtained. The survey collected data through questionnaire-based face-to-face interviews, for which wom-en of reproductive age (15 to 49 years) were interviewed based on the Measure DHS program model. Each respondent (mother) was asked to provide a detailed birth history for births in the preceding survey. Birth weight was recorded us-ing the metric scale (in grams) in all selected study countries. Details regarding the sample design, specific consent, and data collection procedures have been reported elsewhere, in the DHS reports from the individual countries [17].
Outcome Variable
The DHS recorded birth weight data from mothers whose youngest child was less than five years old in the five years preceding the survey using health card records. Entries on health cards were generally completed by a physician or a
health worker and given to mothers upon discharge from the health facility (e.g., hospital, clinic or any other healthcare in-stitution). Reporting birth weight information on health cards has been found to be more reliable than obtaining birth weight information through maternal recall [18]. The birth weight information derived from the DHS may include possi-ble misclassifications, as the DHS used the proxy variapossi-ble of the reported size of the infant at birth, which may lead to po-tential heaping [18-21]. This study analyzed only the numeri-cal birth weight data contained in the DHS survey for only the most recent children. Finally, birth weight data were classiied into two groups: non-LBW (birth weight 2500 g) or LBW (birth weight <2500 g). Data from children with a missing birth weight, mothers with twin or multiple pregnancies, and stillbirths were excluded from the analysis.
Independent Variables
The study variables were selected based on epidemiological information, prior studies, a review of the relevant published demographic studies, and the available information in the DHS datasets, with a consideration of potential confounders [22-24]. Individual-level factors such as maternal age, the height of the mother, sex of the child, educational status, oc-cupational status, parity, ANC visits, intake of iron during preg-nancy, maternal hemoglobin (Hb) levels, and nutritional sta-tus, as well as community-level factors, such as wealth status and place of residence, were considered in the study. Maternal age was divided into the categories of 19 years, 20-34 years, and 35-49 years, and maternal height was defined as short (≤145 cm), average (146-155 cm), or tall (>155 cm). The sex of the child was recorded as male or female. Education level was deined as no education, primary education, or secondary or higher education, and current occupational status was clas-siied as not working or working. Frequency of ANC visits was deined as inadequate (0 or 1), intermediate (2 or 3), or ade-quate (4 or more), and parity was classiied as irst birth, 2-3 births, 4 or more births. Age at irst cohabitation was deined as 12 years, 13-17 years, or 18 years. Whether the mother had taken iron pills during pregnancy was recorded as yes or no. Maternal Hb levels were measured using the HemoCue (HemoCue, Angelholm, Sweden) rapid testing method, and participants were divided based on whether their Hb level was <12.0 g/dL or 12.0 g/dL. Height and body weight were ob-tained from the dataset, and body mass index (BMI) was cal-culated as the ratio of weight in kilograms to height in meters
squared (kg/m2). BMI was further categorized into three groups: low (≤18.5 kg/m2), normal or healthy weight (18.5-24.9 kg/m2) or overweight (BMI >24.9 kg/m2). The DHS ap-plied an asset-based approach to estimate household wealth status, which was measured based on the ownership of dura-ble assets. Each variadura-ble (asset) was dichotomized as 1 if pres-ent and 0 if not, and the wealth index was constructed using principal component analysis (PCA). Weights were determined by factor scores derived from the irst principal component in the PCA. The constructed wealth index values were then as-signed to each individual based on common variables. We es-tablished cutof values for percentiles of the population, and we classified participants into three groups: poor (bottom 40%), middle (middle 40%), or rich (top 20%), following the cutofs used in an earlier study. Place of residence was classi-ied as rural or urban.
Statistical Analysis
In the descriptive analyses, the characteristics of the study population for selected countries were expressed as percent-ages (%) with 95% conidence interval (CIs). For independent variables, the category found to be at the least risk for having an LBW baby in the analysis was considered as the reference for constructing odds ratios (ORs). A multivariate logistic re-gression model was applied to estimate ORs as a measure of the associations between LBW and related risk factors after considering potential confounders. The diagnostic tests were employed in the analyses. Normality test for the birth weight data was accomplished through graphically. Goodness of fit was assessed using the Hosmer and Lemeshow statistic [25]. The variance inlation factor (VIF) test was performed to deter-mine whether multicollinearity was present. For all the tests conducted in the study, p<0.05 were considered to indicate statistical significance. In the analyses, the sampling weight was adjusted based on the DHS data [26], and all statistical analyses were carried out using Stata/SE 13.0 (StataCorp, Col-lege Station, TX, USA).
Ethical Approval
Ethical clearance to conduct the DHS was obtained from the Measure DHS and the Ethics Committee of ICF Macro (Calver-ton, MD, USA). The DHS data are publicly accessible and were made available to us upon request by Measure DHS.
RESULTS
Population Characteristics
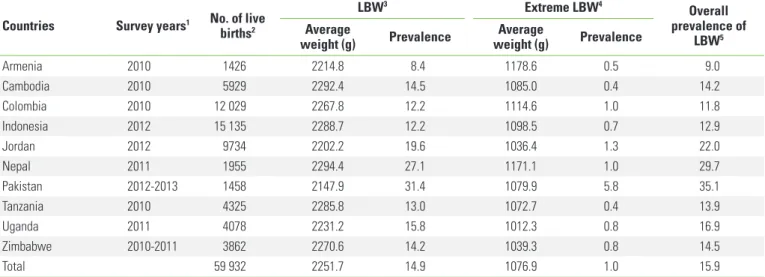
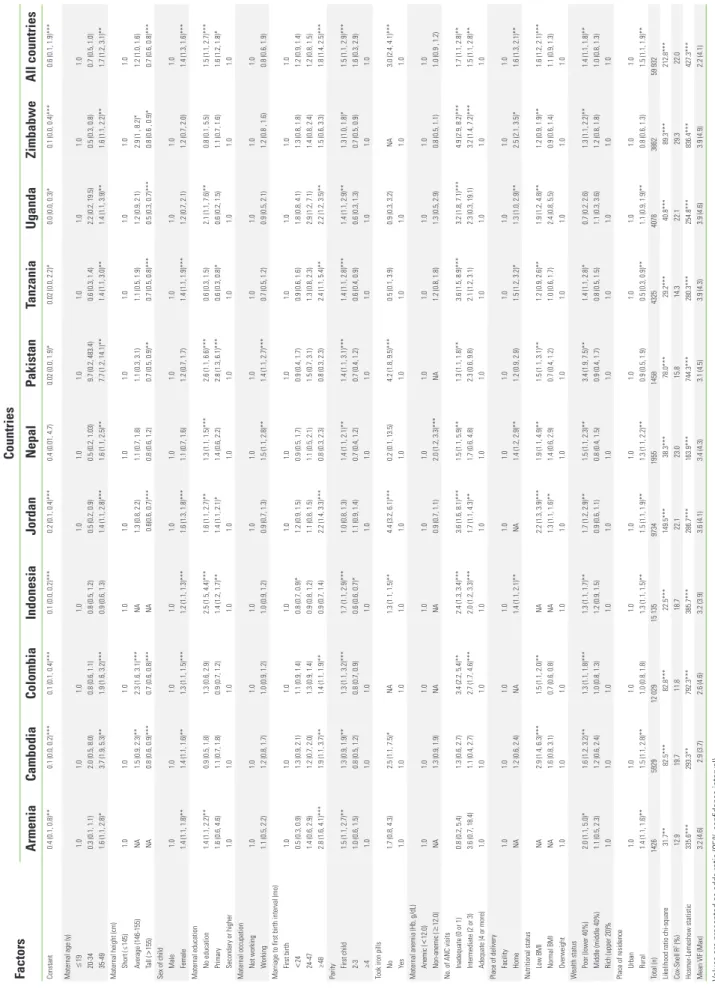
A total of 59 932 live births were recorded in the study coun-tries (Table 1); Indonesia had the highest number (15 135 live births), followed by Colombia (12 029 live births). Birth weight data were demonstrated to be normally distributed (Figure 1). The overall prevalence of LBW was 15.9% (95% CI, 15.6 to 16.2%), and the average birth weight of LBW babies was 2179 g (Figure 2). Pakistan had the highest prevalence of LBW (35.1%; 95% CI, 32.9 to 37.3%), followed by Nepal (29.7%; 95% CI, 27.7 to 31.7%), with average birth weights of 1988 g and 2255 g, respectively (Table 1).
The majority of the mothers (73.5%) were between 20 and 34 years of age, and more than half of the mothers did not have any formal education, with the highest proportion found in Pakistan (57.2%), followed by Nepal (46.5%) (Table 2). Overall, 52% of mothers were non-working, with the highest amount observed in Jordan (85.7%), followed by Pakistan (74.2%). Ap-proximately 93.8% of mothers had taken iron pills, and more than 63% of mothers had not an acceptable level of Hb (<12.0 g/dL). Overall, approximately 69.8% of mothers received ade-quate ANC (4 or more visits) during their last pregnancy. How-ever, the highest percentages of adequate ANC were observed
among the mothers in Armenia (94.8%), Colombia (89.8%), In-donesia (88.4%), and Jordan (94.5%). Nearly half of the mothers lived in households with a low socioeconomic status (Table 2).
Factors Influencing the Determinants of Low
Birth Weight
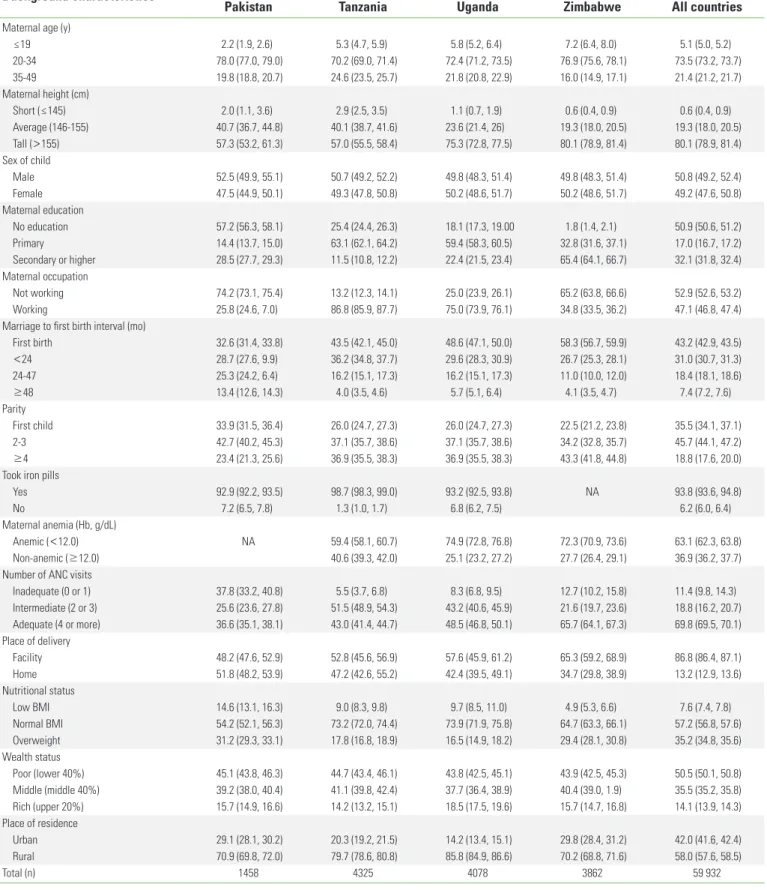
In this study, step-up methods were used to enter all factors into a single regression model for adjusted analysis (Table 3). This model showed that a number of factors signiicantly inlu-enced LBW. The regression model explained 22% of total varia-tion (Cox-Snell R2=22%). The VIF test, which had a mean (max-imum) value of 2.22 (4.12), indicated that no evidence of mul-ticollinearity was present in the regression model. The Hosmer and Lemeshow statistic showed no signiicant diference be-tween the model and observed data, conirming a good it of the model to the data. Mothers with advanced age (35 to 49 years) had a signiicantly greater risk of delivering LBW babies than younger mothers (p<0.01) (Table 3). Illiterate mothers (no formal education) had a higher risk of delivering LBW babies than more highly educated mothers in Armenia (OR, 1.4; 95% CI, 1.1 to 2.2; p<0.01), Indonesia (OR, 2.5; 95% CI, 1.5 to 4.4;
p<0.001), Jordan (OR, 1.6; 95% CI, 1.1 to 2.7; p<0.01), Nepal (OR, 1.3; 95% CI, 1.1 to 1.5; p<0.001), Pakistan (OR, 2.6; 95% CI, 1.3 to 6.6; p<0.001), and Uganda (OR, 2.1; 95% CI, 1.6 to 7.6;
Table 1. Distribution of birth weight for respondents’ most recent pregnancy in 10 selected developing countries, with the years surveyed
Countries Survey years1 No. of live
births2 LBW3 Extreme LBW4 Overall prevalence of LBW5 Average weight (g) Prevalence Average weight (g) Prevalence Armenia 2010 1426 2214.8 8.4 1178.6 0.5 9.0 Cambodia 2010 5929 2292.4 14.5 1085.0 0.4 14.2 Colombia 2010 12 029 2267.8 12.2 1114.6 1.0 11.8 Indonesia 2012 15 135 2288.7 12.2 1098.5 0.7 12.9 Jordan 2012 9734 2202.2 19.6 1036.4 1.3 22.0 Nepal 2011 1955 2294.4 27.1 1171.1 1.0 29.7 Pakistan 2012-2013 1458 2147.9 31.4 1079.9 5.8 35.1 Tanzania 2010 4325 2285.8 13.0 1072.7 0.4 13.9 Uganda 2011 4078 2231.2 15.8 1012.3 0.8 16.9 Zimbabwe 2010-2011 3862 2270.6 14.2 1039.3 0.8 14.5 Total 59 932 2251.7 14.9 1076.9 1.0 15.9
LBW, low birth weight; DHS, Demography and Health Survey.
1All data were derived from the standard DHS.
2DHS sampling weight was adjusted.
3LBW was deined as a birth weight between 1500 g and 2500 g.
4Extreme LBW was deined as a birth weight <1500 g.
p<0.01). Female babies were more prone to have a LBW than male babies in Armenia (OR, 1.4; 95% CI, 1.1 to 1.8; p<0.01), Cambodia (OR, 1.4; 95% CI, 1.1 to 1.6; p<0.01), Colombia (OR, 1.3; 95% CI, 1.1 to 1.5; p<0.001), Indonesia (OR, 1.2; 95% CI, 1.1
to 1.3; p<0.001), Jordan (OR, 1.6; 95% CI, 1.3 to 1.8; p<0.001), and Tanzania (OR, 1.4; 95% CI, 1.1 to 1.9; p<0.001), as well as in all countries overall (OR, 1.4; 95% CI, 1.3 to 1.6; p<0.001).
Moreover, delayed conception (over 48 months) had
signii-Figure 2. Prevalence of low birth weight (LBW) in developing countries.
Countries and survey years
L BW Armenia (2010) 9.0 14.2 11.8 12.9 22.0 29.7 35.1 13.9 16.9 14.5 Cambodia (2010) Colombia (2010) Indonesia (2012) Jordan (2012) Nepal (2011) Pakistan (2012-2013) Tanzania (2010) Uganda (2011) Zimbabwe (2010-2011) n=1447 n=5929 n=12 029 n=15 135 n=9734 n=1955 n=1458 n=4325 n=4078 n=3862
Figure 1. Distribution of birth weight (BW) for selected 10 developing countries (A) Armenia, (B) Cambodia, (C) Colombia, (D) Indo- nesia, (E) Jordan, (F) Nepal, (G) Pakistan, (H) Tanzania, (I) Uganda, and (J) Zimbabwe.
2.0 1.5 1.0 0.5 0 BW (kg) 1 2 3 4 5 1.0 0.8 0.6 0.4 0.2 0 2 4 6 8 BW (kg) 1.0 0.8 0.6 0.4 0.2 0 1.0 0.8 0.6 0.4 0.2 0 2 4 6 2 4 6 BW (kg) BW (kg) 1.0 0.8 0.6 0.4 0.2 0 2 4 6 8 10 2 4 6 BW (kg) BW (kg) 1.0 0.8 0.6 0.4 0.2 0 A B C I D J 1.5 1.0 0.5 0 BW (kg) 2 4 6 8 1.5 1.0 0.5 0 2 4 6 8 BW (kg) 1.0 0.8 0.6 0.4 0.2 0 2 4 6 8 10 BW (kg) 1.5 1.0 0.5 0 1 2 3 4 5 BW (kg) G H E F
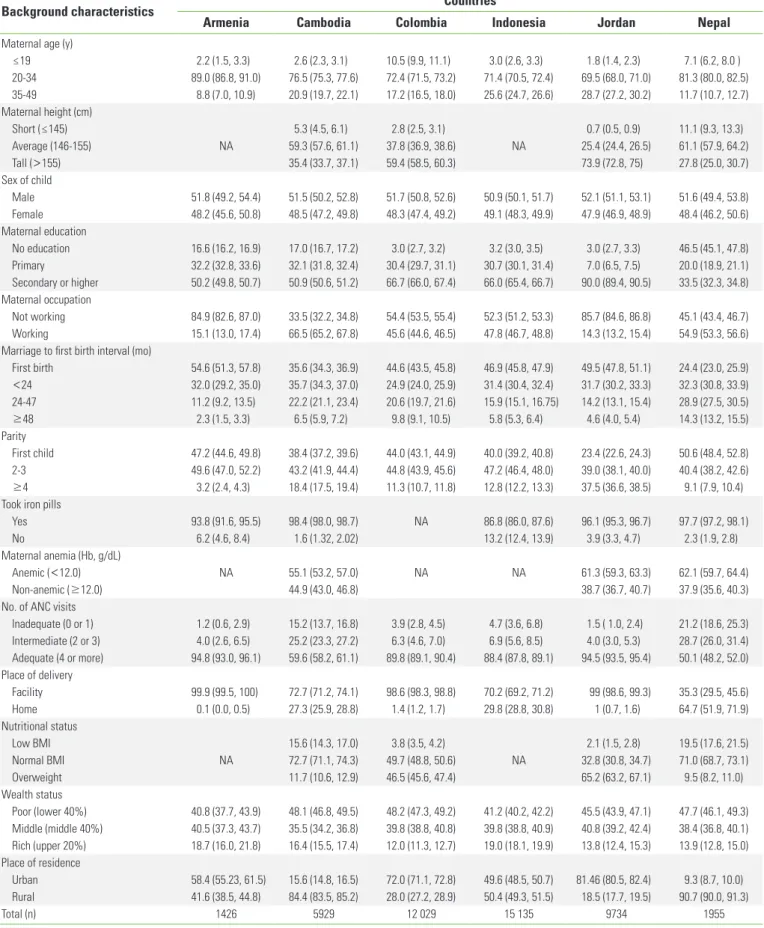
Table 2. Distribution of background characteristics in the study population from 10 selected developing countries1
Background characteristics Countries
Armenia Cambodia Colombia Indonesia Jordan Nepal
Maternal age (y)
≤ 19 2.2 (1.5, 3.3) 2.6 (2.3, 3.1) 10.5 (9.9, 11.1) 3.0 (2.6, 3.3) 1.8 (1.4, 2.3) 7.1 (6.2, 8.0 ) 20-34 89.0 (86.8, 91.0) 76.5 (75.3, 77.6) 72.4 (71.5, 73.2) 71.4 (70.5, 72.4) 69.5 (68.0, 71.0) 81.3 (80.0, 82.5) 35-49 8.8 (7.0, 10.9) 20.9 (19.7, 22.1) 17.2 (16.5, 18.0) 25.6 (24.7, 26.6) 28.7 (27.2, 30.2) 11.7 (10.7, 12.7) Maternal height (cm) Short ( ≤ 145) 5.3 (4.5, 6.1) 2.8 (2.5, 3.1) 0.7 (0.5, 0.9) 11.1 (9.3, 13.3) Average (146-155) NA 59.3 (57.6, 61.1) 37.8 (36.9, 38.6) NA 25.4 (24.4, 26.5) 61.1 (57.9, 64.2) Tall (>155) 35.4 (33.7, 37.1) 59.4 (58.5, 60.3) 73.9 (72.8, 75) 27.8 (25.0, 30.7) Sex of child Male 51.8 (49.2, 54.4) 51.5 (50.2, 52.8) 51.7 (50.8, 52.6) 50.9 (50.1, 51.7) 52.1 (51.1, 53.1) 51.6 (49.4, 53.8) Female 48.2 (45.6, 50.8) 48.5 (47.2, 49.8) 48.3 (47.4, 49.2) 49.1 (48.3, 49.9) 47.9 (46.9, 48.9) 48.4 (46.2, 50.6) Maternal education No education 16.6 (16.2, 16.9) 17.0 (16.7, 17.2) 3.0 (2.7, 3.2) 3.2 (3.0, 3.5) 3.0 (2.7, 3.3) 46.5 (45.1, 47.8) Primary 32.2 (32.8, 33.6) 32.1 (31.8, 32.4) 30.4 (29.7, 31.1) 30.7 (30.1, 31.4) 7.0 (6.5, 7.5) 20.0 (18.9, 21.1) Secondary or higher 50.2 (49.8, 50.7) 50.9 (50.6, 51.2) 66.7 (66.0, 67.4) 66.0 (65.4, 66.7) 90.0 (89.4, 90.5) 33.5 (32.3, 34.8) Maternal occupation Not working 84.9 (82.6, 87.0) 33.5 (32.2, 34.8) 54.4 (53.5, 55.4) 52.3 (51.2, 53.3) 85.7 (84.6, 86.8) 45.1 (43.4, 46.7) Working 15.1 (13.0, 17.4) 66.5 (65.2, 67.8) 45.6 (44.6, 46.5) 47.8 (46.7, 48.8) 14.3 (13.2, 15.4) 54.9 (53.3, 56.6) Marriage to irst birth interval (mo)
First birth 54.6 (51.3, 57.8) 35.6 (34.3, 36.9) 44.6 (43.5, 45.8) 46.9 (45.8, 47.9) 49.5 (47.8, 51.1) 24.4 (23.0, 25.9) <24 32.0 (29.2, 35.0) 35.7 (34.3, 37.0) 24.9 (24.0, 25.9) 31.4 (30.4, 32.4) 31.7 (30.2, 33.3) 32.3 (30.8, 33.9) 24-47 11.2 (9.2, 13.5) 22.2 (21.1, 23.4) 20.6 (19.7, 21.6) 15.9 (15.1, 16.75) 14.2 (13.1, 15.4) 28.9 (27.5, 30.5) 48 2.3 (1.5, 3.3) 6.5 (5.9, 7.2) 9.8 (9.1, 10.5) 5.8 (5.3, 6.4) 4.6 (4.0, 5.4) 14.3 (13.2, 15.5) Parity First child 47.2 (44.6, 49.8) 38.4 (37.2, 39.6) 44.0 (43.1, 44.9) 40.0 (39.2, 40.8) 23.4 (22.6, 24.3) 50.6 (48.4, 52.8) 2-3 49.6 (47.0, 52.2) 43.2 (41.9, 44.4) 44.8 (43.9, 45.6) 47.2 (46.4, 48.0) 39.0 (38.1, 40.0) 40.4 (38.2, 42.6) 4 3.2 (2.4, 4.3) 18.4 (17.5, 19.4) 11.3 (10.7, 11.8) 12.8 (12.2, 13.3) 37.5 (36.6, 38.5) 9.1 (7.9, 10.4) Took iron pills
Yes 93.8 (91.6, 95.5) 98.4 (98.0, 98.7) NA 86.8 (86.0, 87.6) 96.1 (95.3, 96.7) 97.7 (97.2, 98.1) No 6.2 (4.6, 8.4) 1.6 (1.32, 2.02) 13.2 (12.4, 13.9) 3.9 (3.3, 4.7) 2.3 (1.9, 2.8) Maternal anemia (Hb, g/dL)
Anemic (<12.0) NA 55.1 (53.2, 57.0) NA NA 61.3 (59.3, 63.3) 62.1 (59.7, 64.4)
Non-anemic ( 12.0) 44.9 (43.0, 46.8) 38.7 (36.7, 40.7) 37.9 (35.6, 40.3)
No. of ANC visits
Inadequate (0 or 1) 1.2 (0.6, 2.9) 15.2 (13.7, 16.8) 3.9 (2.8, 4.5) 4.7 (3.6, 6.8) 1.5 ( 1.0, 2.4) 21.2 (18.6, 25.3) Intermediate (2 or 3) 4.0 (2.6, 6.5) 25.2 (23.3, 27.2) 6.3 (4.6, 7.0) 6.9 (5.6, 8.5) 4.0 (3.0, 5.3) 28.7 (26.0, 31.4) Adequate (4 or more) 94.8 (93.0, 96.1) 59.6 (58.2, 61.1) 89.8 (89.1, 90.4) 88.4 (87.8, 89.1) 94.5 (93.5, 95.4) 50.1 (48.2, 52.0) Place of delivery Facility 99.9 (99.5, 100) 72.7 (71.2, 74.1) 98.6 (98.3, 98.8) 70.2 (69.2, 71.2) 99 (98.6, 99.3) 35.3 (29.5, 45.6) Home 0.1 (0.0, 0.5) 27.3 (25.9, 28.8) 1.4 (1.2, 1.7) 29.8 (28.8, 30.8) 1 (0.7, 1.6) 64.7 (51.9, 71.9) Nutritional status Low BMI 15.6 (14.3, 17.0) 3.8 (3.5, 4.2) 2.1 (1.5, 2.8) 19.5 (17.6, 21.5) Normal BMI NA 72.7 (71.1, 74.3) 49.7 (48.8, 50.6) NA 32.8 (30.8, 34.7) 71.0 (68.7, 73.1) Overweight 11.7 (10.6, 12.9) 46.5 (45.6, 47.4) 65.2 (63.2, 67.1) 9.5 (8.2, 11.0) Wealth status Poor (lower 40%) 40.8 (37.7, 43.9) 48.1 (46.8, 49.5) 48.2 (47.3, 49.2) 41.2 (40.2, 42.2) 45.5 (43.9, 47.1) 47.7 (46.1, 49.3) Middle (middle 40%) 40.5 (37.3, 43.7) 35.5 (34.2, 36.8) 39.8 (38.8, 40.8) 39.8 (38.8, 40.9) 40.8 (39.2, 42.4) 38.4 (36.8, 40.1) Rich (upper 20%) 18.7 (16.0, 21.8) 16.4 (15.5, 17.4) 12.0 (11.3, 12.7) 19.0 (18.1, 19.9) 13.8 (12.4, 15.3) 13.9 (12.8, 15.0) Place of residence Urban 58.4 (55.23, 61.5) 15.6 (14.8, 16.5) 72.0 (71.1, 72.8) 49.6 (48.5, 50.7) 81.46 (80.5, 82.4) 9.3 (8.7, 10.0) Rural 41.6 (38.5, 44.8) 84.4 (83.5, 85.2) 28.0 (27.2, 28.9) 50.4 (49.3, 51.5) 18.5 (17.7, 19.5) 90.7 (90.0, 91.3) Total (n) 1426 5929 12 029 15 135 9734 1955
Table 2. Continued from the previous page1
Background characteristics Countries
Pakistan Tanzania Uganda Zimbabwe All countries
Maternal age (y)
≤ 19 2.2 (1.9, 2.6) 5.3 (4.7, 5.9) 5.8 (5.2, 6.4) 7.2 (6.4, 8.0) 5.1 (5.0, 5.2) 20-34 78.0 (77.0, 79.0) 70.2 (69.0, 71.4) 72.4 (71.2, 73.5) 76.9 (75.6, 78.1) 73.5 (73.2, 73.7) 35-49 19.8 (18.8, 20.7) 24.6 (23.5, 25.7) 21.8 (20.8, 22.9) 16.0 (14.9, 17.1) 21.4 (21.2, 21.7) Maternal height (cm) Short ( ≤ 145) 2.0 (1.1, 3.6) 2.9 (2.5, 3.5) 1.1 (0.7, 1.9) 0.6 (0.4, 0.9) 0.6 (0.4, 0.9) Average (146-155) 40.7 (36.7, 44.8) 40.1 (38.7, 41.6) 23.6 (21.4, 26) 19.3 (18.0, 20.5) 19.3 (18.0, 20.5) Tall (>155) 57.3 (53.2, 61.3) 57.0 (55.5, 58.4) 75.3 (72.8, 77.5) 80.1 (78.9, 81.4) 80.1 (78.9, 81.4) Sex of child Male 52.5 (49.9, 55.1) 50.7 (49.2, 52.2) 49.8 (48.3, 51.4) 49.8 (48.3, 51.4) 50.8 (49.2, 52.4) Female 47.5 (44.9, 50.1) 49.3 (47.8, 50.8) 50.2 (48.6, 51.7) 50.2 (48.6, 51.7) 49.2 (47.6, 50.8) Maternal education No education 57.2 (56.3, 58.1) 25.4 (24.4, 26.3) 18.1 (17.3, 19.00 1.8 (1.4, 2.1) 50.9 (50.6, 51.2) Primary 14.4 (13.7, 15.0) 63.1 (62.1, 64.2) 59.4 (58.3, 60.5) 32.8 (31.6, 37.1) 17.0 (16.7, 17.2) Secondary or higher 28.5 (27.7, 29.3) 11.5 (10.8, 12.2) 22.4 (21.5, 23.4) 65.4 (64.1, 66.7) 32.1 (31.8, 32.4) Maternal occupation Not working 74.2 (73.1, 75.4) 13.2 (12.3, 14.1) 25.0 (23.9, 26.1) 65.2 (63.8, 66.6) 52.9 (52.6, 53.2) Working 25.8 (24.6, 7.0) 86.8 (85.9, 87.7) 75.0 (73.9, 76.1) 34.8 (33.5, 36.2) 47.1 (46.8, 47.4)
Marriage to irst birth interval (mo)
First birth 32.6 (31.4, 33.8) 43.5 (42.1, 45.0) 48.6 (47.1, 50.0) 58.3 (56.7, 59.9) 43.2 (42.9, 43.5) <24 28.7 (27.6, 9.9) 36.2 (34.8, 37.7) 29.6 (28.3, 30.9) 26.7 (25.3, 28.1) 31.0 (30.7, 31.3) 24-47 25.3 (24.2, 6.4) 16.2 (15.1, 17.3) 16.2 (15.1, 17.3) 11.0 (10.0, 12.0) 18.4 (18.1, 18.6) 48 13.4 (12.6, 14.3) 4.0 (3.5, 4.6) 5.7 (5.1, 6.4) 4.1 (3.5, 4.7) 7.4 (7.2, 7.6) Parity First child 33.9 (31.5, 36.4) 26.0 (24.7, 27.3) 26.0 (24.7, 27.3) 22.5 (21.2, 23.8) 35.5 (34.1, 37.1) 2-3 42.7 (40.2, 45.3) 37.1 (35.7, 38.6) 37.1 (35.7, 38.6) 34.2 (32.8, 35.7) 45.7 (44.1, 47.2) 4 23.4 (21.3, 25.6) 36.9 (35.5, 38.3) 36.9 (35.5, 38.3) 43.3 (41.8, 44.8) 18.8 (17.6, 20.0)
Took iron pills
Yes 92.9 (92.2, 93.5) 98.7 (98.3, 99.0) 93.2 (92.5, 93.8) NA 93.8 (93.6, 94.8)
No 7.2 (6.5, 7.8) 1.3 (1.0, 1.7) 6.8 (6.2, 7.5) 6.2 (6.0, 6.4)
Maternal anemia (Hb, g/dL)
Anemic (<12.0) NA 59.4 (58.1, 60.7) 74.9 (72.8, 76.8) 72.3 (70.9, 73.6) 63.1 (62.3, 63.8)
Non-anemic ( 12.0) 40.6 (39.3, 42.0) 25.1 (23.2, 27.2) 27.7 (26.4, 29.1) 36.9 (36.2, 37.7)
Number of ANC visits
Inadequate (0 or 1) 37.8 (33.2, 40.8) 5.5 (3.7, 6.8) 8.3 (6.8, 9.5) 12.7 (10.2, 15.8) 11.4 (9.8, 14.3) Intermediate (2 or 3) 25.6 (23.6, 27.8) 51.5 (48.9, 54.3) 43.2 (40.6, 45.9) 21.6 (19.7, 23.6) 18.8 (16.2, 20.7) Adequate (4 or more) 36.6 (35.1, 38.1) 43.0 (41.4, 44.7) 48.5 (46.8, 50.1) 65.7 (64.1, 67.3) 69.8 (69.5, 70.1) Place of delivery Facility 48.2 (47.6, 52.9) 52.8 (45.6, 56.9) 57.6 (45.9, 61.2) 65.3 (59.2, 68.9) 86.8 (86.4, 87.1) Home 51.8 (48.2, 53.9) 47.2 (42.6, 55.2) 42.4 (39.5, 49.1) 34.7 (29.8, 38.9) 13.2 (12.9, 13.6) Nutritional status Low BMI 14.6 (13.1, 16.3) 9.0 (8.3, 9.8) 9.7 (8.5, 11.0) 4.9 (5.3, 6.6) 7.6 (7.4, 7.8) Normal BMI 54.2 (52.1, 56.3) 73.2 (72.0, 74.4) 73.9 (71.9, 75.8) 64.7 (63.3, 66.1) 57.2 (56.8, 57.6) Overweight 31.2 (29.3, 33.1) 17.8 (16.8, 18.9) 16.5 (14.9, 18.2) 29.4 (28.1, 30.8) 35.2 (34.8, 35.6) Wealth status Poor (lower 40%) 45.1 (43.8, 46.3) 44.7 (43.4, 46.1) 43.8 (42.5, 45.1) 43.9 (42.5, 45.3) 50.5 (50.1, 50.8) Middle (middle 40%) 39.2 (38.0, 40.4) 41.1 (39.8, 42.4) 37.7 (36.4, 38.9) 40.4 (39.0, 1.9) 35.5 (35.2, 35.8) Rich (upper 20%) 15.7 (14.9, 16.6) 14.2 (13.2, 15.1) 18.5 (17.5, 19.6) 15.7 (14.7, 16.8) 14.1 (13.9, 14.3) Place of residence Urban 29.1 (28.1, 30.2) 20.3 (19.2, 21.5) 14.2 (13.4, 15.1) 29.8 (28.4, 31.2) 42.0 (41.6, 42.4) Rural 70.9 (69.8, 72.0) 79.7 (78.6, 80.8) 85.8 (84.9, 86.6) 70.2 (68.8, 71.6) 58.0 (57.6, 58.5) Total (n) 1458 4325 4078 3862 59 932
Values are presented as % (95% conidence interval).
DHS, Demography and Health Survey; NA, not available; BMI, body mass index; Hb, hemoglobin; ANC, antenatal care.
Factors Countries Armenia Cambodia Colombia Indonesia Jordan Nepal Pakistan Tanzania Uganda Zimbabwe All countries Constant 0.4 (0.1, 0.8)** 0.1 (0.0, 0.2)*** 0.1 (0.1, 0.4)*** 0.1 (0.0, 0.2)*** 0.2 (0.1, 0.4)*** 0.4 (0.01, 4.7) 0.02 (0.0, 1.9)* 0.02 (0.0, 2.2)* 0.0 (0.0, 0.3)* 0.1 (0.0, 0.4)*** 0.6 (0.1, 1.9)***
Maternal age (y)
19 1.0 1.0 1.0 1.0 1.0 1.0 1.0 1.0 1.0 1.0 1.0 20-34 0.3 (0.1, 1.1) 2.0 (0.5, 8.0) 0.8 (0.6, 1.1) 0.8 (0.5, 1.2) 0.5 (0.2, 0.9) 0.5 (0.2, 1.03) 9.7 (0.2, 483.4) 0.6 (0.3, 1.4) 2.2 (0.2, 19.5) 0.5 (0.3, 0.8) 0.7 (0.5, 1.0) 35-49 1.6 (1.1, 2.8)* 3.7 (1.9, 5.3)** 1.9 (1.6, 3.2)*** 0.9 (0.6, 1.3) 1.4 (1.1, 2.8)*** 1.6 (1.1, 2.5)** 7.7 (1.2, 14.1)** 1.4 (1.1, 3.0)** 1.4 (1.1, 3.9)** 1.6 (1.1, 2.2)** 1.7 (1.2, 3.1)** Maternal height (cm) Short ( ≤ 145) 1.0 1.0 1.0 1.0 1.0 1.0 1.0 1.0 1.0 1.0 1.0 A verage (146-155) NA 1.5 (0.9, 2.3)** 2.3 (1.6, 3.1)*** NA 1.3 (0.8, 2.2) 1.1 (0.7, 1.8) 1.1 (0.3, 3.1) 1.1 (0.5, 1.9) 1.2 (0.9, 2.1) 2.9 (1 , 8.2)* 1.2 (1.0, 1.6) Tall ( > 155) NA 0.8 (0.6, 0.9)*** 0.7 (0.6, 0.8)*** NA 0.6(0.6, 0.7)*** 0.8 (0.6, 1.2) 0.7 (0.5, 0.9)** 0.7 (0.5, 0.8)*** 0.5 (0.3, 0.7)*** 0.8 (0.6 , 0.9)* 0.7 (0.6, 0.8)*** Sex of child Male 1.0 1.0 1.0 1.0 1.0 1.0 1.0 1.0 1.0 1.0 1.0 Female 1.4 (1.1, 1.8)** 1.4 (1.1, 1.6)** 1.3 (1.1, 1.5)*** 1.2 (1.1, 1.3)*** 1.6 (1.3, 1.8)*** 1.1 (0.7, 1.6) 1.2 (0.7, 1.7) 1.4 (1.1, 1.9)*** 1.2 (0.7, 2.1) 1.2 (0.7, 2.0) 1.4 (1.3, 1.6)*** Maternal education No education 1.4 (1.1, 2.2)** 0.9 (0.5, 1.8) 1.3 (0.6, 2.9) 2.5 (1.5, 4.4)*** 1.6 (1.1, 2.7)** 1.3 (1.1, 1.5)*** 2.6 (1.1, 6.6)*** 0.6 (0.3, 1.5) 2.1 (1.1, 7.6)** 0.8 (0.1, 5.5) 1.5 (1.1, 2.7)*** Primary 1.6 (0.6, 4.6) 1.1 (0.7, 1.8) 0.9 (0.7, 1.2) 1.4 (1.2, 1.7)** 1.4 (1.1, 2.1)* 1.4 (0.6, 2.2) 2.8 (1.3, 6.1)*** 0.6 (0.3, 0.8)* 0.6 (0.2, 1.5) 1.1 (0.7, 1.6) 1.6 (1.2, 1.8)* Secondary or higher 1.0 1.0 1.0 1.0 1.0 1.0 1.0 1.0 1.0 1.0 1.0 Maternal occupation Not working 1.0 1.0 1.0 1.0 1.0 1.0 1.0 1.0 1.0 1.0 1.0 W orking 1.1 (0.5, 2.2) 1.2 (0.8, 1.7) 1.0 (0.9, 1.2) 1.0 (0.9, 1.2) 0.9 (0.7, 1.3) 1.5 (1.1, 2.8)** 1.4 (1.1, 2.7)*** 0.7 (0.5, 1.2) 0.9 (0.5, 2.1) 1.2 (0.8 , 1.6) 0.8 (0.6, 1.9)
Marriage to irst birth interval (mo)
First birth 1.0 1.0 1.0 1.0 1.0 1.0 1.0 1.0 1.0 1.0 1.0 < 24 0.5 (0.3, 0.9) 1.3 (0.9, 2.1) 1.1 (0.9, 1.4) 0.8 (0.7, 0.9)* 1.2 (0.9, 1.5) 0.9 (0.5, 1.7) 0.9 (0.4, 1.7) 0.9 (0.6, 1.6) 1.8 (0.8, 4.1) 1.3 (0.8, 1.8) 1.2 (0.9, 1.4) 24-47 1.4 (0.6, 2.9) 1.2 (0.7, 2.0) 1.3 (0.9, 1.4) 0.9 (0.8, 1.2) 1.1 (0.8, 1.5) 1.1 (0.5, 2.1) 1.5 (0.7, 3.1) 1.3 (0.8, 2.3) 2.9 (1.2, 7.1) 1.4 (0.8, 2.4) 1.2 (0.8, 1.5) ≥ 48 2.8 (1.6, 4.1)*** 1.9 (1.1, 3.7)** 1.4 (1.1, 1.9)** 0.9 (0.7, 1.4) 2.2 (1.4, 3.3)*** 0.8 (0.3, 2.3) 0.8 (0.3, 2.3) 2.4 (1.1, 5.4)** 2.2 (1.2, 3.5)** 1.5 (0.6, 3.3) 1.8 (1.4, 2.5)*** Parity First child 1.5 (1.1, 2.7)** 1.3 (0.9, 1.9)** 1.3 (1.1, 3.2)*** 1.7 (1.1, 2.9)*** 1.0 (0.8, 1.3) 1.4 (1.1, 2.1)** 1.4 (1.1, 3.1)*** 1.4 (1.1, 2.8)*** 1.4 (1.1, 2.9)** 1.3 (1.0, 1.8)* 1.5 (1.1, 2.9)*** 2-3 1.0 (0.6, 1.5) 0.8 (0.5, 1.2) 0.8 (0.7, 0.9) 0.6 (0.6, 0.7)* 1.1 (0.9, 1.4) 0.7 (0.4, 1.2) 0.7 (0.4, 1.2) 0.6 (0.4, 0.9) 0.6 (0.3, 1.3) 0.7 (0.5, 0.9) 1.6 (0.3, 2.9) ≥4 1.0 1.0 1.0 1.0 1.0 1.0 1.0 1.0 1.0 1.0 1.0
Took iron pills
No 1.7 (0.8, 4.3) 2.5 (1.1, 7.5)* NA 1.3 (1.1, 1.5)** 4.4 (3.2, 6.1)*** 0.2 (0.1, 13.5) 4.2 (1.8, 9.5)*** 0.5 (0.1, 3.9) 0.9 (0.3, 3.2) NA 3.0 (2.4, 4.1)*** Ye s 1.0 1.0 1.0 1.0 1.0 1.0 1.0 1.0 1.0 1.0 1.0 Maternal anemia (Hb, g/dL) Anemic ( < 12.0) 1.0 1.0 1.0 1.0 1.0 1.0 1.0 1.0 1.0 1.0 1.0 Non-anemic ( 12.0) NA 1.3 (0.9, 1.9) NA NA 0.9 (0.7, 1.1) 2.0 (1.2, 3.3)*** NA 1.2 (0.8, 1.8) 1.3 (0.5, 2.9) 0.8 (0.5, 1.1) 1.0 (0.9 , 1.2)
No. of ANC visits
Inadequate (0 or 1) 0.8 (0.2, 5.4) 1.3 (0.6, 2.7) 3.4 (2.2, 5.4)** 2.4 (1.3, 3.4)*** 3.6 (1.6, 8.1)*** 1.5 (1.1, 5.9)** 1.3 (1.1, 1.8)** 3.6 (1.5, 8.9)*** 3.2 (1.8, 7.1)*** 4.9 (2.9, 8.2)*** 1.7 (1.1, 2.8)** Intermediate (2 or 3) 3.6 (0.7, 18.4) 1.1 (0.4, 2.7) 2.7 (1.7, 4.6)*** 2.0 (1.2, 3.3)*** 1.7 (1.1, 4.3)** 1.7 (0.6, 4.8) 2.3 (0.6, 9.8) 2.1 (1.2, 3.1) 2.3 (0.3, 19.1) 3.2 (1.4, 7.2)*** 1.5 (1.1, 2.8)** Adequate (4 or more) 1.0 1.0 1.0 1.0 1.0 1.0 1.0 1.0 1.0 1.0 1.0 Place of delivery Facility 1.0 1.0 1.0 1.0 1.0 1.0 1.0 1.0 1.0 1.0 1.0 Home NA 1.2 (0.6, 2.4) NA 1.4 (1.1, 2.1)** NA 1.4 (1.2, 2.9)** 1.2 (0.9, 2.9) 1.5 (1.2, 3.2)* 1.3 (1.0, 2.9)** 2.5 (2.1, 3.5)* 1.6 (1.3, 2.1)** Nutritional status Low BMI NA 2.9 (1.4, 6.3)*** 1.5 (1.1, 2.0)** NA 2.2 (1.3, 3.9)*** 1.9 (1.1, 4.9)** 1.5 (1.1, 3.1)** 1.2 (0.9, 2.6)** 1.9 (1.2, 4.8)** 1.2 (0.9, 1.9)** 1.6 (1.2, 2.1)*** Normal BMI NA 1.6 (0.8, 3.1) 0.7 (0.6, 0.8) NA 1.3 (1.1, 1.6)** 1.4 (0.6, 2.9) 0.7 (0.4, 1.2) 1.0 (0.6, 1.7) 2.4 (0.8, 5.5) 0.9 (0.6, 1.4) 1.1 (0.9, 1.3) Overweight 1.0 1.0 1.0 1.0 1.0 1.0 1.0 1.0 1.0 1.0 1.0 W
ealth status Poor (lower 40%)
2.0 (1.1, 5.0)* 1.6 (1.2, 3.2)** 1.3 (1.1, 1.8)*** 1.3 (1.1, 1.7)** 1.7 (1.2, 2.9)** 1.5 (1.1, 2.3)** 3.4 (1.9, 7.5)** 1.4 (1.1, 2.8)* 0.7 (0.2, 2.6) 1.3 (1.1, 2.2)** 1.4 (1.1, 1.8)** Middle (middle 40%) 1.1 (0.5, 2.3) 1.2 (0.6, 2.4) 1.0 (0.8, 1.3) 1.2 (0.9, 1.5) 0.9 (0.6, 1.1) 0.8 (0.4, 1.5) 0.9 (0.4, 1.7) 0.8 (0.5, 1.5) 1.1 (0.3, 3.6) 1.2 (0.8, 1.8) 1.0 (0.8, 1.3) Rich (upper 20)% 1.0 1.0 1.0 1.0 1.0 1.0 1.0 1.0 1.0 1.0 1.0 Place of residence Urban 1.0 1.0 1.0 1.0 1.0 1.0 1.0 1.0 1.0 1.0 1.0 Rural 1.4 (1.1, 1.6)** 1.5 (1.1, 2.8)** 1.0 (0.8, 1.8) 1.3 (1.1, 1.5)** 1.5 (1.1, 1.9)** 1.3 (1.1, 2.2)** 0.9 (0.5, 1.9) 0.5 (0.3, 0.9)** 1.1 (0.9, 1.9)** 0.8 (0.6, 1.3) 1.5 (1.1, 1.9)** Total (n) 1426 5929 12 029 15 135 9734 1955 1458 4325 4078 3862 59 932
Likelihood ratio chi-square
31.7** 82.5*** 82.8*** 22.5*** 149.5*** 38.3*** 78.0*** 29.2*** 40.8*** 89.3*** 212.8*** Cox-Snell R 2 (%) 12.9 19.7 11.8 18.7 22.1 23.0 15.8 14.3 22.1 29.3 22.0 Hosmer -Lemeshow statistic 335.6*** 293.3** 792.3*** 385.7*** 286.7*** 163.9*** 744.3*** 280.3*** 254.8*** 836.4*** 427.3***
Mean VIF (Max)
3.2 (4.6) 2.9 (3.7) 2.6 (4.6) 3.2 (3.9) 3.6 (4.1) 3.4 (4.3) 3.1 (4.5) 3.9 (4.3) 3.9 (4.6) 3.9 (4.9) 2.2 (4.1)
Values are presented as odds ratio (95% conidence interval). Hb, hemoglobin; ANC, antenatal care; BMI, body mass index; NA, not available; VIF
, variance inlation factor; Max, maximum.
* p< 0.05, ** p< 0.01, *** p< 0.001. T able 3. F ac
tors inluencing det
er minan ts of lo w bir th w eigh t f or selec ted 10 dev eloping c oun tr ies
cant relationship with LBW in Armenia (OR, 2.8; 95% CI, 1.6 to 4.1; p<0.01), Cambodia (OR, 1.9; 95% CI, 1.1 to 3.7; p<0.01), Colombia (OR, 1.4; 95% CI, 1.1 to 1.9; p<0.01), Jordan (OR, 2.2; 95% CI, 1.4 to 3.3; p<0.001), Tanzania (OR, 2.4; 95% CI, 1.1 to 5.4; p<0.01), and Uganda (OR, 2.2; 95% CI, 1.2 to 3.5; p<0.001). In all countries, ANC visits were associated with signiicant re-ductions in LBW, while receiving inadequate ANC was associ-ated with an elevassoci-ated risk of LBW (OR, 1.7; 95% CI, 1.1 to 2.8;
p<0.01). In addition, in most of the countries, we observed a signiicantly increased risk of LBW in newborns born to moth-ers with certain specific characteristics, such as low BMI (OR, 1.6; 95% CI, 1.2 to 2.1; p<0.001) (with normal weight as the reference), primiparity (OR, 1.5; 95% CI, 1.1 to 2.9; p<0.001) (with parity of 4 or above as the reference), residing in rural communities (OR, 1.5; 95% CI, 1.1 to 1.9; p<0.001), as well as lower wealth status of households (OR, 1.4; 95% CI, 1.2 to 1.8;
p<0.001) in comparison with the rich group.
DISCUSSION
In this study, we identified potential determinants of the prevalence of LBW in developing countries. Our indings dem-onstrated that advanced maternal age (35 to 49 years), lack of ANC, primiparity, illiteracy, later conception, and being in the poorest socioeconomic stratum were significantly associated with LBW. Previous studies have likewise found that women with advanced maternal age are more likely to give birth to LBW babies [1,2,27-29]. Pregnant women aged 35 years are more likely to increase the probability of risk having pregnancy complications compared with younger women, like as, gesta-tional diabetes, placenta praevia, breech presentation, that might be cause of delivering babies with LBW. Women with poor educational status were generally at a higher risk of hav-ing an LBW baby than mothers with secondary or higher edu-cation. These indings are consistent with those of some previ-ous studies conducted in developing countries [1,30-32]. We found that later conception was associated with a signiicantly greater risk of LBW. This may be related to age, because in-creased age is related to common chronic diseases such as ar-thritis, hypertension, and diabetes prior to pregnancy [27]. However, these indings are in contrast with those of another study conducted in a developing country [31]. The present study also observed an increased risk of LBW among newborns born to mothers with a low BMI in comparison to normal-weight mothers. This inding parallels those of earlier studies
conducted in low-middle income countries showing that in-fants of low-BMI mothers had a signiicantly higher likelihood of LBW [31,33-36]. Additionally, low socioeconomic status was a risk factor of LBW, conirming the indings of previous studies that the poorest women in developing countries are at a sig-niicantly higher risk of delivering LBW infants [32,37].
The present study found that receiving insuicient ANC was a significant contributor to LBW. Specifically, in women who failed to receive any ANC or had inadequate ANC than recom-mended, the risk of LBW was higher than in women attending the standard number of ANC visits [38]. Similar results have also been reported in previous studies conducted in develop-ing countries, although the magnitude of risk appears to vary substantially in diferent settings depending on the ANC sys-tem and the degree of attendance [28,31,35,39]. Comparing our indings to those of prior studies, the evidence suggests that the degree of risk may be diluted in settings with a stan-dard frequency of ANC. Women living in rural communities had a greater risk of LBW than urban mothers. Similar results have been found in other studies [1,2,6,35]. Although this study has some strength, such as the large sample size and quality of data, it also has important limitations. The selected countries were found to have a large amount of missing birth weight data. They were also selected to ensure geographical coverage of less developed regions as well as based on the presence of available data related to the study variables. The reported number of home deliveries may have been influ-enced by social, cultural, and economic factors, and is likely to be country-specific and region-specific, as well as to change over time, and these possibilities were not captured in this analysis. Moreover, the selected DHSs were conducted in dif-ferent years, which may have resulted in inconsistencies. A high percentage of babies delivered at home had inadequate birth weight measurements, with a large proportion of miss-ing data. Consequently, many samples were excluded from the study. The aggregation of country data into regional sum-maries by wealth quintile may have caused errors through the combination of wealth quintiles from countries at differing wealth levels. Additional multilevel analysis of existing datas-ets could provide more detailed information for individual countries on adverse pregnancy outcomes as well as on health-seeking behavior related to maternal and child health.
In summary, this study identiied some signiicant risk fac-tors with independent efects on the prevalence of LBW in se-lected developing countries. Among these factors, inadequate
ANC, delayed conception, and maternal age had a greater po-tential efect on birth weight. Improvements in these speciic risk factors might have the positive efect in reducing the inci-dence of LBW. However, interventions to improve the educa-tional levels of women and female children are also important for reducing the prevalence of LBW. Diferent strategies should be implemented considering the settings of individual coun-tries, with appropriate community-based interventions focus-ing on these factors so that policy-makers can design efective plans for improving overall maternal and child health in se-lected developing countries.
ACKNOWLEDGEMENTS
The International Centre for Diarrhoeal Disease Research, Bangladesh (icddr,b) gratefully acknowledges the donors who provide unrestricted support: the Government of the People’s Republic of Bangladesh; Global Afairs Canada (GAC); Swedish International Development Cooperation Agency (Sida) and the Department for International Development (UK Aid). We gratefully acknowledge these donors for their support and commitment to icddr,b’s research efforts. The authors would also like to thank the Measure DHS program for providing ac-cess to the data used in the study.
CONFLICT OF INTEREST
The authors have no conlicts of interest associated with the material presented in this paper.
ORCID
Rashidul Alam Mahumud http://orcid.org/0000-0001-9788-1868
Marufa Sultana http://orcid.org/0000-0002-4481-0748
Abdur Razzaque Sarker http://orcid.org/0000-0002-2022-7590
REFERENCES
1. Rezende Chrisman J, Mattos IE, Koifman RJ, Koifman S, Moraes Mello Boccolini P, Meyer A. Prevalence of very low birthweight, malformation, and low Apgar score among new-borns in Brazil according to maternal urban or rural residence at birth. J Obstet Gynaecol Res 2016;42(5):496-504.
2. Assefa N, Berhane Y, Worku A. Wealth status, mid upper arm circumference (MUAC) and antenatal care (ANC) are determi-nants for low birth weight in Kersa, Ethiopia. PLoS One 2012;7 (6):e39957.
3. Brämer GR. International statistical classification of diseases and related health problems. Tenth revision. World Health Stat Q 1988;41(1):32-36.
4. Sachdev HP. Low birth weight in South Asia. Int J Diabetes Dev Ctries 2001;21(1):13-31.
5. Yadav DK, Chaudhary U, Shrestha N. Risk factors associated with low birth weight. J Nepal Health Res Counc 2011;9(19): 159-164.
6. Metgud CS, Naik VA, Mallapur MD. Factors affecting birth weight of a newborn--a community based study in rural Kar-nataka, India. PLoS One 2012;7(7):e40040.
7. Lau C, Ambalavanan N, Chakraborty H, Wingate MS, Carlo WA. Extremely low birth weight and infant mortality rates in the United States. Pediatrics 2013;131(5):855-860.
8. Nose S, Sasaki T, Saka R, Minagawa K, Okuyama H. A suture-less technique using cyanoacrylate adhesives when creating a stoma for extremely low birth weight infants. Springerplus 2016;5:189.
9. Canadian Institute for Health Information. Giving birth in Canada: the costs. Ottawa: Canadian Institute for Health Infor-mation; 2006, p. 1-62.
10. Hodek JM, von der Schulenburg JM, Mittendorf T. Measuring economic consequences of preterm birth: methodological recommendations for the evaluation of personal burden on children and their caregivers. Health Econ Rev 2011;1(1):6. 11. Barker DJ, Forsén T, Uutela A, Osmond C, Eriksson JG. Size at
birth and resilience to effects of poor living conditions in adult life: longitudinal study. BMJ 2001;323(7324):1273-1276. 12. Martinson ML, Reichman NE. Socioeconomic inequalities in
low birth weight in the United States, the United Kingdom, Canada, and Australia. Am J Public Health 2016;106(4):748-754.
13. Kalanda B, Verhoef F, le Cessie S, Brabin J. Low birth weight and fetal anaemia as risk factors for infant morbidity in rural Malawi. Malawi Med J 2009;21(2):69-74.
14. Dasgupta A, Basu R. Determinants of low birth weight in a Block of Hooghly, West Bengal: a multivariate analysis. Int J Biol Med Res 2011;2(4):838-842.
15. Deshpande JD, Phalke DB, Bangal VB, Peeyuusha D, Sushen B. Maternal risk factors for low birth weight neonates: a hospital based case control study in rural area of western maharashtra,
India. Natl J Community Med 2011;2(3):394-398.
16. Boerma JT, Weinstein KI, Rutstein SO, Sommerfelt AE. Data on birth weight in developing countries: can surveys help? Bull World Health Organ 1996;74(2):209-216.
17. ICF International. Survey organization manual for demo-graphic and health surveys; 2012 [cited 2016 Dec 30]. Avail-able from: http://dhsprogram.com/pubs/pdf/DHSM10/ DHS6_Survey_Org_Manual_7Dec2012_DHSM10.pdf. 18. Channon AA, Padmadas SS, McDonald JW. Measuring birth
weight in developing countries: does the method of report-ing in retrospective surveys matter? Matern Child Health J 2011;15(1):12-18.
19. Robles A, Goldman N. Can accurate data on birthweight be obtained from health interview surveys? Int J Epidemiol 1999; 28(5):925-931.
20. Blanc AK, Wardlaw T. Monitoring low birth weight: an evalua-tion of internaevalua-tional estimates and an updated estimaevalua-tion procedure. Bull World Health Organ 2005;83(3):178-185. 21. ORC Macro. DHS and World Bank use wealth index to measure
socioeconomic status. DHS Dimens 2002;4(2):1-2.
22. Hazarika I. Factors that determine the use of skilled care dur-ing delivery in India: implications for achievement of MDG-5 targets. Matern Child Health J 2011;15(8):1381-1388.
23. West BT. Statistical and methodological issues in the analysis of complex sample survey data: practical guidance for trauma researchers. J Trauma Stress 2008;21(5):440-447.
24. Titaley CR, Dibley MJ, Agho K, Roberts CL, Hall J. Determinants of neonatal mortality in Indonesia. BMC Public Health 2008; 8:232.
25. Hosmer DW, Lemeshow S. Applied logistic regression. 2nd ed. New York: Wiley; 2000, p. 1-383.
26. Rutstein SO, Rojas G. Guide to DHS statistics: demographic and health surveys methodology; 2006 [cited 2017 Jan 18]. Available from: http://www.dhsprogram.com/pubs/pdf/ DHSG1/Guide_to_DHS_Statistics_29Oct2012_DHSG1.pdf. 27. Dietl A, Cupisti S, Beckmann MW, Schwab M, Zollner U.
Preg-nancy and obstetrical outcomes in women over 40 years of age. Geburtshilfe Frauenheilkd 2015;75(8):827-832.
28. Isiugo-Abanihe UC, Oke OA. Maternal and environmental fac-tors influencing infant birth weight in Ibadan, Nigeria. Afr Popul Stud 2011;25(2):250-266.
29. Nobile CG, Rafaele G, Altomare C, Pavia M. Inluence of ma-ternal and social factors as predictors of low birth weight in Italy. BMC Public Health 2007;7:192.
30. Muthayya S. Maternal nutrition & low birth weight - what is really important? Indian J Med Res 2009;130(5):600-608. 31. Khatun S, Rahman M. Socio-economic determinants of low
birth weight in Bangladesh: a multivariate approach. Bangla-desh Med Res Counc Bull 2008;34(3):81-86.
32. Sebayang SK, Dibley MJ, Kelly PJ, Shankar AV, Shankar AH; SUMMIT Study Group. Determinants of low birthweight, small-for-gestational-age and preterm birth in Lombok, Indo-nesia: analyses of the birthweight cohort of the SUMMIT trial. Trop Med Int Health 2012;17(8):938-950.
33. Euser AM, Finken MJ, Keijzer-Veen MG, Hille ET, Wit JM, Dekker FW, et al. Associations between prenatal and infancy weight gain and BMI, fat mass, and fat distribution in young adult-hood: a prospective cohort study in males and females born very preterm. Am J Clin Nutr 2005;81(2):480-487.
34. Yazdanpanahi Z, Forouhari S, Parsanezhad ME. Prepregnancy body mass index and gestational weight gain and their asso-ciation with some pregnancy outcomes. Iran Red Crescent Med J 2008;10(4):326-331.
35. Kayode GA, Amoakoh-Coleman M, Agyepong IA, Ansah E, Grobbee DE, Klipstein-Grobusch K. Contextual risk factors for low birth weight: a multilevel analysis. PLoS One 2014;9(10): e109333.
36. Ronnenberg AG, Wang X, Xing H, Chen C, Chen D, Guang W, et al. Low preconception body mass index is associated with birth outcome in a prospective cohort of Chinese women. J Nutr 2003;133(11):3449-3455.
37. Olsén P, Vainionpää L, Pääkkö E, Korkman M, Pyhtinen J, Järv-elin MR. Psychological indings in preterm children related to neurologic status and magnetic resonance imaging. Pediat-rics 1998;102(2 Pt 1):329-336.
38. Tellapragada C, Eshwara VK, Bhat P, Acharya S, Kamath A, Bhat S, et al. Risk factors for preterm birth and low birth weight among pregnant Indian women: a hospital-based prospec-tive study. J Prev Med Public Health 2016;49(3):165-175. 39. Raatikainen K, Heiskanen N, Heinonen S. Under-attending
free antenatal care is associated with adverse pregnancy out-comes. BMC Public Health 2007;7:268.