Digestive Response to the First Meal in Hatchling
Burmese Pythons (Python molurus)
STEPHEN M. SECOR
Juvenile Burmese pythons (Python molurus) undergo dramatic increases in intestinal nutrient transport, hypertrophy of intestinal mucosa, and very large increases in metabolic rate in response to feeding. This study investigates wheth- er hatchling P. molurus, after their very first meal, experience magnitudes of digestive responses greater than or equal to those occurring for juveniles that have consumed many previous meals. After consuming their first meal, hatchling P. molurus increased oxygen consumption rates 12-fold, up-regulated intestinal nutrient transport three- to fourfold, and experienced a twofold increase in small intestinal wet mass. One day after feeding, their stomachs and livers significantly increased in mass, whereas the mass of their gallbladders significantly decreased. These postfeeding responses of hatchlings are similar in magnitude and mass- specific values to those of juvenile P. molurus. Thus, young P. molurus up-regulate intestinal nutrient transport and undergo intestinal hypertrophy to the same magnitudes after their first meal as they do following future meals. The signif- icance of this phenomenon is that, at the completion of digestion, the small intestine of juvenile pythons atrophies and down-regulates its functions to values comparable to those of the naive gut of hatchlings. This study demonstrates that, regardless of previous digestive history, the intestine of young P. molurus exhibits conserved magnitudes of postfeeding responses and that, during digestive qui- escence, the energetic cost of maintaining the intestine is minimized.
HYPOTHESIZED as adaptations to feeding on relatively large prey at long intervals, sit-and-wait foraging snakes possess an unprec- edented gastrointestinal response to the initia- tion and completion of digestion (Secor et al., 1994; Secor and Diamond, 1995). Following feeding, sit-and-wait foraging sidewinders (Cro- talus cerastes) and Burmese pythons (Python mol- urus) dramatically up-regulate intestinal nutri- ent transport by a factor of 5-26, more than double small intestinal mass, and experience as much as a 45-fold increase in metabolic rate (Secor et al., 1994; Secor and Diamond, 1995). With the completion of digestion, their intes- tine down-regulates nutrient transport and at- rophies, and their metabolic rates return to pre- feeding levels. The adaptive significance of down-regulating gut function and the associ- ated tissue atrophy after digestion is to reduce the energy allocated to the energetically expen- sive digestive system during the long intervals of digestive quiescence between feeding bouts (Secor et al., 1994). Thus, the postfeeding up- regulation of intestinal nutrient transport cou- pled with hypertrophy of the small intestine are necessary to effectively digest the potentially huge meal.
Sit-and-wait foraging pythonids and viperids are known to feed in the wild at 1-2 month intervals and fast for as long as one year (Slip
and Shine, 1988; Martin, 1992; Secor and Nagy, 1994). Additionally, they can consume relative- ly large prey equivalent to 50-160% of their body mass (Slip and Shine, 1988; Greene, 1992). For these snakes, the energetic cost of digesting these meals is relatively large (as much as 40% of the ingested metabolizable energy), due to the added costs of transporter and enzyme up- regulation and growth of the intestine and oth- er organs (Secor et al., 1994; Secor and Dia- mond, 1995). Because the elevated cost of di- gestion is offset by long periods of low postab- sorptive metabolism (reduced by minimizing the expenditure of the gastrointestinal tract), sit- and-wait foraging snakes theoretically expend less energy than if they continuously main- tained a fully functional gut between bouts of digestion, even when assuming that the relative cost of digestion would be less (no additional costs for up-regulation and tissue growth). In contrast, several species of widely foraging snakes do not regulate gut function or mor- phology with the initiation or completion of digestion (Secor and Diamond, 1994b). For these snakes, which feed more frequently in the wild, maintaining gut function between feeding bouts (resulting in higher standard metabolism) and thus experiencing relatively lower cost of di- gestion appears to be the more economical strategy energy-wise.
I previously documented the postfeeding re- sponses of P. molurus which were approximately one year old (Secor and Diamond, 1995). The snakes of that study had been maintained on biweekly meals of laboratory rodents that weighed 25% of the snakes' body mass. Follow- ing a 30-day fast, this size meal resulted in six- to 26-fold increases in intestinal nutrient trans- port rates, a doubling of small intestinal mass, and a 17-fold increase in oxygen consumption rates (Secor and Diamond, 1995). Upon ob- serving these dramatic responses to feeding in juvenile P. molurus, I asked whether the mag- nitudes of those responses were fixed or shifted with respect to age and/or previous feeding history. My separate finding that the cost of digestion (specific dynamic action) for P. molu- rus, normalized to body mass, does not vary with body size (S. M. Secor and J. M. Diamond, un- publ. data) suggests that the magnitudes of oth- er digestive responses are stable with respect to age. Alternatively, if the gut has had no prior digestive experience, as for hatchlings, it might have minimal functional capabilities. Thus, the first meal would produce a much greater di- gestive response than those occurring after sub- sequent meals.
In this study, I address these competing hy- potheses by measuring the following set of post- feeding responses in hatchling P. molurus after their first meal: (1) metabolic response, as the change in oxygen consumption during diges- tion; (2) functional response, as the regulation of nutrient transport across the intestinal brush- border membrane; and, (3) morphological re- sponse, as hypertrophy of gut tissues and other organs. My prime objective was to determine whether the magnitudes of these responses for hatchling P. molurus, after their first meal, were equivalent to or differed from those of older snakes with previous digestive experiences.
MATERIALS AND METHODS
Python molurus inhabits the Indo-China sub- region and are one of the largest species of snakes, reaching lengths of > 6 m and mass of > 100 kg (de Vosjoli, 1991). All 13 individuals of this study were siblings and had hatched 10 July 1993. They were maintained individually in plastic shoe boxes (30 x 16 x 8 cm) at 26- 29 C, with water available ad libitum. Methods for measuring the responses to digestion are detailed in Secor et al. (1994) and Secor and Diamond (1995).
I measured the metabolic response to diges- tion using closed-system respirometry as de- scribed by Vleck (1987). Seven, unfed, five-week-
old hatchlings (mean mass ? 1 SE = 113 ? 1 g) were placed in opaque respirometry cham- bers (1.5 or 3 liters) in a temperature-controlled environmental cabinet maintained at 30 C. For each measurement, I drew a 50-cc gas sample from each chamber, sealed the chambers, and 0.25-1 hr later took a second gas sample. Dur- ing the sampling intervals, chamber O2 never dropped below 18% (typically > 19.5%). Gas samples were scrubbed of water (Drierite) and CO2 (Ascarite) prior to being injected into an Applied Electrochemistry (model S-3A) oxygen analyzer. I measured oxygen consumption rates (VO2, corrected for standard temperature and pressure) daily for three days prior to and 10 days after each snake had consumed its first meal of two small laboratory mice whose com- bined mass equaled 25.2 ? 0.1 % of each snake's body mass.
I used an additional six six-week-old hatch- lings (101 ? 6 g) to document the magnitude of the functional and morphological responses to the first meal. I divided these six snakes into two groups; three snakes were sacrificed (by sev- ering their spinal cord just posterior to the head) before they ever had a meal and three sacrificed 24 hr after consuming their first meal of two small mice whose combined weight averaged 25.2 + 0.2% of each snake's body mass. I sac- rificed snakes 24 hr after their first meal be- cause it coincided with the peak in postfeeding VO2. My previous studies found that indices of intestinal function and morphology peaked concurrently with maximum post-feeding VO2 (Secor et al., 1994; Secor and Diamond, 1995).
I measured nutrient uptake by the brush-bor- der membrane of intestinal epithelial cells as described by Karasov and Diamond (1983) and Secor and Diamond (1995). Briefly, the intes- tine was quickly removed after the snake was sacrificed, washed with ice-cold Ringer solution, everted, and cut into 1-cm sleeves. Intestinal sleeves, mounted on glass rods, were first prein- cubated for 5 min in Ringer solution at 30 C and then incubated for 2 min at 30 C in a Ringer solution containing a radiolabeled nutrient that was transported across the brush-border mem- brane and a radiolabeled adherent fluid maker. I measured uptake rates of the amino acids L-leucine and L-proline (both labeled with 3H) and the sugar D-glucose (labeled with '4C). I selected these three solutes because they were similarly measured in juvenile P. molurus (Secor and Diamond, 1995), thus allowing a direct on- togenetic comparison, and because L-leucine and L-proline are transported predominantly by a different amino acid carrier-the neutral and imino acid transporters, respectively (Ste-
vens et al., 1982). To correct for the amount of these nutrients in the adherent fluid, I used '4C-polyethylene glycol for the amino acids and 3H-L-glucose for D-glucose. Additionally, L-glucose which is not actively absorbed, cor- rects for passive D-glucose transport, thus pro- viding a measure of carrier-mediated uptake of D-glucose.
I measured uptake rates from equal length thirds (proximal, middle, and distal) of the small intestine and from the proximal half of the large intestine. I normalized uptake rates to tissue wet mass, expressed as nmoles-min-' mg-'. I cal- culated total uptake capacity (umoles/min) of the complete small intestine by summing each region's uptake capacities, calculated as the product of a region's uptake rate (J) times its wet mass (M) as described in the following equa- tion: total uptake capacity = Jproximal Mproximal +
Jmiddle Mmiddle + Jdistal Mdistal.
I quantified the morphological response of the small intestine to the first meal by measuring the wet mass of the total small intestine (emptied of its contents) and wet and dry (dried to con- stant mass at 60 C) masses of scrapable mucosa and residual serosa from 1-cm sleeves from each region of the small intestine (Diamond and Kar- asov, 1984). These measures were used to es- timate the dry mass of the total small intestine and the wet and dry masses of the anterior and distal mucosa and serosa. Since postfeeding changes in mass of other organs occur for ju- venile P. molurus (Secor and Diamond, 1995), I also measured, from hatchlings, the wet and dry masses of the heart, paired lungs, liver, empty stomach, full gallbladder, pancreas, spleen, empty large intestine, paired fat bodies, and paired kidneys.
I conducted all statistical analyses using the microcomputer version of Statistical Analysis Systems (PC-SAS; SAS Institute, Inc., 1988). I employed a repeated-measures ANOVA to test the effects of sampling day on VO2 and intes- tinal position on nutrient uptake rates (Zar, 1974). I used a one-way ANOVA to test the effects of digestive state on intestinal uptake rates, total uptake capacities, regional mucosa and serosa masses, and organ masses. An AN- COVA analysis detected no significant covaried effect of body mass for any variables. The ab- sence of a body mass covariate on several vari- ables (uptake capacities and organ masses) re- sults from the narrow range of body masses (83.9-117.5 g) among snakes. I used a pairwise planned comparison to determine whether VO2 differed significantly between sampling days and whether uptake rates differed significantly be- tween intestinal regions and between hatchling
0- c0 o N 0 .> 0.8- 0.6- 0.4- 0.2- 0. 0 5 10 Days Post-feeding
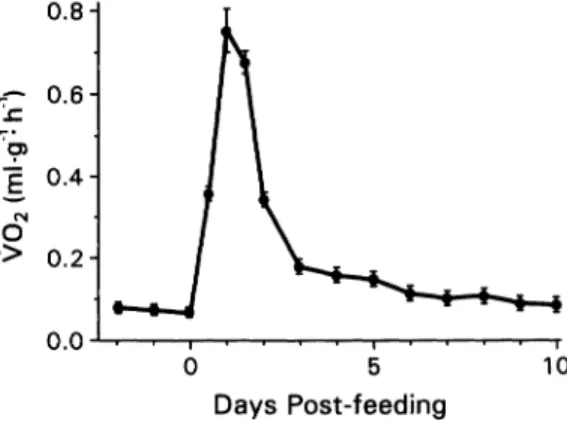
Fig. 1. Oxygen consumption rates (VO2 as ml g- 'h-') of five-week-old hatchling Python molurus (n = 7) for three days prior to and 10 days after con- suming their first meal (25% of snake's body mass). Values are presented as means (solid circle) ? 1 SE (bars). Note that VO2 peaks at 24 hr after feeding, at a value 11.5-fold prefeeding rates.
andjuvenile pythons. I designated statistical sig- nificance at P < 0.05 and present results as mean ? 1 SE.
RESULTS
Metabolic response.-I found that oxygen con- sumption rates (V02) of hatchling P. molurus differ significantly (F,,,, = 51.8, P < 0.0001) among days prior to and after consuming their first meal (Fig. 1). Minimum V02, prior to the first meal, averaged 0.065 ? 0.002 ml O2.g-'. h-1. Within 12 hr after this meal, VO2 had in- creased significantly (P < 0.0001) to 0.36 + 0.01 ml O2.g- 'h-1; a 5.5-fold increase. By 24 hr, VO2 had again increased significantly (P < 0.0001) to peak at 0.75 ? 0.06 ml O2 g- 'h-'; 11.5 times minimum prefeeding V2O. V02 then declined significantly (Ps < 0.0001) by day 2 and again by day 3. By day 6 and thereafter, V02 of these young pythons declined to values not significantly (Ps > 0.095) greater than pre- feeding rates.
Functional response.-The three fed hatchlings, while maintained at 30 C, had within 24 hr reduced the mass of the ingested meal within the stomach to 40 ? 7% of the meal's original mass. By this time, the anterior two-thirds of the first mouse and the anterior third of the second mouse had been broken down within the stomachs and passed into the small intes- tines. The small intestinal contents averaged 2.2 ? 0.6% of the mass of the ingested meal. The large intestine contained some fecal matter from the meal and urate from metabolism.
I. ,\
5- A
L-Leucine
4.'A
3-1-
5-
L-Proline
3- 2-0.2-
D-Glucose
C
] Unfed hatchlings 0.1 - Fed hatchlingso.o
Anterior Distal Large
Small Intestine Intestine Fig. 2. Mean (bars = SE) uptake rates (nmoles- min-'-mg-') of L-leucine (A), L-proline (B), and D-glucose (C) by anterior and distal small intestine and anterior large intestine of unfed (n = 3) and fed (n = 3) six-week-old hatchling Python molurus. Mea- surements from fed snakes were made at one day postfeeding. Uptake rates were significantly up-reg- ulated one day after the first meal for all three nu- trients in the anterior small intestine and for L-leucine and L-proline in the distal small intestine. No mea- surable uptake of D-glucose by the large intestine was detected. Note that uptake rates for D-glucose are an order of magnitude less than uptake rates for the two amino acids.
At one day postfeeding, uptake rates of hatch- lings differed significantly (Ps < 0.003) among the four intestinal regions for each nutrient; uptake rates of L-leucine and L-proline by the proximal and middle regions were similar and significantly greater than those by the distal re- gion. For unfed snakes, only D-glucose uptake differed among intestinal positions. Therefore, I averaged uptake values for the proximal and middle regions and hereafter refer to this com- bined region of the small intestine as the an- terior region. Uptake rates by the large intes- tine for L-leucine and L-proline were less than uptake rates by each region of the small intes-
tine, averaging 51 ? 2% and 34 ? 2%, respec- tively, of uptake rates by the anterior small in- testine. I detected no measurable uptake of D-glucose by the large intestine of fed or unfed hatchling P. molurus.
Within 24 hr after ingesting their first meal, hatchlings' small intestinal uptake of L-leucine (F,4 = 18.9, P < 0.05), L-proline (F,4 = 85.0, P < 0.001), and D-glucose (F,, = 76.1, P < 0.001) had increased to values 4, 3.5, and 3.3 times, respectively, of those of unfed hatchlings (Fig. 2). At this time, the uptake of L-leucine (F1,4 = 27.3, P < 0.01) and L-proline (F,4 = 129, P < 0.001), but not D-glucose (F,4 = 0.0, P = 1.0), by the distal small intestine had also in- creased (Fig. 2). I observed no significant change within 24 hr after the first meal in the uptake of L-leucine (Fi,4 = 3.88, P = 0.120) and L-pro- line (F, 4 = 0.55, P = 0.501) by the large intestine (Fig. 2).
Total uptake capacities of hatchlings' small intestine, a product of uptake rate times intes- tinal mass (described in Materials and Methods), increased significantly one day after feeding for L-leucine (F, 4 = 107, P < 0.001), L-proline (F1,4 = 6102, P < 0.0001), and D-glucose (F,4 = 1521, P < 0.0001). Compared to unfed hatchlings, uptake capacities of fed hatchlings were 6.8, 6.9, and 7.8 times greater for L-leucine, L-pro- line, and D-glucose, respectively.
Morphological response.-Wet mass of the small intestine of fed hatchlings averaged 4.9 ? 0.4 g, nearly twice that from unfed individuals (Ta- ble 1). Much of this difference can be attributed to the 2.3-fold greater wet mass of the anterior mucosa (F1,4 = 56.1, P = 0.002) of fed compared to unfed hatchlings. Dry masses of the total small intestine (calculated as sum of dry mass of mu- cosa and serosa) and anterior mucosa were also significantly (Ps < 0.009) greater for fed com- pared to the unfed hatchlings (Table 1). The wet and dry masses of the anterior serosa layer did not differ (Ps > 0.056) between fed and unfed hatchlings and neither did (Ps > 0.11) the wet and dry masses of the distal mucosa and serosa.
In digesting hatchlings, the wet mass of the liver (F,i4 = 23.3, P = 0.009) and stomach (F1,4 = 7.4, P = 0.049) were 55% and 67% greater, respectively, whereas wet mass of the full gall- bladder was 46% less (F,4 = 18.4, P = 0.023) than in unfed hatchlings (Table 1). Dry mass of the liver (Fi4 = 16.0, P = 0.016) and stomach (F,,4 = 7.83, P = 0.049) were also greater (52% and 75%, respectively) in fed hatchlings com- pared to unfed hatchlings. I detected no sig-
_, c'
E
E
0E
c Q0 0. a(Q
TABLE 1. MEAN ? 1 SE AND STATISTICAL COMPARISON (ONE-WAY ANOVA) OF BODY MASS AND WET AND DRY MASSES (G) OF THE SMALL INTESTINE (TOTAL AND REGIONAL MUCOSA AND SEROSA) AND OTHER ORGANS BETWEEN UNFED AND FED SIX-WEEK-OLD Python molurus. For fed snakes, body mass (minus gut contents) and
tissue and organ masses were measured one day after snakes consumed their first meal (25% of their body mass). Note the significantly greater wet and dry masses of the small intestine, mucosa of the anterior intestine, stomach, and liver, and significantly smaller wet mass of the full gallbladder of postfed hatchlings compared
to unfed hatchlings.
Wet mass Dry mass
Unfed Fed ANOVA Unfed Fed ANOVA
(n = 3) (n = 3) P values (n = 3) (n = 3) P values Body mass 94.1 + 6.9 115.7 ? 9.4 0.139 Small intestine Total 2.52 + 0.11 4.90 ? 0.41 0.006 0.44 ? 0.04 0.84 ? 0.08 0.008 Anterior mucosa 1.25 ? 0.14 3.07 ? 0.19 0.002 0.24 ? 0.02 0.58 ? 0.05 0.003 Anterior serosa 0.68 ? 0.07 0.88 ? 0.03 0.056 0.11 ? 0.01 0.13 ? 0.01 0.330 Distal mucosa 0.34
+
0.02 0.61 ? 0.13 0.112 0.05 ? 0.01 0.08 _ 0.02 0.123 Distal serosa 0.25+
0.02 0.34 ? 0.09 0.398 0.04 ? 0.01 0.05 ? 0.01 0.369 Other organs Heart 0.62 ? 0.01 0.89 ? 0.16 0.182 0.11 ? 0.01 0.14 ? 0.03 0.253 Lungs 0.87 + 0.05 1.08 ? 0.11 0.147 0.17 ? 0.01 0.21 ? 0.02 0.157 Liver 2.76 + 0.29 4.28 ? 0.13 0.009 0.83 ? 0.08 1.26 ? 0.07 0.016 Stomach 2.05 ? 0.30 3.43 ? 0.41 0.049 0.40 ? 0.05 0.70 + 0.09 0.049 Gall bladder 0.19 t 0.01 0.10 ? 0.01 0.023 0.03 ? 0.01 0.02 ? 0.01 0.196 Spleen 0.03 + 0.01 0.04 ? 0.01 0.153 0.005 + 0.001 0.01 + 0.00 0.696 Pancreas 0.12 + 0.01 0.19 ? 0.03 0.090 0.03 _ 0.01 0.05 ? 0.01 0.058 Large intestine 1.31+
0.14 3.85 ? 1.33 0.131 0.22 ? 0.02 0.59 + 0.28 0.252 Kidneys 0.97 + 0.06 1.32 + 0.24 0.234 0.20 + 0.01 0.24 + 0.03 0.247 Fat 4.50 ? 0.69 3.82 ? 0.09 0.379 2.62 + 0.46 2.31 _ 0.13 0.544nificant (Ps > 0.058) differences between unfed and fed hatchlings in wet and dry masses of the heart, lungs, pancreas, spleen, large intestine, fat bodies, and kidneys, together with dry mass of the gallbladder.
DISCUSSION
Metabolic response.-The metabolic response of hatchling P. molurus to their first meal resem- bles that of older snakes that have previously consumed numerous meals. I found that hatch- lings attained a higher postfeeding peak of VO2 (0.75 ? 0.06 ml O2.g- 'h-1) compared to year- old snakes (0.58 ? 0.06 ml O2.g-'-h-'; Secor and Diamond, 1995) that had also consumed meals equaling 25% of their body mass. Mini- mum prefeeding VO2 by hatchlings (0.065 ? 0.002 ml O2-g-'-h-') was nearly twice that of older pythons (0.034 ? 0.003 ml O2-g-' h-1), hence their scope of maximum metabolic rate (VO2max/VO2min) was significantly (F 1,1 =
12.7, P = 0.003) less (11.5 for hatchlings vs 17.1 for juveniles).
The elevation of metabolism attributed to di- gestion is commonly referred to as specific dy-
namic action (SDA; Brody, 1945; Blaxter, 1989). For cows, horses, pigs, and sheep, SDA involves a 25-50% increase in metabolic rate (Brody, 1945). I have demonstrated that species of sit- and-wait foraging snakes undergo a seven- to 17-fold increase in metabolic rate following the ingestion of meals equaling 25% of their body mass (Secor et al., 1994; Secor and Diamond, 1995; this study). For P. molurus, larger meals will trigger even a greater metabolic response. For example, after ingesting a meal almost equal to their own body mass, P. molurus will expe- rience a 45-fold increase in VO2 (Secor and Di- amond, 1995). For these pythons, elevated rates of oxygen consumption are necessary for fuel- ing the production and secretion of gastric acid and hydrolases, up-regulation of nutrient trans- port, and hypertrophy of the intestinal tract.
For adult Crotalus cerastes (Secor et al., 1994), juvenile P. molurus (Secor and Diamond, 1995), and hatchling P. molurus (this study), the energy equivalent of SDA [extra oxygen consumed during digestion times 18.3 J/ml 02 Nagy,
1983)] after a snake digests a meal equaling one- quarter of its body mass is equivalent to 26 + 1%, 32 ? 1%, and 37 + 2%, respectively, of
the metabolizable energy of the ingested meal (assuming 8 kJ/g wet mass of meal and 85% assimilation efficiency of snakes; S. M. Secor and J. M. Diamond, unpubl. data). For hatchling P. molurus, this relative cost of digestion is signif- icantly (Ps < 0.04) greater than that forjuvenile P. molurus and adult C. cerastes. For pythons, digesting the first meal results in a greater en- ergy cost, relative to the return, compared to later meals. The up-regulation of other diges- tive functions, not measured in this study, oc- curring after the first meal but not again after subsequent meals, could be responsible for the difference in cost.
Hatchling P. molurus expend a substantial amount of energy (15.9 ? 0.7 kJ), within the first 24 hr of digestion, before the meal has been transported across the gut wall. Because they have not eaten previously, they must rely upon natal energy stores to fuel at least the initial stages of digestion. I suggest that the start-up fuel for digestion originates in abdominal fat bodies, supported by an observed 60-fold in- crease in plasma triglycerides 24 hr after eating in juvenile P. molurus (Secor and Diamond, 1994a). For the three sacrificed unfed hatch- lings, dry mass of abdominal fat bodies averaged 2.6 ? 0.5 g, which has an energy equivalent of 103 kJ (assuming 39.3 kJ/g dry mass; Schmidt- Nielsen, 1979). Thus, it appears that the ab- dominal fat bodies alone could easily meet the energetic demands of the first day of digestion. It is remarkable that the fat dry mass of fed hatchlings averaged 0.31 g less than that of unfed individuals, a difference with an energy equiv- alent of 12.3 kJ, similar to the cost of the first day of digestion. If none of the ingested energy was subsequently used to fuel the completion of digestion (total cost = 71 ? 3 kJ), the abdominal fat bodies should be able to do so but at the cost of a substantial depletion of itself and other possible energy stores (ex., liver and muscle).
Theoretically, abdominal fat bodies could fuel resting metabolism of a noneating hatchling P. molurus for approximately 52 days. This is as- suming that daily maintenance expenditure of hatchlings is approximately 2 kJ/day (calculat- ed from VO2 of unfed hatchlings). Three sib- lings of the snakes used in this study could never be enticed to eat and, thus, eventually died of starvation. Death of these snakes occurred 153- 205 days (mean = 174 + 16 days) after hatch- ing, more than three times the duration pre- dicted from the energy available from the de- pletion of abdominal fat bodies. From hatching to death, these snakes had lost an average of 41.2 ? 2.5 g, certainly more than could be ac- counted for from the complete use of abdom- inal fat bodies. At the time of their death, these
snakes possessed no observable fat bodies, and the wet masses of their hearts, livers, small in- testines, large intestines, kidneys, skin, and mus- cles were significantly (Ps < 0.03) less than those of their sacrificed unfed siblings. Wet masses of their esophagus, lungs, stomachs, and pancreas were not significantly (Ps > 0.35) different from those from sacrificed unfed hatchlings. These observations demonstrate that these snakes can use other energy stores besides fat bodies to meet metabolic requirements. Concurrent with and/or following the depletion of lipid stores, they catabolize other organs for available lipids, glycogen, and protein to fuel metabolism. Death occurs when all mobilizable energy sources are used up or when sufficient depletion causes or- gan failure.
Functional response.-Hatchling P. molurus had digested most of their ingested meal within 24 hr after feeding. Stomachs of sacrificed hatch- lings contained 40% of meal mass, whereas stomachs of juvenile P. molurus at one-day post- feeding contained significantly (P = 0.0095) more (73%) of the ingested meal (Secor and Diamond, 1995). Higher standard metabolic rates and greater VO2 during digestion of hatchlings may be responsible for their faster rate of prey assimilation.
I found that regional uptake rates of L-leu- cine and L-proline were the same between unfed hatchling and 30-day fasted juvenile P. molurus, and between one-day postfeeding hatchlings and juveniles (Table 2). Uptake rates of D-glucose by the anterior small intestine were significantly (P = 0.016) greater forjuveniles than hatchlings one day after feeding. These data demonstrate that the small intestine of hatchlings up-regu- lates amino acid transport in response to the very first meal to the same levels experienced by the small intestine ofjuveniles following many meals. Additionally, after a 30-day fast, the small intestine of juvenile P. molurus has down-reg- ulated its nutrient uptake to levels experienced by the naive gut of unfed hatchlings.
To compare total uptake capacities among hatchling and juvenile P. molurus, I normalized values to body mass. Normalized total uptake capacities of L-leucine, L-proline, and D-glu- cose of one-day postfeeding hatchlings and ju- veniles were statistically indistinguishable from each other and significantly greater (Ps < 0.005) than normalized capacities of unfed hatchlings and fasted juveniles (Table 2).
Morphological response.-Changes in intestinal and organ masses, after the first meal for hatch- lings, are similar in scope to those experienced by older snakes after one of many previous meals
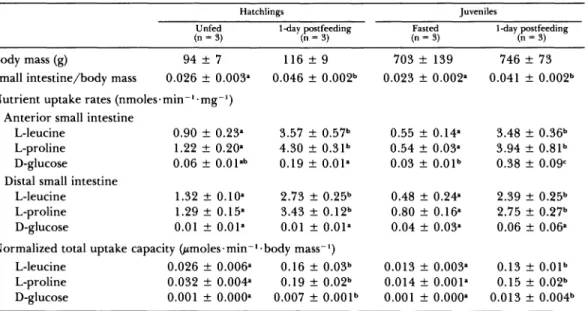
TABLE 2. COMPARISON OF RELATIVE SMALL INTESTINAL MASS, NUTRIENT UPTAKE RATES, AND NORMALIZED UPTAKE CAPACITIES AMONG UNFED HATCHLING, ONE-DAY POSTFEEDING (FIRST MEAL) HATCHLING, 30-DAY
FASTED JUVENILE, AND ONE-DAY POSTFEEDING JUVENILE Python molurus. Data for juvenile P. molurus are from
Secor and Diamond (1995). Values are presented as means ? 1 SE. For each row of values, common superscript letters denote those values that do not differ significantly (Ps > 0.05) from each other (planned pairwise comparison). Note that both hatchlings and juveniles, one day after feeding, experience similar degrees of
intestinal hypertrophy and up-regulation of nutrient uptake.
Hatchlings Juveniles
Unfed 1-day postfeeding Fasted 1-day postfeeding
(n =3) (n 3) (n 3) (n = 3)
Body mass (g) 94 + 7 116 ? 9 703 + 139 746
+
73Small intestine/body mass 0.026 + 0.003a 0.046 ? 0.002b 0.023 ? 0.002a 0.041 ? 0.002b Nutrient uptake rates (nmoles min- mg-1)
Anterior small intestine
L-leucine 0.90 ? 0.23a 3.57 _ 0.57b 0.55 ? 0.14a 3.48 ? 0.36b L-proline 1.22 ? 0.20a 4.30 + 0.31b 0.54 + 0.03a 3.94 ? 0.81b D-glucose 0.06 ? O.01ab 0.19 ? 0.Ol1 0.03 ? 0.01b 0.38 + 0.09c Distal small intestine
L-leucine 1.32 ? 0.1Oa 2.73 ? 0.25b 0.48 ? 0.24a 2.39 ? 0.25b L-proline 1.29 ? 0.15a 3.43 + 0.12b 0.80 + 0.16a 2.75 ? 0.27b D-glucose 0.01 ? 0.01a 0.01 ? 0.Ola 0.04 + 0.03a 0.06 + 0.06a Normalized total uptake capacity (,moles min- body mass-1)
L-leucine 0.026 ? 0.006a 0.16 ? 0.03b 0.013 ? 0.003a 0.13 ? 0.Olb L-proline 0.032 + 0.004a 0.19 ? 0.02b 0.014 ? 0.001a 0.15 + 0.02b D-glucose 0.001 ? 0.000a 0.007 + 0.001b 0.001 + 0.000a 0.013
+
0.004b(Secor and Diamond, 1995). The twofold in- crease in small intestinal wet mass exhibited by hatchlings and juveniles 24 hr after feeding is largely a result of a ; 2.4-fold increase in wet mass of the anterior mucosa (Table 1). Hyper- trophy of the intestinal mucosa, especially the epithelial layer which is responsible for the up- take of nutrients from the gut lumen, aids in increasing the intestine's total capacity to ab- sorb nutrients. I suspect that hypertrophy of the mucosa results from an increase in enter- ocyte size and lengthening of microvillus; sim- ilar to that observed for adult C. cerastes (Secor et al., 1994) and juvenile P. molurus (unpubl. obs.).
Both hatchling and juvenile P. molurus dem- onstrated significant increases in stomach (75% vs 28%) and liver (52% vs 36%) dry masses and a significant decrease in wet mass of the full gallbladder (47% vs 59%) within 24 hr after eating. The arrival of food into the stomach triggers the increased production of gastric acid which is possibly correlated with hypertrophy of gastric parietal cells. The liver undergoes hypertrophy as its function is up-regulated to process the nutrients transported across the in- testinal wall. The gallbladder responds to feed- ing by releasing its fluid contents (bile) into the proximal small intestine as digesta exits the
stomach; thus, this response is not detected by a change in dry mass.
Hatchling P. molurus possess the remarkable trait of intestinal growth and functional up-reg- ulation in response to their first meal. The sig- nificant findings of this study are as follows: first, the magnitude of postfeeding response is stable for at least the first year of life; and second, pythons continually respond to digestive qui- escence by "shutting down" their small intes- tine to a minimal level of existence. The former conclusion is supported by my unpublished ob- servations that for P. molurus there is no change in the mass-specific cost of digestion over a wide range of body sizes (100-10000 g). The latter phenomenon serves to minimize the energy ex- pended on the quiescent gut. It remains to be seen whether pythons undergo ontogenetic changes in the magnitude of the functional and metabolic responses to feeding later in life. Such a change may occur if adult pythons feed on larger meals at longer intervals than juveniles and consequently experience greater extremes of digestive regulation.
ACKNOWLEDGMENT
I wish to thankJ. Diamond and K. Hammond for their valuable comments on this manuscript.
M. Lam, R. Torres, and F. Wayland assisted in measurements of nutrient uptake rates and or- gan masses. This research was supported by NIH NRSA fellowship DK 08878 and by NIH grants GM 14772 and DK 42973 to the University of California Los Angeles Center for Ulcer Re- search and Education.
LITERATURE CITED
BLAXTER, K. 1989. Energy metabolism in animals
and man. Cambridge Univ. Press, Cambridge. BRODY, S. 1945. Bioenergetics and growth. Reinhold
Publishing Company, New York.
DE VOSJOLI, P. 1991. The general care and mainte-
nance of Burmese pythons. Advance Vivarium Sys- tems, Lakeside, CA.
DIAMOND, J. M., AND W. H. KARASOV. 1984. Effects of dietary carbohydrate on monosaccharide uptake by mouse small intestine in vitro.J. Physiol. London 349:419-440.
GREENE, H. W. 1992. The ecological and behavioral context for pitviper evolution, p. 107-117. In: Bi- ology of the pitvipers. J. A. Campbell and E. D. Brodie Jr. (eds.). Selva Press, Tyler, TX.
KARASOV, W. H., ANDJ. M. DIAMOND. 1983. A simple
method for measuring intestinal solute uptake in vitro. J. Comp. Physiol. 152:105-116.
MARTIN, W. H. 1992. Phenology of the timber rat-
tlesnake (Crotalus horridus) in an unglaciated section of the Appalachian Mountains, p. 259-278. In: Bi- ology of the pitviper. J. Campbell and E. D. Brodie Jr. (eds.). Selva Press, Tyler, TX.
NAGY, K. A. 1983. Ecological energetics, p. 24-54. In: Lizard ecology: studies of a model organism. R. B. Huey, E. R. Pianka, and T. W. Schoener (eds.). Harvard Univ. Press, Cambridge, MA.
SAS INSTITUTE, INC. 1988. SAS user's guide: statis-
tics. Statistical Analysis Systems Institute, Inc., Cary, NC.
SCHMIDT-NIELSEN, K. 1979. Animal physiology. Cambridge Univ. Press, Cambridge.
SECOR, S. M., ANDJ. M. DIAMOND. 1994a. Burmese pythons: a new model of gastrointestinal adapta- tion. FASEBJ. 8:A62.
, AND . 1994b. Evolution of the diges-
tive response in snakes. Am. Zool. 34:48A
, AND . 1995. Adaptive responses to
feeding in Burmese pythons: pay before pumping. J. Exp. Biol. 198:1313-1325.
,AND K. A. NAGY. 1994. Bioenergetic corre- lates of foraging mode for the snakes Crotalus ce- rastes and Masticophis flagellum. Ecology 75:1600-
1614.
,E. D. STEIN, ANDJ. M. DIAMOND. 1994. Rapid up-regulation of snake intestine in response to feed- ing: a new model of intestinal adaptation. Am. J. Physiol. 266:G695-G705.
SLIP, D. J., AND R. SHINE. 1988. Feeding habits of
the diamond python, Morelia s. spilota: ambush pre- dation by a boid snake. J. Herpetol. 22:323-330.
STEVENS, B. R.,J.J. Ross, AND E. M. WRIGHT. 1982. Multiple transport pathways for neutral amino ac- ids in rabbitjejunal brush border vesicles.J. Membr. Biol. 66:213-225.
VLECK, D. 1987. Measurement of 02 consumption, CO2 production, and water vapor production in a closed system. J. Appl. Physiol. 62:2103-2106. ZAR,J. H. 1974. Biostatistical analysis. Prentice-Hall,
Inc., Englewood Cliffs, NJ.
DEPARTMENT OF PHYSIOLOGY, UNIVERSITY OF
CALIFORNIA LOS ANGELES SCHOOL OF MEDI-
CINE, Los ANGELES, CALIFORNIA 90095. Sub-