Int. J. Electrochem. Sci., 12 (2017) 1193 – 1202, doi: 10.20964/2017.02.26
International Journal of
ELECTROCHEMICAL
SCIENCE
www.electrochemsci.orgCu–Mo Thin Film Electrodeposited at a Rate of Megahertz by a
Rectangular Pulse Current Technique
M. Saitou
University of the Ryukyus, Department of Mechanical Systems Engineering, 1 Senbaru Nishihara-cho Okinawa, 903-0213, Japan.
E-mail: [email protected]
Received: 17 November 2016 / Accepted: 9 December 2016 / Published: 30 December 2016
Cu-Mo thin films generated on ITO glasses by a rectangular pulse current technique having a frequency of megahertz were investigated using energy dispersive X-ray spectroscopy (EDX), X-ray diffraction (XRD), and scanning electron microscope (SEM). The concentration of Mo in the Cu-Mo thin film measured with EDX, which periodically changed with the frequency of the rectangular pulse current, had a maximum concentration of 9 wt%. XRD analysis revealed diffraction peaks of the Cu-Mo thin film consistent with those of the crystallographic planes such as (111), (200), (220), (311), and (222) planes of polycrystalline copper. SEM images of the Cu-Mo thin film showed an aggregation of an island of which the surface appeared like a cauliflower in nano scale size. These experimental results indicate that the Cu-Mo thin film generated in an aqueous solution that does not include the iron-group element is an alloy composed of Cu and Mo. The oscillatory behavior of the Mo concentration in the Cu-Mo thin film is explained by an energy level transition of electron that causes a resonant generation of Cu and Mo.
Keywords: Cu-Mo thin film; Aqueous solution; Energy level transition; Nano cauliflower; Resonant generation; Alloy
1. INTRODUCTION
addition, it is very difficult to explain why a bivalent molybdate oxyanion can approach not an anode electrode but a cathode electrode, and how it can receive six electrons to change a molybdenum atom.
Recently, in nickel electrodeposition, a resonant frequency at which the nickel deposit mass drastically increases, and a resonant frequency spacing of 0.2 MHz between the neighboring resonant frequencies have been reported [13]. The nickel electrodeposition was performed using a rectangular pulse current technique having a frequency of megahertz. Several resonant frequencies were found in a frequency range from 0.1 MHz to 2 MHz. This study suggests that if the energy to transit an electron in the electrode at the Fermi level to the energy level of a metal ion in the solution is given by the electric field of megahertz, the probability of the transition becomes high. Hence, Mo, W, P, and B in the aqueous solution that does not include the iron group element can be deposited even if the transit energy is provided to the electron at the cathode electrode. This is our motivation for the present study in which the rectangular pulse current having a frequency of megahertz was applied.
There have been several studies on a Ni-Cu-Mo thin film that is a promising material having a catalytic activity for hydrogen evolution [14-15]. In the formation of the Ni-Cu-Mo thin film, a nickel ion in an aqueous solution was co-deposited. On the other hand, a Cu-Mo composite has been reported [16-17] that the composite was obtained by electroplating in an aqueous solution. However, owing to Ni distributed in the Cu-Mo composite and the nickel electrode used as a cathode one, whether or not the generation of Mo was caused by the presence of Ni does not make clear.
In general, an ion that has a negative valence cannot approach the cathode surface when the electric filed is applied between the anode and cathode electrode. The electrostatic screening [18] by the copper ion around the bivalent molybdate oxyanion makes it possible for the bivalent molybdate oxyanion to approach the cathode electrode.
In the present study, we demonstrate that the Cu-Mo thin film generated in an aqueous solution that does not include the iron group element is an alloy comprising Cu and Mo.
2. EXPERIMENTAL SETUP
An ITO glass of 30 x10 mm2 and carbon plate of 50x40 mm2 were prepared for a cathode and anode electrode. The two electrodes cleaned by a wet process, were placed parallel to each other in an electrochemical cell filled with the aqueous solution including the following chemical compounds (mol L-1): CuSO4・5H2O, 0.945; KNaC4H4O6・4H2O, 0.65; and Na2MoO4・2H2O, 0.5, or 0.75. The solution was filtered using a membrane with a pore size of 0.1 m to remove copper hydroxide, and was kept at a temperature of 300 K in electrodeposition.
The Cu-Mo thin film was formed on the ITO glass (sheet resistance 7) immersed to 15 mm in depth in the solution. As the area of the carbon electrode was about 27 times as large as the deposited area of the ITO glass, the impedance in series of the carbon electrode in the solution can be ignored.
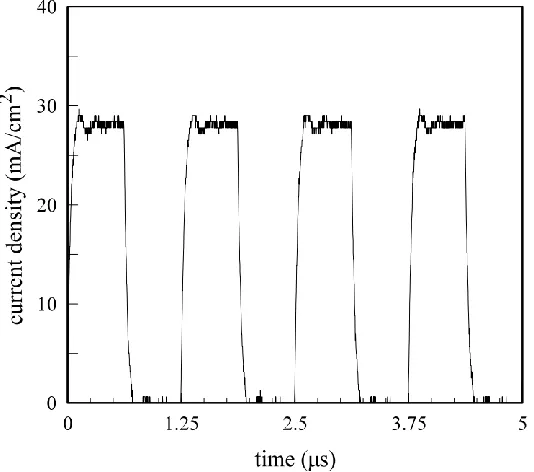
electrochemical cell was calculated from a voltage drop across the metal film resistor measured with a digital storage oscilloscope (Yokogawa DL1720). In Fig. 1, the typical rectangular pulse current having an amplitude of 28 mA/cm2 and a frequency of 0.8 MHz is shown, which was measured in electrodeposition using the solution including 0.75 mol/L sodium molybdate dehydrate. The on-time of the current was chosen to be equal to the off-time of the current.
Figure 1. Rectangular pulse current having an amplitude of 28 mA/cm2 and a frequency of 0.8 MHz.
After deposition, the Cu-Mo thin film electrodeposited on the ITO glass was rinsed with distilled water and dried in a vacuum chamber.
The Mo concentration in the Cu-Mo thin film on the ITO glass was investigated with EDX (Shimazu EDX-800). The crystallographic plane in the Cu-Mo thin film was determined with the conventional XRD (Rigaku Ultima) with CuK radiation using a standard -2 diffractometer with a monochromator of carbon. The surface morphology of the Cu-Mo thin film was observed with SEM (Hitach TM3030).
3. RESULTS AND DISCUSSION
3.1. Cu-Mo thin film electrodeposited in the solution including 0.5 mol/L sodium molybdate dehydrate
[image:3.596.168.435.180.416.2]
including a very high concentration of acetate above 10 mol/L and a DC technique having a high current density above 100 mA/cm2 was recently demonstrated [21-22]. The XPS data showed that the electrodeposit was composed of rich metal Mo and Mo oxides. These results suggest that it is difficult for an electron in the electrode at the Fermi level to transfer the energy level of a Mo ion in the solution. In our experiment, the solution including a copper ion was chosen because the copper ion helps the bivalent molybdate oxyanionact to approach the cathode electrode by the electrostatic screening, and has a possibility that the copper ion assists an electron to transfer to a Mo ion if the quantized rotational energy level of the copper ion is near that of the Mo ion.
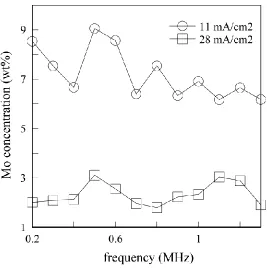
Figure 2 shows the Mo concentration in the Cu-Mo thin film electrodeposited at a temperature of 300 K. The Mo concentration electrodeposited at an amplitude of 11 mA/cm2 is higher than that at an amplitude of 28 mA/cm2. The larger amplitude of the rectangular pulse current gives rise to the larger potential drop at the electric double layer located adjacent to the ITO glass. Hence, the hydrogen evolution at the cathode electrode becomes more enhanced and the Mo concentration in the Cu-Mo thin film lessens.
Figure 2. Frequency-dependence of the Mo concentration in the Cu-Mo thin film electrodeposited in the solution including 0.5 mol/L sodium molybdate dehydrate.
[image:4.596.167.434.332.600.2][image:5.596.109.484.182.442.2]
amplitude of 11 mA/cm2 in Fig. 2 has a periodicity of about 0.2 MHz, which is the same resonant frequency spacing in Ni electrodeposition. On the other hand, the Mo concentration in the Cu-Mo thin film electrodeposited at an amplitude of 28 mA/cm2 appears to have a periodicity of about 0.6 MHz. The Mo concentration in the Cu-Mo thin film has a maximum one of 9 wt% at a frequency of 0.5 MHz.
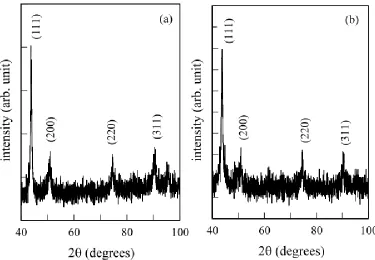
Figure 3. XRD charts of the Cu–Mo films electrodeposited in the solution including 0.5 mol/L sodium molybdate dehydrate at (a) an amplitude of 11 mA/cm2 and a frequency of 0.5 MHz, and (b) at an amplitude of 28 mA/cm2 and a frequency of 1 MHz. The Co-Mo thin films of (a) and (b) had 9 m and 22 m in thickness.
Figure 3 shows XRD charts for two kinds of the Cu-Mo thin films electrodeposited (a) at an amplitude of 11 mA/cm2 and a frequency of 0.5 MHz, and (b) at an amplitude of 28 mA/cm2 and a frequency of 1 MHz. The diffraction peaks observed in Figs. 3 (a) and (b) are indexed as the (111), (200), (220), and (311) crystallographic planes that are well consistent with those of polycrystalline copper. The two XRD charts indicate that these crystallographic planes in the Cu-Mo thin film exist parallel to the ITO glass. As seen in Fig. 3, no other diffraction peaks that arise from chemical compounds are observed. In combination with the Mo concentration by EDX in Fig. 2, the XRD analysis concludes that the Co-Mo thin film is an alloy comprising Cu and Mo. Each diffraction peak in Fig. 3 is broad in width, which suggests that the Cu-Mo film is composed of small grains.
had a maximum value of about 70 wt%. These results also show that Mo can electrodeposit using an aqueous solution free of the iron-group element as well as those in our study.
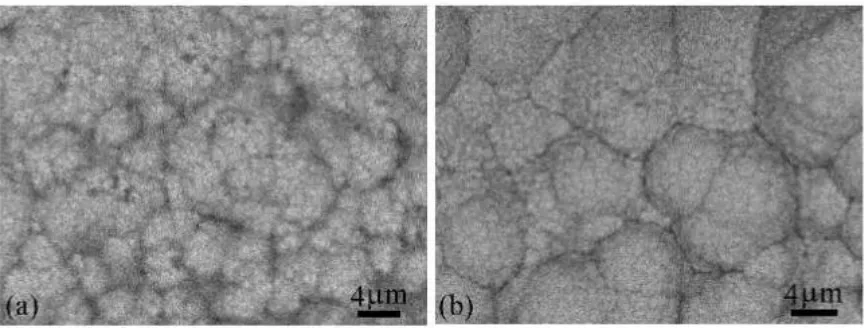
Figure 4 shows SEM images of the Cu-Mo films electrodeposited in the solution including 0.5 mol/L sodium molybdate dehydrate (a) at an amplitude of 11 mA/cm2 and a frequency of 0.5 MHz, and (b) at an amplitude of 28 mA/cm2 and a frequency of 1 MHz. The Cu-Mo thin film in Fig. 4 consists of the island of which the surface appears an aggregation of small grains. The island has a size more than 4 m. The small grain shown in the island is called a nano cauliflower [19-20] that is expected to have the surface roughness at a nanometer level for use in surface wetting. We estimate the grain size d following the Scherrer equation [27],
(1)
where K is the shape factor, is the X-ray wavelength, and the line broadening of a Bragg diffraction angle B. Eq. (1) yields the average size of the grain if the strain in the Co-Mo thin film is ignored. The value of is determined by the Integral Breadth using a Gaussian function [28] fitted to the (111) diffraction peaks in Fig. 3. Substituting the value of and K=1 into Eq. (1), we have 12 nm and 14 nm for the mean grain size in Figs. 4 (a) and (b).
Figure 4. SEM images of the Cu-Mo films electrodeposited in the solution including 0.5 mol/L sodium molybdate dehydrate at (a) an amplitude of 11 mA/cm2 and a frequency of 0.5 MHz, and (b) at an amplitude of 28 mA/cm2 and a frequency of 1 MHz. The Cu-Mo thin films had 3 m in thickness.
3.2 Cu-Mo thin film electrodeposited in the solution including 0.75 mol/L sodium molybdate dehydrate
[image:6.596.87.519.360.524.2]
dehydrate does not necessarily increase the Mo concentration in the Cu-Mo thin film. In Ni-Mo electrodeposition, other studies [28-29] have reported similar experimental results. The electrodeposition of Mo in the aqueous solution that does not include the iron group element is here also verified.
Figure 5. Frequency-dependence of the Mo concentration in the Cu-Mo thin film electrodeposited in the solution including 0.75 mol/L sodium molybdate dehydrate.
[image:7.596.183.418.162.391.2] [image:7.596.165.440.462.663.2]
The Mo concentration periodically changes with the frequency. The resonant frequency may be theoretically determined from the energy level transfer of electron between an electron at the Fermi energy level in the ITO glass and a copper ion or molybdenum ion characterized by the quantized rotational energy level if the quantized rotational energy level is known. In Fig. 5, the Mo concentration that periodically changes with the frequency suggests the presence of the resonant frequency in copper and molybdenum electrodeposition.
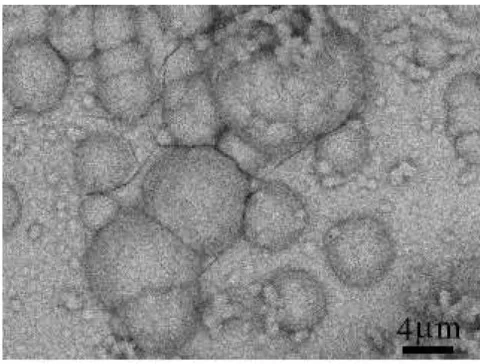
Figure 7. SEM images of the Cu-Mo films electrodeposited in the solution including 0.75 mol/L sodium molybdate dehydrate (a) at an amplitude of 11 mA/cm2 and a frequency of 0.5 MHz, and (b) at an amplitude of 28 mA/cm2 and a frequency of 1 MHz.
Figure 8. SEM image of the Cu-Mo films electrodeposited in the solution including 0.75 mol/L sodium molybdate dehydrate at an amplitude of 11 mA/cm2 and a frequency of 1 MHz.
[image:8.596.76.533.193.366.2] [image:8.596.190.430.452.634.2]
(200), (220), (311) and (222) crystallographic planes, which are well consistent with those of polycrystalline copper. The (222) diffraction peak obviously emerges in only Fig. 6 (b). This is because the Cu-Mo thin film in Fig. 6 (b) is much thicker than other Cu-Mo thin films prepared for XRD. The observed diffraction peaks are caused not by other chemical compounds but by copper. The five crystallographic planes in the Cu-Mo thin film exist parallel to the ITO glass. All the diffraction peaks are broad in width, which indicates that the Cu-Mo film is composed of small grains as well as that electrodeposited in the solution including 0.5 mol/L sodium molybdate dehydrate. Taking into consideration the Mo concentration by EDX in Fig. 5 and the XRD chart in Fig. 6, we here also have the same conclusion that the Co-Mo thin film is an alloy comprising Cu and Mo.
Figure 7 shows SEM images of the Cu-Mo films electrodeposited in the solution including 0.75 mol/L sodium molybdate dehydrate at (a) an amplitude of 11 mA/cm2 and a frequency of 0.5 MHz, and (b) at an amplitude of 28 mA/cm2 and a frequency of 1 MHz. The Cu-Mo thin film is composed of the island of which the surface appears a nano cauliflower as well as that in Fig. 4. The formation process of the island more than 4 m in size does not make clear. As shown in Fig. 8, a SEM image of the Cu-Mo thin film at an amplitude of 11 mA/cm2 and a frequency of 1 MHz reveals that the islands different in size and a lot of small particles coexist. Several small particles on the surface seem to aggregate into a chain that may develop an island. In the same way as the estimation of the small grain size in Fig. 3, we obtain 12 nm and 25 nm for Figs. 6 (a) and (b) as the mean grain size. As the film thickness of the Cu-Mo thin film in Fig. 6 (b) is thicker than that in Fig. 6 (a), grain growth may cause an increase in the size of the grain in electrodeposition.
In a further study, we will report a Cu-W thin film generated using the rectangular pulse current having a frequency of megahertz.
4. CONCLUSIONS
The Cu-Mo thin films generated on the ITO glass by the rectangular pulse current technique were shown to be the alloy comprising Cu and Mo using EDX and XRD. The Mo electrodeposition on the ITO glass was demonstrated using the solution that does not include the iron group element. The maximum Mo concentration in the Cu-Mo thin film was about 9 wt%. The Mo concentration periodically changed with the frequency is explained by the energy level transition of electron. The SEM images of the surface morphology in the Cu-Mo thin film showed the appearance like the nano-cauliflower.
References
1. A. Brenner, Electrodeposition of Alloys, Academic Press, New York, London, 1963. 2. E. B. -Lehman and P. Indyka, Thin Solid Films, 520 (2012) 2046.
3. L. S. Sanches, S. H. Domingues, C. E. B. Marino, and L. H. Mascaro, Electrochem. Comm., 6 (2004) 543.
5. H. Kazimierczak, P. Ozga, and R. P. Socha, Electrochim. Acta, 104 (2013) 378. 6. E. Gómez, E. Pellicer, and E. Vallés, J. Appl. Electrochem., 33 (2003) 245.
7. Y. Messaoudi, N. Fenineche, A. Guittoum, A. Azizi, G. Schmerber, and A. Dinia, J. Mater. Sci.: Mater. Electron, 24 (2013) 2962.
8. E. B. -Lehman, A. Bigos, P. Indyka, and M. Kot, Surf. Coat. Technol., 211 (2012) 67. 9. E. Gómez, E. Pellicer, and Elisa Vallés, J. Electroanaly. Chem., 580 (2005) 222. 10. H. S. Yancheshmeh and M. Ghorbani, Surf. Coat. Technol., 238 (2014) 158.
11. O. Aaboubi, A.Y. A. Omar, A. Franczak, and K. Msellak, J. Electroanaly. Chem., 737 (2015) 226. 12. E. Chassaing and K. V. Quang, J. Appl. Electrochem., 19 (1989) 839.
13. M. Saitou, Int. J. Electrochem. Sci., 11 (2016) 5535.
14. E. B-Lehman, P. Ozga, and E. Chassaing, Surf. Coat. Technol., 78 (1996) 233. 15. M. Xia, T. Lei, N. Lv, N. Li, Int. J. Hydrogen. Energ., 39 (2014) 4794.
16. M. Gotou, T. Arakawa, N. Watanabe, T. Hara, T. Tomita, A. Hashimoto, H. Tanaka, and I. Koiwa, ECS Electrochem Lett., 3 (2014) D19.
17. M. Gotou, T. Arakawa, N. Watanabe, T. Hara, T. Tomita, A. Hashimoto, H. Takanashi, and I. Koiwa, Bull. Chem. Soc. Jpn., 88 (2015) 173.
18. C. Kittel, Introduction to Solid State Physics 8th ed., John Wiley & Sons, 2005. 19. B. N. Sahoo and K. Balasubramanian, J. Colloid Interf. Sci., 436 (2014) 111.
20. M. Castro, R. Cuerno, M. Nicoli, L. Váquez, and J. G. Buijnsters, New J. Phys., 14 (2012) 103039. 21. T. J. Morley, L. Penner, P. Schaffer, T. J. Ruth, F. Bénard, and E. Asselin,Electrochem. Commun.,
15 (2012) 78.
22. R. Syed. S. K. Ghosh, P. U. Sastry, G. Sharma, R. C. Hubli, and J. K. Chakravartty, Surf. Coat.Technol., 261 (2015) 15.
23. H. Kazimierczak, A. Hara, A. Bigos, and P. Ozga, Electrochim. Acta, 202 (2016) 110. 24. H. Kazimierczak and P. Ozga, Surf. Sci., 607 (2013) 33.
25. H. Kazimierczak, P. Ozga, K. Berent, and M. Kot, J. Alloys Compd., 636 (2015) 156 26. R. Rastogi and A. Pandey, Indian J. Chem. Technol., 17 (2010) 381.
27. J. I. Langford and A. J. C. Wilson, J. Appl. Crys., 11 (1978) 102. 28. M. Saitou, Int. J. Electrochem. Sci., 9 (2014) 6033.
29. M. Donten, H. Cesiulis, Z. Stojek, Electrochim. Acta, 50 (2005) 1405.