Solubility and Nucleation of Methyl Stearate as a Function
of Crystallization Environment
Diana M. Camacho,
*
,†Kevin J. Roberts,
†Iain More,
‡and Ken Lewtas
‡,§ †School of Chemical and Process Engineering, University of Leeds, Leeds, LS2 9JT, U.K. ‡Infineum UK Ltd., Milton Hill Business and Technology Centre, Abingdon, OX13 6BB, U.K.*
S Supporting InformationABSTRACT: Crystallization studies of methyl stearate from supersaturated dodecane, kerosene, and toluene solutions reveal strong evidence that solvent choice influences solubility and nucleation behavior. Solute solubility is less than ideal with toluene, kerosene, and dodecane, respectively, exhibiting the closest behavior to ideality, the latter consistent with the highest solvation. Polythermal crystallization studies using the Kashchiev−Borissova−Hammond−Roberts (KBHR) model [Kashchiev et al.J. Phys. Chem. B2010,114, 5441; Kashchiev et al.J. Cryst. Growth2010,312, 698; Camacho et al.CrystEngComm2014,16, 974] reveal a progressive nucleation (PN) mechanism with crystallite interfacial tension (γeff) values between 0.94 and 1.55 mJ/m2, between
1.21 and 1.91 mJ/m2, and between 1.18 and 1.88 mJ/m2for dodecane, kerosene, and toluene, respectively. Nucleation rates at
the critical undercooling lie between 4.56×10¹⁶and 1.79×10¹⁷nuclei/mL·s, with the highest rates associated with crystalliza-tion from kerosene solucrystalliza-tions. Iso-supersaturacrystalliza-tion nucleacrystalliza-tion rates are the highest for dodecane ranging from 2.39 ×10¹⁷ to
3.63 × 10¹⁸ nuclei/mL·s. Nucleation in toluene appears to be hindered by its relatively higher interfacial tension, which is associated with nucleation rates about an order of magnitude less than those obtained for dodecane.
1. INTRODUCTION
The study of diesel and biodiesel fuel crystallization is of impor-tance to the fuel industry as poor cold-flow properties of these mixtures can cause operability problems within vehicle engines, pipelines, and vehicle tanks under cold weather conditions due to the formation of crystals at low temperatures. To date most research has focused on the crystallization within diesel fuel,4−15 which mostly comprises alkanes, with much less emphasis being placed on the study of biodiesel fuel. First-generation biodiesel fuels are generally a mixture of both saturated and unsaturated methyl esters from which the former represent an important pro-portion of these solutions and commonly contain methyl pal-mitate (C16:0) and methyl stearate (C18:0). The cold-flow behav-ior of biodiesel is determined to a great extent by the amount of saturated compounds present in its composition.
Some studies16−19have been carried out in order to character-ize the cold-flow behavior of biodiesel fuel produced from diff er-ent bioresources, measuring certain properties such as cloud point (CP), pour point (PP), and cold filter plugging point (CFPP) and the effect of cold-flow improvers on these prop-erties. The fractionation of methyl esters crystallizing from biodiesel fuel mixtures produced from different bioresources has also been addressed.20−25However, up to now there has been a lack of fundamental studies on the nucleation of saturated methyl esters, such as methyl palmitate and methyl stearate.
As a baseline case, it is the aim of this study to deliver funda-mental information on the solubility and nucleation of methyl stearate measured as a function of solution environment. In this the solubility is assessed using the van’t Hoffanalysis.26This was combined with a rigorous analysis of the associated nucleation data through the recently developed Kashchiev−Borissova− Hammond−Roberts (KBHR) theory.1−3This theory, outlined in section 2, permits a first-principles analysis of nucleation
kinetics and enables the derivation of key kinetic parameters and the characterization of the nucleation mechanism.
Because in real-world operation biodiesel fuel is commonly mixed with traditional diesel fuel, three different model solvents were chosen representing the variation in solvation environment, viz., dodecane, toluene, and kerosene.
2. NUCLEATION KINETICS AND MECHANISM
2.1. Classical Nucleation Theory (CNT) and Its Assess-ment. The classical 3D nucleation theory (CNT) provides a model for the prediction of the rate at which nuclei of a new crystalline phase are formed. This model given byexpression 1
describes the dependence of the nucleation rate (J) on two terms: a thermodynamic (exponential) component which accounts mainly for the effect of temperature, supersaturation ratio (S), and effective interfacial tension (γeff) on the formation of nuclei
and a kinetic (pre-exponential) component which describes the frequency with which molecules will attach to the nucleus. The relative balance between these two terms determines a system’s nucleation behavior.
γ
= −
J KJexp{ [k vn 02eff3/(kT) (ln ) ]}3 S2 (1)
whereKJis the nucleation rate constant,knis the nuclei numerical
shape factor, i.e., 16π/3 for spherical nuclei and 32 for cubic nuclei, v0is the volume occupied by a solute molecule in the crystal, andk
is the Boltzmann constant.S, the supersaturation, is given by:
=
S x
xe (2)
Received: October 19, 2017
Revised: February 9, 2018
Published: February 20, 2018
Article
pubs.acs.org/EF Cite This:Energy Fuels2018, 32, 3447−3459
Herexis the solution’s molar concentration andxeis the equi-librium concentration.
Supersaturation can also be expressed as the relative super-saturation (σ) as given byexpression 3:
σ =S−1 (3)
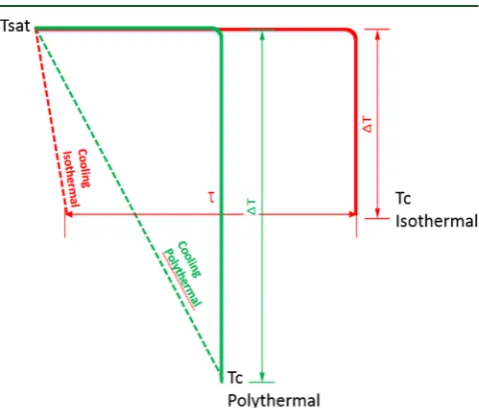
The analysis of nucleation kinetics can be performed by either the isothermal methodology or the polythermal methodology, which both use the concept of solution state metastability to create the supersaturation needed to promote nucleation. (seeFigure 1). The isothermal method makes use of the kinetic expressions derived from classical nucleation theory, in particular, utilizing the assumption that the induction time (τ) can be taken as being inversely related to the nucleation rate (J). In contrast, the polythermal method assesses nucleation through establishing the effect of cooling rate (q) on crystallization temperature (Tc).
2.1.1. The Isothermal Method.In this method, one can calcu-late key nucleation parameters including the interfacial tension (γ) and the critical nucleation cluster size (r*), as a function of solution supersaturation and temperature.
In this case, many experiments ideally should be carried out, i.e., typically 5−10 different supersaturations with ca. 80 repeats at each chosen supersaturation.27The analysis of this data is rela-tively simple, though, as nucleation rates can be directly extracted byfitting a probability distribution of the measured induction times. A comprehensive assessment that quantifies the uncer-tainty associated with the parameters estimated using this meth-odology is provided in the work presented by Xiao et al.28
2.1.2. The Polythermal Method.The polythermal approach continuously varies the solution supersaturation, and hence induction time, upon cooling and assesses the balance between excess concentration generation via the cooling rate and the material’s intrinsic nucleation rate. The effect that supersatu-rations has on nucleation is implicitly evaluated over the whole width of the metastable zone. This is defined, for the work presented here, as the difference between the equilibrium con-centration derived from van’t Hoff analysis and the solution concentration pertinent to the temperature at which sponta-neous crystallization occurs.
The process involves driving the solution by cooling until the induction time is effectively zero, i.e., the point at which sponta-neous nucleation takes place. Under these conditions mass trans-fer due to molecular diffusion can be expected to be rapid and hence the degree of statistical variation would be much less than that for induction time measurements. The latter is typically recorded for lower supersaturations, concomitantly larger cluster sizes, and lower levels of molecular diffusion.
In the polythermal case, experimental data is comparatively easy to collect using automated temperature controlled solution turbidimetric methods. As nucleation is clearly of a stochastic nature, in our analysis all the determined parameters are pre-sented with their corresponding standard deviations using the most reliable experimental methodology developed in our pre-vious work.3In this, we have shown that typicallyfive repeats at each cooling rate are sufficient (section 2 of the Supporting Information provided in ref3) to obtain reliable data to perform an assessment using this approach.
The analysis of polythermal data can be much more complex than the isothermal case and could be performed using a number of different available models, both empirical29,30andfirst prin-ciples.31−33The most widely used interpretation ofΔTc(q) data
is using the empirical Nyvlt expressions.29,30However, given the empirical nature of the Nyvlt approach, Kubota31and Sangwal32,33
have reinterpreted these equations in order to derive more physically meaningful parameters. An example of the application of these approaches is provided by Mitchell et al.,34 where key kinetic parameters were derived for paracetamol−ethanol solutions.
2.1.3. Comparison between Isothermal and Polythermal Methods.Figure 1compares the different approaches used in
each of the methodologies to collect experimental data. Using a turbidimetric technique, in the isothermal method a clear homo-geneous solution is rapidly cooled to a given supersaturation where the solution is kept until crystallization is detected through the increase in the solution’s turbidity, after a given induction time (τ). On the other hand, in the polythermal method a solu-tion is cooled continuously at a given rate, until crystallizasolu-tion is detected through the increase in the solution’s turbidity. Although in the isothermal method the onset of crystallization is monitored at the same temperature (or supersaturation), this method is to a certain extent inherently polythermal as the solution has already gone through a number of different temper-atures (or saturations) during the initial rapid cooling to the chosen supersaturation. Although the two methodologies are apparently quite different, interestingly, they reach the same end point; e.g., as shown in Table 9 in Camacho et al.,3nucleation parameters calculated via the two methodologies are broadly equivalent. For clarity to the reader on how to establish the corre-sponding supersaturations using either of the two methodolo-gies, Figure S1 in theSupporting Information(SI) provides also a comparison based on a plot of concentration vs temperature.
Due to the nature of crystallization in methyl ester solutions, characterized for very narrow metastable zones and very short induction times, a polythermal method was used to collect experimental data. Details of this methodology are provided in
section 4.
[image:2.625.325.565.136.340.2]2.2. The Kashchiev−Borissova−Hammond−Roberts (KBHR) Approach. A first-principles analytical polythermal approach, the Kashchiev−Borissova−Hammond−Roberts (KBHR) approach, comprises a set of model equations analyt-ically derived starting from the Kolmogorov−Johnson−Mehl− Avrami (KJMA) expression. Such a model is analogous to “chemical reaction progress kinetic analysis,”35in which reaction progress is monitored as a function of a dynamically changing Figure 1.Comparative scheme of the different approaches used to collect experimental crystallization temperatures using both the isothermal and the polythermal methods.
reactant concentration, which is akin to carrying out hundreds of separate initial rate experiments.35A key outcome of the KBHR model is the so-called“rule of three”1,2which can be used to dis-criminate between two case nucleation mechanisms, i.e., progres-sive nucleation and instantaneous nucleation.
In progressive nucleation (PN),2new crystal nuclei are con-tinuously formed in the presence of the already growing ones. In this case the measured induction times are associated with both the nucleation and the growth processes until the crystals reach a size where they are detectable optically via the turbi-dimetric technique.
In instantaneous nucleation (IN),1all nuclei emerge at once at the beginning of the crystallization process to subsequently grow and develop into crystals. In this case, strong nucleation sites will favor the nucleation process and therefore inductions times are only associated with the time for these crystals to grow to a detectable size.
The expressions related to both the PN and IN mechanisms, analytically derived in the KBHR approach, are presented below.2
2.2.1. Progressive Nucleation.The general expression relat-ing critical undercoolrelat-ing and coolrelat-ing rate for this mechanism is given byexpression 4:
= + −
−
q q a u a
u u
ln ln ln
(1 )
0 1 c 2
c c2 (4)
The relative critical undercooling (uc) is a dimensionless quantity associated with the critical undercooling (ΔTc) given by
= Δ
u T
T
c c
e (5)
Similarly, the critical undercooling ΔTc, which represents the
solution’s metastability limit in terms of temperature, is defined as
ΔTc=Te−Tc (6)
whereTeandTcare the solution equilibrium and crystallization
temperatures, respectively.
Expression 4 describes the dependence of the number of crystals at the detection point (Ndet) on the cooling rate (q) when d= 0; i.e., the volume of single crystals is unaccounted for (see derivation in theSI) and thus the free parametersa1,a2, andq0 are given by2
=
a1 3 (7)
=
a2 b (8)
=
q VK T
N 2b J 0
e
det (9)
whereVis the volume of the solution andbis given by2
γ λ
=
b k v
kT n 0 2 eff 3 e 2 (10)
In this expressionλis the molecular latent heat of crystallization. When eq 4 is derived by means of the relative volume of crystals (α), the parametersq0,a1, anda2are defined by
= + + a nmd md 3 3 1 1 (11) = + a b md 1 2 (12) α
= Γ + +
+ + + + ⎪ ⎪ ⎪ ⎪ ⎧ ⎨ ⎩ ⎫ ⎬ ⎭
q T n md K a K K
n b
[( 1) 1]
( 1) (2 )
v nmd
J md
d n md
md
0 e
G
( 1) 1
det
1/( 1)
(13)
Here, dis the dimensionality of crystallite growth, i.e., 3 for spheres or cubes, 2 for disks or plates, and 1 for needles.nand m> 0 are the crystallite growth exponents which are related to the different growth mechanisms.36Then= 1 case corresponds to growth mediated by diffusion of solute toward the crystallite or transfer of solute across the crystal/solution interface. Then= 2 case characterizes growth controlled by the presence of screw dislocations in the crystallite. The parametermranges between 1/2 and 1: m = 1/2 is for growth controlled by undisturbed diffusion of solute, andm= 1 is for growth by diffusion of solute through a stagnant layer around the crystallite or for normal or spiral growth limited by transfer of solute across the crystal/ solution interface. Atm= 1 the crystallite radius increases linearly with time.1,2,37kv(m3−d) is the crystallite’s growth shape factor, i.e., 4π/3 for spheres, 8 for cubes,πH0for disks, 4H0for square
plates (H0is thefixed disk or plate thickness), and 2A0for needles (A0is the fixed needle cross-sectional area).KG is the crystal
growth rate constant,Γis the gamma function, andαdetis the relative volume of crystals at the detection point.
2.2.2. Instantaneous Nucleation. In the case of IN, the expression for the dependence of relative critical undercooling on cooling rate is given by
= +⎜⎛ ⎟ + − +
⎝ ⎞⎠
q q
m u u
ln ln 1 ln[ n m n m]
0 c
( 1)
0( 1)
(14)
In this expressionu0≥0,uc>u0, and the parameterq0is given by
α = + ⎡ ⎣ ⎢ ⎢ ⎤ ⎦ ⎥ ⎥
q k C
n a K T
( 1) v d md n 0 0 det 1/ G e (15)
whereC0is the concentration of nuclei at the time at which the instantaneous nucleated crystallites are formed andais given by
expression 16: λ
=
a
kTe (16)
If, additionally, the undercooling at which all nuclei sponta-neously appear is small enough so that
≪
+ +
u0(n 1)m uc(n 1)m (17)
eq 14takes the form of a straight line given by
= + +
q q n u
ln ln ( 1) ln
0 c (18)
The lnqvsucline corresponding toexpression 4is only slightly curved; thus in a not too wide experimentalqrange it can be approx-imated to a straight line.1,2This linear relationship can be analytically derived using an arbitrarily critical undercooling as shown in ref2
and is given byexpression 19. When comparing this expression witheq 18, then from the slope of a line of the dependence of relative critical undercooling for crystallization (uc) on the cooling rate (q), the nucleation mechanism can be established using the“rule of three”:1,2slope > 3 = PN or slope < 3 = IN.
ω = + + + + ⎜ ⎟ ⎛ ⎝ ⎞ ⎠
q Q nmd
md a u
ln ln 3 3
1 2 ln c (19)
Inexpression 19ωis a positive number andQis a parameter related toq0.1
Bothexpressions 4 and14are subjected to the inequalities (20) as shown in the analytical derivation in section 2 of theSI. This means that this analysis is restricted to small enough values of the critical undercooling (u) for which the inequalities are satisfied:
< <
u 0.1, au 1 (20)
The critical radius of the nucleus (r*) and the number (i*) of mol-ecules in the critical nucleus can be calculated fromexpressions 21
and22given in terms of the relative undercoolingu. γ
λ
* =
r v
u
2eff 0
(21)
λ
* =
i bkT u
2 e
3 (22)
The classical 3D nucleation rate model, given in terms of the parameters defined by the KBHR approach, is presented ineq 23:
= − −
J t( ) KJe b/[(1 u u) ]2 (23)
HereKJis related to the attachment frequency of monomers to the nucleus (f*), the concentration of nucleation sites (C0), and
the Zeldovich factorZ. The latter accounts for the probability that a critical nucleus would become a crystal and not redissolve. The attachment frequency (f*) is given by eitherexpression 24
or 25for attachment of monomers controlled by volume dif-fusion or interface transfer, respectively.37
π ξ
* = *
f 4 r DX1 (24)
ξω
* = * *
f d A X0 1 (25)
whereξis the sticking coefficient,Dis the diffusion coefficient of colliding building units,X1is the concentration of colliding
build-ing units,ω* is the transfer frequency of building units from adsorbed to integrated,d0is the thickness of the adsorbed surface
layer, andA*is the surface area of the nucleus.
The attachment of building units to the cluster is quite sensi-tive to changes in the temperature, the effect being mainly due to the viscosity. This is particularly relevant when the attachment of monomers is controlled by volume diffusion and nucleation occurs within a temperature range in which the solution viscosity varies strongly withT.
It is important to highlight here that, due to the nature of the derivation of the KBHR approach, the assessment of polythermal data using this theory is subject to the following assumptions:
1. The supersaturation at which crystallization is detected (MSZW) has to be sufficiently small, and the solution viscosity does not change significantly within the assessed range.
2. The former will allow the assumption that the nucleation mechanism does not change within the range of concentrations measured on cooling.
A fuller description of this theory is provided in theSI.
3. MATERIALS AND METHODS
3.1. Materials.Methyl stearate, dodecane, and toluene were
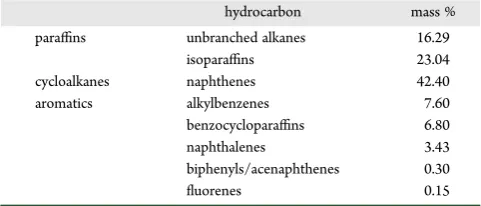
pur-chased from Sigma-Aldrich. The purity of the methyl stearate used was 96%, and that of the two solvents was higher than 99%. No further purification was carried out. Kerosene was supplied by Infineum Ltd. (Milton Hill, Oxfordshire, U.K.). Its hydrocarbon composition is summarized inTable 1. Itsn-alkane chain length distribution is given in Figure S2 of theSI.
3.2. Equipment and Experimental Procedure for Polythermal
Data Collection.Crystallization experiments were carried out using the
Technobis Crystal 16 system https://www.crystallizationsystems.com/ crystal16. This provides a multiple reactor facility with four separate
Peltier heated aluminum blocks, each of which has a capacity to hold four magnetically agitated 1 mL solution vials. Each block can be individually programmed to follow a given temperature profile during which the variations in the solution turbidity are followed as a function of temperature.
Solutions of methyl stearate in three different solvents, dodecane, kerosene, and toluene, were prepared at solution concentrations of 200, 250, 300, and 350 g of solute/L of solvent for thefirst two solvents and 154, 192, 231, and 269 g of solute/L of solvent for toluene.
In order to ensure accurate measurement of temperatures, calibration of the Crystal 16 unit was required. Four vials containing each of the solvents were placed in each of the blocks which were programmed to a specific temperature in the range 20 to−8°C. While each block was kept at a chosen temperature, measurements of the actual temperature with ±0.5°C accuracy were carried out by positioning a thermocouple within each of the vials. The average of the four temperature readings obtained in each block was plotted against the programmed temperature and fitted by a straight line represented by the expressionsy= 0.87x+ 2.20,
y= 0.96x+ 1.34, andy= 0.95x+ 0.99 for dodecane, kerosene, and tolu-ene, respectively. These expressions were then used to correct the exper-imentally measured temperature values. The temperature-calibration lines obtained are given in Figure S3 in theSI.
The solutions were subjected to heating and cooling cycles, with each cycle initiated by heating the solutions to 40°C, where they were held for 1 h to ensure complete homogenization, and then cooled to−15°C, where they were also held for 1 h to allow equilibration. This temper-ature profile was applied at each solution’s concentration using four different rates of 0.25, 1.0, 3.2, and 9.0°C/min for the dodecane and kerosene systems and 0.25, 0.5, 1.0, and 1.5°C/min for toluene solu-tions. The ranges of both concentrations and cooling rates for solutions of a given solvent were chosen to ensure accurate temperature profiles. This was achieved by setting temperatures profiles in which crystal-lization was detected above−15°C (lowest working temperature of the Crystal 16) and a sufficiently wide range of cooling rates in compliance with both the equipment cooling power capacity and the methodology applied. For the solutions where crystallization was detected at lower temperatures, a narrower cooling range had to be used due to the decrease in the equipment cooling capacity observed at these temper-ature levels.
At each rate the temperature cycle was repeatedfive times to obtain average values for the crystallization and dissolution temperaturesTc
andTdiss.These were estimated based upon the points in the turbidity
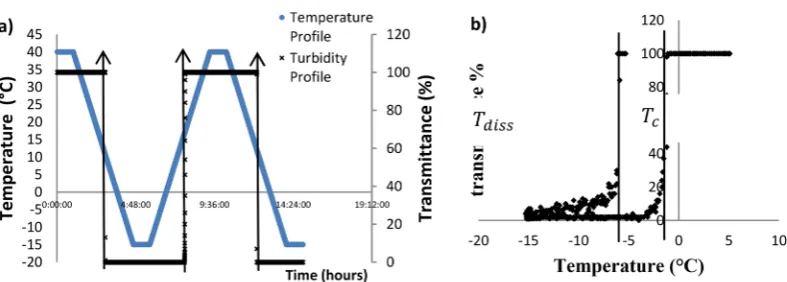
profile at which sudden changes in light transmittance are detected,Tc. Figure 2shows a typical experimental profile together with a represen-tative raw data set for one of the experimental runs.
To assess the influence of the solute and solvent molecule’s polarity on the solubility of methyl stearate, its dipole moment was calculated in a vacuum using three different methods: semiempirical:AM1, Hartree− Fock:3-21G, and DFT:B3LYP/6-31G*, delivering values of 1.67, 1.54, and 1.52 D, respectively (Ken Lewtas, private communication, Sept 4, 2015).
3.3. Data Analysis.3.3.1. Solubility.The polythermal data were
used to establish the solubility for methyl stearate in dodecane, kerosene, and toluene solutions by extrapolation of theTdiss(q) lines to 0°C/min.
[image:4.625.324.565.96.199.2]The solubility was modeled according to the van’t Hoffequation given byexpression 26. This expression is derived from the general expression of solid−liquid equilibrium assuming that the specific heat capacity Table 1. Composition of Kerosene from Two-Dimensional Gas Chromatography Analysis Performed by Infineum UK
hydrocarbon mass %
paraffins unbranched alkanes 16.29
isoparaffins 23.04
cycloalkanes naphthenes 42.40
aromatics alkylbenzenes 7.60
benzocycloparaffins 6.80
naphthalenes 3.43
biphenyls/acenaphthenes 0.30
fluorenes 0.15
(ΔCp) can be neglected. This assumption can be applied to the analysis
of methyl stearate solubility as according to previous work38ΔCpvalues
do not change significantly within the temperature range studied here.
= −Δ + Δ
x H
RT S R
ln( )e diss diss (26)
The strength of the solutions’chemical interactions was assessed by comparing the solubility with the ideal model solid−liquid equilibrium given byexpression 27:
= −Δ + Δ
x H
RT S R ln( )e
fus fus
(27)
In these expressionsxeis the mole fraction of the solute in the solution
at saturation;Tis the solution temperature;ΔHdiss(J/mol) andΔHfus
(J/mol) are the molal enthalpies of dissolution and fusion, respectively; ΔSdiss(J/mol·K) andΔSfus(J/mol·K) are the molal entropies of dissolution
and fusion, respectively; andR(8.314 J/mol·K) is the gas constant. A compound’s molar solubility can be related to the solubility of its ideal state through its activity coefficient (Υ) which is given byexpression 28
obtained by equating the activityacat the solution’s equilibrium and that
of its ideal state:
Υ = x
x
ideal
e (28)
An activity coefficient equal to 1 indicates the solution behaves ideally; i.e., the enthalpy of dissolution is equal to 0, as the energy needed to break solute−solute interactions added to that of breaking solvent−solvent interactions is equal to the energy released when solute−solvent bonds are formed. On the other hand, if the activity coefficient is either lower or higher than 1, this would indicate a solution will dissolve more or less of the expected solute concentration at equilibrium, respectively. ForΥ> 1 forces of attraction between like molecules would be favored over those of unlike molecules. ForΥ< 1 forces of attraction between unlike molecules would be favored over those of unlike molecules. Deviations from a solution’s ideal behavior can be due to either enthalpic or entropic factors, and this can be established by comparing the solubility of the van’t Hoff model line with that of the ideal solution under the same temperature range. If the slopes of the lines are different, dissolution would be both enthalpic and entropic driven. If the lines are parallel, this would indicate that dissolution is only entropically driven.
3.3.2. Nucleation kinetics.Using the KBHR approach, the analysis of nucleation kinetics, from polythermal experimental data, can be performed following the procedure in theflowchart given in Figure 4 of theSI.
4. RESULTS AND DISCUSSION
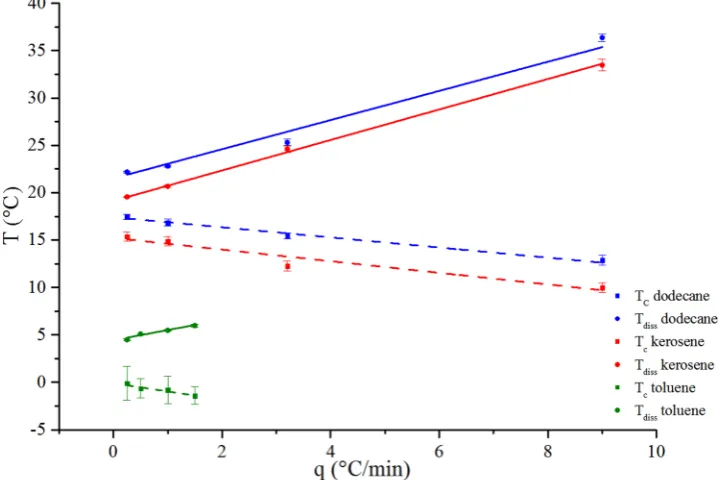
4.1. Solubility.The average values for the collected crystal-lizationTcand dissolutionTdisstemperatures together with the corresponding standard deviations (SDs) as a function of cooling rateqand concentration are presented in theSI. An example of the linear dependence ofTcandTdissonqis given inFigure 3.
The saturation temperatureTe, obtained from the extrapolation
to 0°C/min ofTdiss(q) lines at each of the solution’s concentra-tions, are also shown in Table S1 of theSI.
The specific data points used to model the solubility according to the van’t Hoffequation are given inTable 2, together with the corresponding enthalpy and entropy of dissolution and mixing (ΔHmixandΔSmix). The activity coefficients and their modeled
dependence on temperature are also provided. Methyl stearate enthalpy (ΔHm) and entropy (ΔSm) of melting are 53.94 kJ/mol
and 0.17 kJ/mol·K, respectively. The subtraction of these values from those of enthalpy and entropy of dissolution delivered the corresponding values of enthalpy and entropy of mixing. The comparative van’t Hofflines are given inFigure 4.
van’t Hoffplots fit well to a linear model for all solutions studied. This indicates consistency of the structure of a material, in the corresponding range of temperature. Activity coefficients are all higher than 1, indicating that solute−solute interactions are stronger in all cases. However, the significantly lower values obtained in toluene together with the lowest enthalpy of mixing suggest that in these solutions solute−solvent interactions are stronger than in the other two solvent systems.
The highest solubility is observed in toluene and decreases as a function of solvent in the following order: toluene > kerosene > dodecane. This is in the same order as polarity/aromaticity. Fatty acid methyl esters are organic compounds with medium polarity due to the presence in their chemical structure of both a COO− alkyl group and a nonpolar long hydrocarbon chain. The solubil-ity trend could be justified in terms of the solvent polarity and the like-dissolves-like rule of thumb; i.e., a nonpolar compound will be dissolved by nonpolar solvents and vice versa. Straight chain n-alkanes such as dodecane with a dipole moment of around 0.07 D39are essentially nonpolar molecules which will have lower affinity with methyl stearate, whose dipole moment calculated in a vacuum ranges between 1.52 and 1.67 D. On the other hand, toluene will show better affinity due to a higher dipole moment equal to 0.36 D.39Kerosene is expected to deliver a solubility higher than that of dodecane but lower than that observed in toluene due to its composition that comprises different types of hydrocarbon molecules including aromatic species.
[image:5.625.116.510.63.204.2]According to this, it could be expected that dipole−dipole interactions between methyl stearate and toluene molecules are stronger. Additionally, it has been hypothesized39,40that the low activity coefficients obtained in the case of toluene are likely to be, to a great extent, due to the polarizing effect created by the delocalized electron cloud around the benzene ring.40This could cause the distortion of the electron cloud around the solvent molecule inducing temporary dipoles among solute−solvent Figure 2.(a) Typical experimental profile using Crystal 16 by applying the polythermal method. (b) Representative turbidity profile in transmittance vs temperature coordinates obtained by the application of a polythermal method.
molecules which can be quite strong interactions in the case of the benzene ring, due to the effect of London dispersion forces.39 This effect appears to be manifested through the very lowΔHmix
in toluene solvent, consistent with the high released of energy associated with the formation of these solute−solvent bonds.
The noticeable dependence of activities on temperature for kerosene solutions can be evident on the steep slope of the van’t Hoffline. Higher enthalpy and entropy of dissolution in this case are likely to be due to the range of different compounds present in kerosene, especially the aromatic molecules, which not only differ in size but will also complicate chemical interaction with the solute.
4.2. Nucleation Kinetics.Values of the relative critical under-coolingucat the corresponding concentrations and cooling rates are presented in Table S1 of theSI. For each of the four solution concentrations within each solvent system, a plot of the cooling rateq(K/s) vs relative critical undercoolingucin ln−ln coordinates
was then constructed to obtain the slope of the straight line
fitting these data points according toexpressions 18and19.
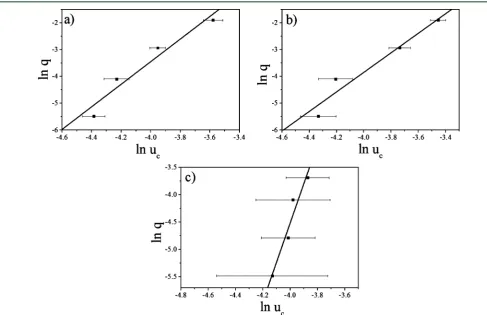
Figure 5presents an example of the plot obtained for a concen-tration of 250 g/L in dodecane and kerosene solutions and for a concentration of 192 g/L in toluene solutions. The best linear
fittings to these data are given byy= 4.21x+ 13.41,y= 3.65x+ 10.76, andy= 7.16x+ 24.13, respectively. The slope and the correlation coefficientR2of the best-fit straight line to the data
for each concentration within the three solvent systems are pre-sented inTable 3.
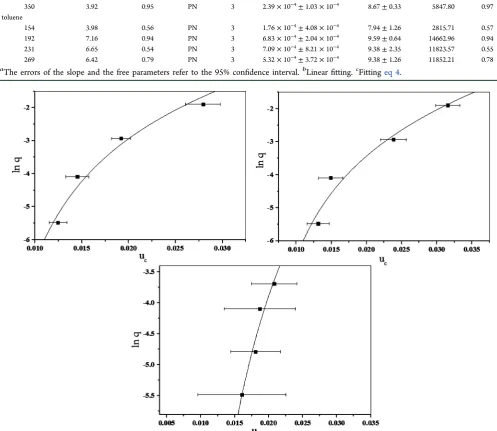
In all cases the slopes of the lines are higher than 3, suggesting that crystallization of methyl stearate proceeds via the PN mech-anism. Thus, according to the KBHR approach,eq 4should describe the experimental data plotted in lnqvsuccoordinates. The values ofa1,a2, and lnq0parameters obtained, using OriginPro 8.5.1, are
[image:6.625.132.492.71.311.2]presented inTable 3. For each of the solution concentrations, within each solvent system these values along with the correlation coefficients for thefitting ofeq 4to the experimental data are given. The best-fit curves between the experimentaluc(q) values and those calculated from eq 4 were obtained by setting a1 = 3. Table 2. Solubility, Enthalpy, and Entropy of Dissolution and Mixing for Methyl Stearate in Three Different Solvents, Together with Corresponding Activity Coefficientsa
solvent T(°C) xe ΔHdiss(kJ/mol) ΔSdiss(kJ/mol·K) ΔHmix(kJ/mol) ΔSmix(kJ/mol·K) Υ(20°C) lnΥ=aT+b
dodecane 18.70 0.132 63.55±10.860 0.20±0.037
9.61 0.03 2.01 −0.013T+ 0.96
21.09 0.160 22.18 0.186 24.12 0.210
kerosene 17.25 0.123 69.80±2.874 0.22±0.098
15.87 0.05 1.85 −0.022T+ 1.06
19.21 0.149 20.86 0.173 22.01 0.196 toluene 1.90 0.052
59.84±3.785 0.19±0.014 5.90 0.02 1.14 −0.009T+ 0.31
4.36 0.064 6.04 0.076 7.50 0.088
aParameter values obtained by modeling solubility data according to the van’t Hoffplot. The errors of the slope and the intercept for enthalpy and
entropy of dissolution refer to the 95% confidence interval.
Figure 3.CrystallizationTcand dissolutionTdisstemperatures as a function of cooling rateqfor solution concentrations of 250 g/L for methyl stearate
crystallizing from dodecane and kerosene solvents and of 192 g/L for methyl stearate crystallizing from toluene solvent.
[image:6.625.67.563.378.518.2]Examples of such curves for the concentration of 250 g/L in dodecane and kerosene solutions and for a concentration of 192 g/L in toluene solution are presented inFigure 6.
Even though a much lower range of cooling rates was used for the toluene solvent (0.25−1.5°C/min compared to 0.25−9°C/min for the other two solvents), the low values ofR2suggest that both
relationships given byeqs 4and18are not followed. Thus, in this particular case further analysis could be undertaken by solving numerically eq 8 in theSI. The numerical solution of this equa-tion would allow nucleaequa-tion kinetic parameters to be obtained
[image:7.625.162.466.67.265.2]that would give a better fit regarding the dependence of the relative volume of crystals on the relative critical undercooling. Comparison of this trend line with the corresponding experi-mental data would provide an insight into whether this system can be better analyzed using this more rigorous approach when compared to the constraints inherent in the analytical solution. In particular, such constraints describe only the early stages of crys-tallization over which concentration can be assumed to remain virtually unchanged and hence the dependence ofKJandbonC andTcan be effectively ignored. If this is the case, the solution Figure 5.Experimental polythermal data in lnqvs lnuccoordinates (a, b) for solution concentration of 250 g/L for methyl stearate crystallizing from
[image:7.625.63.551.295.610.2](a) dodecane and (b) kerosene solvents and (c) for solution concentration of 192 g/L for methyl stearate crystallizing from toluene solvent.
viscosity could also be assumed to remain virtually unchanged on cooling.
Nonetheless, the analysis was still performed for toluene solu-tions for comparison with the other two solvents.
According to eq 8 a2= b, a dimensionless thermodynamic parameter defined byeq 10from whichγeffcan be calculated. The
results obtained for ln q0 yield the values of q0, a parameter
related througheq 9to the nucleation rate constantKJand the numberNdetof crystallites at the detection point.
The effective interfacial tensionγeffwas evaluated fromeq 10,
usingv0= 0.491 nm3,41
the calculated equilibrium temperatureTe, the shape factor kn = 16π/3 for spherical nuclei, and the
[image:8.625.61.559.214.645.2]Figure 6.Increase in relative critical undercooling with the natural logarithm of the cooling rate. The points represent the data for crystallization of methyl stearate in solution with (top left) 250 g/L dodecane, (top right) 250 g/L kerosene, and (bottom) 192 g/L toluene; the lines illustrate the best fits according toeq 4.
Table 3. Slopes of the Best Linear Fit to Data Points in lnqvs lnucCoordinates and Correlation Coefficients; Values of the Free
Parametersa1,a2, and lnq0Obtained from the Data Fitting in lnqvsucCoordinates According toeq 4and Correlation
Coefficientsa
concn (g/L) slope lnucvs lnq R2b nucl mech a1 a2=b lnq0 q0(K/s) R2c dodecane
200 3.50 0.96 PN 3 7.44×10⁻⁵±4.15×10⁻⁵ 9.29±0.26 10812.30 0.98
250 4.21 0.94 PN 3 2.19×10⁻⁴±8.71×10⁻⁵ 9.35±0.37 11548.60 0.97
300 3.89 0.89 PN 3 1.39×10⁻⁴±1.09×10⁻⁴ 9.54±0.60 13936.82 0.92
350 4.30 0.90 PN 3 3.30×10⁻⁴±1.69×10⁻⁴ 9.10±0.55 8917.04 0.94
kerosene
200 4.92 0.95 PN 3 5.21×10⁻⁴±1.46×10⁻⁴ 8.98±0.37 7967.05 0.97
250 3.65 0.94 PN 3 1.32×10⁻⁴±1.09×10⁻⁴ 8.64±0.42 5639.21 0.95
300 4.22 0.99 PN 3 2.62×10⁻⁴±2.94×10⁻⁵ 8.70±0.09 5998.83 0.99
350 3.92 0.95 PN 3 2.39×10⁻⁴±1.03×10⁻⁴ 8.67±0.33 5847.80 0.97
toluene
154 3.98 0.56 PN 3 1.76×10⁻⁴±4.08×10⁻⁴ 7.94±1.26 2815.71 0.57
192 7.16 0.94 PN 3 6.83×10⁻⁴±2.04×10⁻⁴ 9.59±0.64 14662.96 0.94
231 6.65 0.54 PN 3 7.09×10⁻⁴±8.21×10⁻⁴ 9.38±2.35 11823.57 0.55
269 6.42 0.79 PN 3 5.32×10⁻⁴±3.72×10⁻⁴ 9.38±1.26 11852.21 0.78
aThe errors of the slope and the free parameters refer to the 95% confidence interval.bLinearfitting.cFittingeq 4.
molecular latent heatλof crystallization estimated to be 1.06× 10⁻¹⁹, 1.16×10⁻¹⁹, and 9.94×10⁻²⁰J for methyl stearate
crystal-lizing from dodecane, kerosene, and toluene, respectively. These values were calculated assuming the enthalpy of dissolution obtained from the solubility data can be equated to the enthalpy of crystallization. In addition to this, the critical nucleus radiusr* and numberi*of molecules were obtained fromeqs 21and22, respectively, calculated atuclevels obtained usingTcvalues
corre-sponding to the extrapolation to 0°C/min ofTc(q) lines, at each
of the four concentrations within each solvent system. The results are given inTable 4.
The low values of the effective interfacial tension are an indica-tion of a prevalence of the heterogeneous nucleaindica-tion (HEN) mechanism for the nucleation of the methyl stearate crystallites regardless of the solution environment and are within the same order of magnitude of values reported earlier forn-alkanes.42−45 The number of crystallites formed at the detection pointNdet, at a given crystallization temperature, can be obtained by per-forming a mass balance using the van’t Hoffmodels derived for each solvent system. Thus, using the corresponding values of the mole fraction, the mass of C18:0 per unit volume in solution with the solvent can be obtained by solving the mass parameter in the molar fraction relationship. The mass of C18:0 in the solid phase per unit volume is therefore the difference between the mass of C18:0 in the initial solution and the mass in solution at the corre-sponding crystallization temperature. This value can be converted to volume by dividing the mass of the solute in the solid phase by the corresponding density.
Finally, the number of nuclei per unit volume, i.e.,Ndet, as a
function of solvent and solution concentration can be estimated from dividing the total volume of solid by the volume of a single nucleus. The latter can be obtained using the values of the critical radius assuming spherical nuclei.
Following this, the nucleation rate constantsKJand nucleation ratesJcan be calculated from eqs 9and23respectively using V= 1, the corresponding equilibrium temperatureTe, values of the dimensionless thermodynamic parameterb, and values of the parameter q0 for C18:0 as a function of solvent and concen-tration. A summary of these results is given inTable 4. The trend of these parameters is also shown in Figure S5 of theSI.
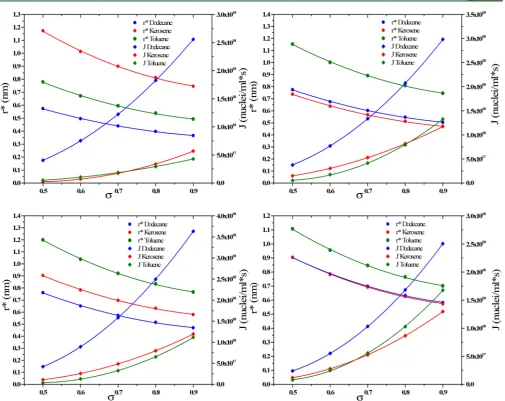
Figure 7provides a comparison of the trend of nucleation rates (J) together with the critical radius (r*) on an iso-supersaturation
basis. r* values were calculated using the interfacial tension obtained for each of the solution concentrations studied at the correspondingσlevels.
4.2.1. Nucleation at the Detection Point.Nucleation rates are observed to be higher in kerosene where the supersaturation levels at which nucleation is detected are greater than in the other two solvents (Table 5). The lowest values of the rates obtained for toluene solvent can be associated with the higher interfacial tensions observed in this case, where theflatter nature of the slopes of theTc(q) lines shows that nucleation proceeds more progressively or is a more thermodynamically controlled process. This is likely to be the result of the highest solubility of C18:0 in toluene which would favor solute−solvent interactions over solute−solute ones. In addition to this, in toluene systems the fraction (xf) of methyl stearate that remains in solution at the corresponding crystallization temperatures is lower in compar-ison to those in the other two solvent systems (Table 4), as crys-tallization occurs at lower temperatures in this case. Thus, given that interfacial tensions are inversely related toxf, higher
resis-tance to nucleation should be expected. In these solutions a
suf-ficient level of supersaturation is then required to overcome the free energy for nucleus formation evidenced in the high levels ofσ, which compares to those observed in kerosene where nucleation rates are at least 1 order of magnitude higher that in toluene.
Given that lower levels of interfacial tensions were observed in kerosene followed by dodecane solutions, it is likely that in these solvents nucleation is controlled, either by the attachment fre-quencyf*or the concentration of nucleation sitesC0. This could indicate that either volume diffusion or interface transfer of building units (molecules) would be rate limiting according to
expressions 24and 25. In the case of kerosene solvent, these conclusions are in line with a higher range ofσat which higherxf
values were observed in comparison to dodecane solutions, allowing for both sufficient driving force nucleation and solute availability in solution that would reduce interfacial tension.
[image:9.625.64.571.98.247.2]Interestingly, although values of interfacial tension similar to those of kerosene systems were obtained in dodecane solutions, the nucleation rates in the latter case were significantly lower by 1 order of magnitude. Given the expected lower strength of both solvent−solvent and solvent−solute intermolecular interaction, due to the nonpolar nature of dodecane molecules, the diffusion of solute molecules should not be rate limiting and therefore
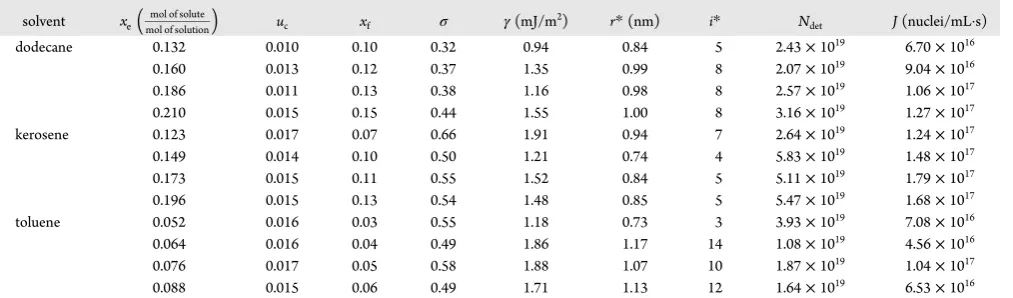
Table 4. Nucleation Kinetics Parameters and Nucleation Rates for Methyl Stearate Crystallizing from Three Different Solvents at Four Different Solution Concentrationsa
solvent xe
(
)
mol of solute
mol of solution uc xf σ γ(mJ/m
2) r*(nm) i* N
det J(nuclei/mL·s)
dodecane 0.132 0.010 0.10 0.32 0.94 0.84 5 2.43×10¹⁹ 6.70×10¹⁶
0.160 0.013 0.12 0.37 1.35 0.99 8 2.07×10¹⁹ 9.04×10¹⁶
0.186 0.011 0.13 0.38 1.16 0.98 8 2.57×10¹⁹ 1.06×10¹⁷
0.210 0.015 0.15 0.44 1.55 1.00 8 3.16×10¹⁹ 1.27×10¹⁷
kerosene 0.123 0.017 0.07 0.66 1.91 0.94 7 2.64×10¹⁹ 1.24×10¹⁷
0.149 0.014 0.10 0.50 1.21 0.74 4 5.83×10¹⁹ 1.48×10¹⁷
0.173 0.015 0.11 0.55 1.52 0.84 5 5.11×10¹⁹ 1.79×10¹⁷
0.196 0.015 0.13 0.54 1.48 0.85 5 5.47×10¹⁹ 1.68×10¹⁷
toluene 0.052 0.016 0.03 0.55 1.18 0.73 3 3.93×10¹⁹ 7.08×10¹⁶
0.064 0.016 0.04 0.49 1.86 1.17 14 1.08×10¹⁹ 4.56×10¹⁶
0.076 0.017 0.05 0.58 1.88 1.07 10 1.87×10¹⁹ 1.04×10¹⁷
0.088 0.015 0.06 0.49 1.71 1.13 12 1.64×10¹⁹ 6.53×10¹⁶
aThe critical radius, number of crystals at the detection point, and nucleation rates are calculated atu
ccorresponding toTcvalues obtained by the
extrapolation to 0°C/min of (Tc(q)) lines.xeis the equilibrium solubility,ucis the relative critical undercooling,xfis the fraction of methyl stearate
sufficient levels of attachment frequency should be possible to reach. Based on these observations and accounting for the defi ni-tion of nucleani-tion rate given byeq 23, it is likely that in these systems nucleation rates are then hindered by the availability of nucleation sitesC0, due to the lower solubility of methyl steareate
in dodecane that would allow a lower amount of solute per unit volume.
4.2.2. Nucleation at the Same Levels of Supersaturation (σ).
If the analysis is performed comparing nucleation parameters at equal levels of solution supersaturation (Figure 7), nucleation rates are higher in dodecane followed by kerosene and toluene solvent. The differences between dodecane and both kerosene and toluene solution rates increase with an increase inσup to even 1 order of magnitude at supersaturations higher than 80%. In general, the critical nucleus radius is higher in toluene followed by kerosene and dodecane solutions, although this trend changes at the lowest and highest solution concentrations studied in which kerosene solutions show the highest and lowest values of this parameter, respectively.
Given that the critical nucleus radius is directly related to inter-facial tension, these observations confirm that interfacial tensions are rate limiting in toluene solvent over all the range of supersatu-rations chosen. Interfacial tensions in kerosene are closer in mag-nitude to those observed in dodecane solvent, while delivering
nucleation rates closer in magnitude to those observed in toluene solutions. The latter complement the discussion presented in
section 4.2.1in the sense that this effect could be associated with the complex composition of kerosene, which is comprised of molecules of different types including paraffins, cycloalkanes, and aromatics, that could hinder the diffusion processes associated with molecular attachment into the nucleus and therefore decrease the attachment frequency (f*).
Interfacial tensions were observed to be the highest in kerosene at the lowest solution concentration becoming closer to those observed in dodecane and below those of toluene solutions as solution concentration increases. This could be associated with an increase in the thermodynamic barrier to nucleation at lower concentrations where solute−solvent interactions would be favored. In the case of dodecane solutions the lowest values of inter-facial tensions are in line with a more kinetically controlled pro-cess as discussed insection 4.2.1. The lower values of this param-eter can be associated with the lower solubility of C18:0 in dodecane that favor solute−solute interactions. Likewise, attachment fre-quencies should be favored by an easy desolvation process due to the low solute−solvent strength interactions indicating that nucleation is likely to be hindered by the low values ofC0.
[image:10.625.61.567.58.459.2]The differences in the tendency observed when nucleation is analyzed at the detection points in comparison to the sameσ Figure 7.Tendency of critical radius (r*) and nucleation rates (J) as a function of supersaturation (σ) for C18:0 growing from dodecane, kerosene, and toluene solvents using parameters derived for the range of concentrations studied. Concentration increases from left to right and from top to bottom.
levels suggests that the complex composition of kerosene solvent significantly influences the nucleation process. In this case the roles of thermodynamics and kinetics are more interconnected due to the different types of intermolecular interactions that would affect desolvation and diffusion process as well as solubility.
A summary of the obtained solubility and nucleation kinetics parameters as well as some conclusions related to each section are given inTable 5.
5. CONCLUSIONS
The solubility and nucleation of methyl stearate crystallizing from dodecane, kerosene, and toluene were studied. Solutions of C18:0 in all cases show lower solubility than that of an ideal solution with the highest solubility obtained in toluene followed by kerosene and dodecane solvents. The analysis showed in all cases a progressive nucleation mechanism and crystallite inter-facial tension (γeff) values between 0.94 and 1.55 mJ/m2, between
1.21 and 1.52 mJ/m2, and between 1.18 and 1.88 mJ/m2for methyl stearate crystallizing from dodecane, kerosene, and toluene, respectively. Nucleation rates calculated using the obtained values ofγeff and the number of crystals at the detection point (Ndet) ranged between 4.56×10¹⁶and 1.79×10¹⁷nuclei/mL·s, with the highest rates predicted for methyl stearate crystallizing from kerosene solutions. This trend changes when the analysis is per-formed at the sameσlevels where nucleation rates were the highest in dodecane solvent. This is effect is thought to be due to the com-plex nature of kerosene in which the interplay between desolvation, diffusion process, and solubility plays a more important role.
■
ASSOCIATED CONTENT*
S Supporting InformationThe Supporting Information is available free of charge on theACS Publications websiteat DOI:10.1021/acs.energyfuels.7b03212.
Comparative schemes for the isothermal or polythermal method based on a concentration vs temperature profile (section 1), full derivation of the set of expressions that comprise the KBHR approach (section 2), kerosene n-alkane chain length distribution (section 3), temperature calibration lines for the Crystal 16 unit (section 4),
flowchart describing how to apply the KBHR approach for the analysis of nucleation kinetics from polythermal experimental data (section 5), experimental crystallization Tc and dissolution Tdiss temperatures as a function of cooling rate q (section 6), and comparative figures of nucleation kinetics parameters for methyl stearate crys-tallizing from dodecane, kerosene, and toluene solvents at experimental crystallization temperatures (section 7) (PDF) The research data supporting this publication can be accessed at:https://doi.org/10.5518/336.
■
AUTHOR INFORMATIONCorresponding Author
*E-mail:[email protected].
ORCID
Diana M. Camacho:0000-0001-5330-4110 Present Address
§K.L.: Lewtas Science & Technologies Ltd., Oxford, OX2 7DY, U.K.
Notes
The authors declare no competingfinancial interest.
Table 5. Summary of Parameters Obtained through the Combined Assessment of Solubility and Nucleation Kinetics of Methyl Stearate in Three Di ff erent Solvents a, b assessed criteria assessed parameters dodecane kerosene toluene conclusion solubility solubility level lowest intermediate higher All systems behave less than ideal as activities are higher than 1. However, higher values in dodecane followed by kerosene solutions indicate either solute − solute or solvent − solvent interactions are favored in these systems. Solute − solvent interactions are similar to those of solute − solute in toluene solutions with activities close to 1; this is further supported by the lowest enthalpy of mixing. The highest values of both enthalpy of dissolution and mixing in kerosene solution evidence strong dependence of activities on temperature. Υ (20 ° C) 2.01 1.85 1.14 Δ Hdiss (kJ/mol) 63.55 69.81 59.84 Δ Sdiss (kJ/mol · K) 0.20 0.22 0.19 Δ Hmix (kJ/mol) 9.61 15.87 5.90 Δ Smix (kJ/mol · K) 0.03 0.05 0.02 nucleation σ range 0.32 − 0.44 0.50 − 0.66 0.49 − 0.58 Relatively higher values of interfacial tensions in toluene seem to hinder nucleation in this solvent. Although interfacial tension values are close in dodecane and kerosene solutions, nucleation in the former is 1 order of magnitude lower. This could indicate less available nucleation sites in these solutions, due to the low solubility of methyl stearate in dodecane. γ (mJ/m 2) range 0.94 − 1.55 1.21 − 1.52 1.18 − 1.88 r * (nm) range 0.84 − 1.00 0.74 − 0.94 0.73 − 1.17 J (nuclei/mL · s) range 6.70 × 10 16− 1.27 × 10 17 (1.24 − 1.79) × 10 17 4.56 × 10 16− 1.04 × 10 17 a Υ is the activity coe ffi cient; Δ Hdiss and Δ Sdiss are the enthalpy and entropy of dissolution, respectively; Δ Hmix and Δ Smix are the enthalpy and entropy of mixing, respectively; γ is the interfacial tension; r * is the nucleus critical radius; and J is the nucleation rate. b These results are presented together with those obtained for the assessment of morphology and crystal growth kinetics, for the same solutions ’ systems, in ref 46 .
■
ACKNOWLEDGMENTSThe authors gratefully acknowledge Infineum Ltd. for the funding of this research which forms part of the doctoral studies of one of us (D.M.C.). We also gratefully acknowledge the U.K.’s EPSRC for the support of nucleation and crystal growth research at Leeds and Manchester through funding the Critical Mass Project: Molecules, Clusters and Crystals (Grants EP/IO14446/1 and EP/IO13563/1). The research on the analysis of nucleation data using the polythermal method was inspired by Prof. Dimo Kashchiev (Institute of Physical Chemistry, Bulgarian Academy of Sciences) during his sabbatical leave in Leeds (Leverhulme Trust, Grant F10100A). We are most grateful to him for his insightful contribution to this research area.
■
NOMENCLATURESymbols
a= dimensionless molecular latent heat of crystallization ac= solution activity
A*= surface area of nucleus (m2)
b= dimensionless thermodynamic parameter Cnuc* = equilibrium nucleus concentration (m−3)
C0 = concentration of nucleation sites or instantaneously
nucleated crystallites (m−3)
f*= attachment frequency of monomers to the nucleus J= nucleation rate (m−3s−1)
KJ= nucleation rate constant (m−3s−1) kn= nucleus numerical shape factor n= crystallite growth exponent Ndet= detectable number of crystallites q= cooling rate (K s−1)
q0 = parameter in uc(q) dependence for both PN and IN (K s−1)
Q= parameter ineq19,related toq0 T= solution temperature (K) Tc= crystallization temperature (K)
Tdiss= equilibrium dissolution temperature (K)
Te= solution saturation (or equilibrium) temperature (K)
ΔTc= critical undercooling for crystallization (K)
v0= volume of solute molecule in crystal (m3)
V= volume of solution (m3)
x= mole fraction of solute in solution xe= equilibrium mole fraction
xideal= ideal equilibrium mole fraction X1= concentration of colliding building units
Z= Zeldovich factor
ΔHm= molal enthalpy of melting (J mol−1) ΔSm= molal entropy of melting (J mol−1K−1) ΔHdiss= molal enthalpy of dissolution (J mol−1) ΔSdiss= molal entropy of dissolution (J mol−1K−1) ΔHmix= molal enthalpy of mixing (J mol−1) ΔSmix= molal entropy of mixing (J mol−1K−1)
i*= number of molecules in critical nucleus r*= critical nucleus radius (m)
σ= relative supersaturation
σcrit= critical relative supersaturation
uc= relative critical undercooling for crystallization Υ= activity coefficient
γeff= effective interfacial tension of crystal nucleus in 3D HEN
(mJ m−2)
λ= molecular latent heat of crystallization (J) ρ= density
ξ= sticking coefficient
ω= positive number inexpression19
ω*= transfer frequency of building units from adsorbed to integrated
Abbreviations
HEN = heterogeneous nucleation HON = homogeneous nucleation IN = instantaneous nucleation
KBHR = Kashchiev−Borissova−Hammond−Roberts MSZW = metastable zone width
PN = progressive nucleation SD = standard deviation 3D = three-dimensional
■
REFERENCES(1) Kashchiev, D.; Borissova, A.; Hammond, R. B.; Roberts, K. J. Dependence of the critical undercooling for crystallization on the cooling rate.J. Phys. Chem. B2010,114, 5441−5446.
(2) Kashchiev, D.; Borissova, A.; Hammond, R. B.; Roberts, K. J. Effect of cooling rate on the critical undercooling for crystallization.J. Cryst. Growth2010,312, 698−704.
(3) Camacho, D.; Borissova, A.; Hammond, R.; Kashchiev, D.; Roberts, K.; Lewtas, K.; More, I. Nucleation mechanism and kinetics from the analysis of polythermal crystallisation data: methyl stearate from kerosene solutions.CrystEngComm2014,16, 974−991.
(4) Rubbo, M.; Sherwood, J. N. An Improved Method for the Measurement of the Rates of Growth and Dissolution of Crystals Under Isothermal Conditions.J. Cryst. Growth1983,61, 210−214.
(5) Boistelle, R.; Madsen, H. E. L. Calculation of the adsorption energies of n-alkane molecules on the (001) face of crystals of long-chain even n-alkanes.J. Cryst. Growth1978,43, 141−147.
(6) Simon, B.; Grassi, A.; Boistelle, R. Cinétique de Croissance de la Face (110) de la Paraffine C36H74en Solution.J. Cryst. Growth1974,26,
77−89.
(7) Rubbo, M.; Boistelle, R. Dissolution and Growth-Kinetics of the (001) Faces of Normal-Hexatriacontane Crystals Grown from Heptane.
J. Cryst. Growth1981,51, 480−488.
(8) Lundagermadsen, H. E.; Boistelle, R. Growth-Kinetics of the (001) Faces of Hexatriacontane (C36H74) in Solution.J. Cryst. Growth1979, 46, 681−690.
(9) Beckmann, W.; Boistelle, R. Growth Kinetics of the (110) Face of Stearic Acid Growing from Butanone Solutions_Pure Solutions and in the Presence of an Emulsifier.J. Cryst. Growth1985,72, 621−630.
(10) Boistelle, R.; Aquilano, D. Interaction Energy and Growth Mechanisms on Twinned and Polytypic Crystals of Long-Chain Even Normal-Alkanes. I. Interaction-Energy Calculations. Acta Crystallogr., Sect. A: Cryst. Phys., Diffr., Theor. Gen. Crystallogr.1977,33, 642−648.
(11) Boistelle, R.; Simon, B.; Pepe, G. Polytypic Structures of n-C28H58
(Octacosane) and n-C36H74(Hexatriacontane).Acta Crystallogr., Sect. B: Struct. Crystallogr. Cryst. Chem.1976,32, 1240−1243.
(12) Boistelle, R.; Madsen, H. E. L. Solubility of Long-Chain N-Alkanes in Petroleum Ether.J. Chem. Eng. Data1978,23, 28−29.
(13) Madsen, H. E. L.; Boistelle, R. Solubility of long-chain n-paraffins in pentane and heptane.J. Chem. Soc., Faraday Trans. 11976,72, 1078− 1081.
(14) Madsen, H. E. L.; Boistelle, R. Solubility of Octacosane and Hexatriacontane in Different Normal-Alkane Solvents.J. Chem. Soc., Faraday Trans. 11979,75, 1254−1258.
(15) Boistelle, R.; Doussoulin, A. Spiral Growth Mechanisms of (110) Faces of Octacosane Crystals in Solution.J. Cryst. Growth1976,33, 335−352.
(16) Soriano, N. U., Jr.; Migo, V. P.; Sato, K.; Matsumura, M., Jr. Crystallization behavior of neat biodiesel and biodiesel treated with ozonized vegetable oil.Eur. J. Lipid Sci. Technol.2005,107, 689−696.
(17) Boshui, C.; Yuqiu, S.; Jianhua, F.; Jiu, W.; Jiang, W. Effect of Cold Flow Improvers on Flow Properties of Soybean Biodiesel. Biomass Bioenergy2010,34, 1309−1313.
(18) Odeigah, E.; Janius, R. B.; Yunus, R. Factors Affecting the Cold Flow Behaviour of Biodiesel and Methods for Improvement - A Review.
Pertanika J. Sci. Technol.2012,20(1), 1−14.
(19) Dunn, R. O.; Shockley, M. W.; Bagby, M. O. Improving the Low Temperature Properties of Alternative Diesel Fuels: Vegetable Oil-Derived Methyl Esters.J. Am. Oil Chem. Soc.1996,73, 1719−1728.
(20) Coutinho, J. A. P.; Knudsen, K.; Andersen, S. I.; Stenby, E. H. A local composition model for paraffinic solid solutions,.Chem. Eng. Sci. 1996,51, 3273−3282.
(21) Coutinho, J. A. P.; Mirante, F.; Pauly, J. A new predictive UNIQUAC for modeling of wax formation in hydrocarbon fluids,.Fluid Phase Equilib.2006,247, 8−17.
(22) Coutinho, J. A. P.; Dauphin, C.; Daridon, J. L. Measurements and modelling of wax formation in diesel fuels.Fuel2000,79, 607−616.
(23) Pauly, J.; Daridon, J. L.; Sansot, J. M.; Coutinho, J. A. P. The pressure effect on the wax formation in diesel fuel,.Fuel2003,82, 595− 601.
(24) Lopes, J. C. A.; Boros, L.; Krahenbuhl, M. A.; Meirelles, A. J. A.; Daridon, J. L.; Pauly, J.; Marrucho, I. M.; Coutinho, A. P. Prediction of Cloud Points of Biodiesel.Energy Fuels2008,22, 747−752.
(25) Coutinho, J. A. P.; Gonc-alves, M.; Pratas, M. J.; Batista, M. L. S.; Fernandes, V. F. S.; Pauly, J.; Daridon, J. L. Measurement and modeling of biodiesel cold-flow properties.Energy Fuels2010,24, 2667−2674.
(26) Prausnitz, J. M. Molecular Thermodynamics of Fluid-Phase
Equilibria; Prentice-Hall Inc.: Englewood Cliffs, NJ, 1969.
(27) Jiang, S.; ter Horst, J. H. Crystal nucleation rates from probability distributions of inductions times.Cryst. Growth Des.2011,11, 256−261. (28) Xiao, Y.; Tang, S. K.; Hao, H.; Davey, R.; Vetter, T. Quantifying the inherent uncertainty associated with nucleation rates estimated from induction time data measured in small volumes.Cryst. Growth Des.2017,
17, 2852−2863.
(29) Nyvlt, J. Kinetics of nucleation in solutions.J. Cryst. Growth1968,
3−4, 377−383.
(30) Nyvlt, J.; Rychly, R.; Gottfried, J.; Wurzelova, J. Metastable Zone Width of Some Aqueous Solutions.J. Cryst. Growth1970,6, 151−162. (31) Kubota, N. A new interpretation of metastable zone widths measured for unseeded solutions,.J. Cryst. Growth2008,310, 629−634. (32) Sangwal, K. A novel self-consistent Nyvlt-like equation for metastable zone width determined by the polythermal method.Cryst. Res. Technol.2009,44, 231−247.
(33) Sangwal, K. Recent developments in understanding of the metastable zone width of different solute-solvent systems. J. Cryst. Growth2011,318, 103−109.
(34) Mitchell, N. A.; Frawley, P. J. Nucleation kinetics of paracetamol− ethanol solutions from metastable zone widths.J. Cryst. Growth2010,
312, 2740−2746.
(35) Blackmond, D. G. Reaction progress kinetics analysis: a powerful methodology for mechanistic studies of complex catalytic reactions.
Angew. Chem., Int. Ed.2005,44, 4302−4320.
(36) Kashchiev, D.; Firoozabadi, A. Induction time in crystallisation of gas hydrates.J. Cryst. Growth2003,250, 499−515.
(37) Kashchiev, D. Nucleation: Basic Theory with Applications; Butterworth-Heinemann: Oxford, U.K., 2000.
(38) Hussain, Q. Crystallisation of Long Chain Methyl Esters in Relation to Their Cold Flow behaviour. Ph.D. Thesis, School of Process Environmental and Materials Engineering, University of Leeds, Leeds, U.K., 2012.
(39) Scheepers, J. J.; Muzenda, E.; Belaid, M. Influence of structure on fatty acid ester-alkane interactions.International Conference on Chemical Engineering and Its Applications; International Association of Engineers: 2012; pp 93−102.
(40) Scheepers, J. J.; Muzenda, E.; Belaid, M. Influence of temperature and molecular structure on organics-biodiesel interactions using group contribution methods. Proceedings - World Congress on Engineering; Newswood Ltd.: 2012; Vol.III.
(41) MacGillavry, C. H.; Wolthuis-Spuy, M. Crystal Structure of an Orthorhombic Modification of Methyl Stearate.Acta Crystallogr., Sect. B: Struct. Crystallogr. Cryst. Chem.1970,26, 645−648.
(42) Turnbull, D.; Cormia, R. L. Kinetics of crystal nucleation in some normal alkanes liquids.J. Chem. Phys.1961,34, 820−831.
(43) Roberts, K. J.; Sherwood, J. N.; Stewart, A. The Nucleation of n-Eicosane Crystals from Solutions in n-Dodecane in the Presence of Homologous Impurities,.J. Cryst. Growth1990,102, 419−426.
(44) Gerson, A. R.; Roberts, K. J.; Sherwood, J. N. An Instrument for the Examination of Nucleation from Solution and its Application to the Study of Precipitation from Diesel Fuels and Solutions of Normal-Alkanes.Powder Technol.1991,65, 243−249.
(45) Chen, B. D.; Brecevic, L. J.; Garside, J. Nucleation of tetracosane in hydrocarbon solvents.12th Symposium on Industrial Crystallisation; European Federation of Chemical Engineering: 1993; Vol.2, pp 59−64. (46) Camacho, D. M.; Roberts, K. J.; Muller, F.; Thomas, D.; More, I.; Lewtas, K. Morphology and growth of methyl stearate as a function of crystallization environment.Cryst. Growth Des.2017,17, 563−575.