This is a repository copy of Downdating high-resolution population density maps using sealed surface cover time series.
White Rose Research Online URL for this paper: http://eprints.whiterose.ac.uk/124179/
Version: Accepted Version
Article:
Crols, T orcid.org/0000-0002-9379-7770, Vanderhaegen, S, Canters, F et al. (4 more authors) (2017) Downdating high-resolution population density maps using sealed surface cover time series. Landscape and Urban Planning, 160. pp. 96-106. ISSN 0169-2046 https://doi.org/10.1016/j.landurbplan.2016.12.009
© 2016 Elsevier B.V. This manuscript version is made available under the CC-BY-NC-ND 4.0 license http://creativecommons.org/licenses/by-nc-nd/4.0/
[email protected] https://eprints.whiterose.ac.uk/
Reuse
Items deposited in White Rose Research Online are protected by copyright, with all rights reserved unless indicated otherwise. They may be downloaded and/or printed for private study, or other acts as permitted by national copyright laws. The publisher or other rights holders may allow further reproduction and re-use of the full text version. This is indicated by the licence information on the White Rose Research Online record for the item.
Takedown
If you consider content in White Rose Research Online to be in breach of UK law, please notify us by
Downdating high-resolution population density maps using sealed surface cover time series
Tomas CROLSa,b,*, Sven VANDERHAEGENa, Frank CANTERSa, Guy ENGELENb, Lien
POELMANSb, Inge ULJEEb, Roger WHITEc
a Cartography and GIS Research Group, Department of Geography, Vrije Universiteit Brussel,
Brussels, Belgium. [email protected]; [email protected]; [email protected]
b Environmental Modelling Unit, VITO – Flemish Institute for Technological Research, Mol,
Belgium. [email protected]; [email protected]; [email protected]
c Department of Geography, Memorial University of Newfoundland, St. John’s, NL, Canada.
*Corresponding author. Address: Vrije Universiteit Brussel, Department of Geography,
Pleinlaan 2, 1050 Brussel, Belgium. Phone: +3214336758 or +3226293384. E-mail:
Link to published version
This is an Accepted Manuscript of an article published by Elsevier in Landscape and Urban
Planning. DOI: 10.1016/j.landurbplan.2016.12.009
https://doi.org/10.1016/j.landurbplan.2016.12.009
Copyright statement
© 2017. This manuscript version is made available under the CC-BY-NC-ND 4.0
Keywords: Urban sprawl; Population growth; Sealed surfaces; Land-use modelling; Historical
calibration; Densification
Research highlights
We propose an approach for downdating population maps using sealed surface data.
We apply the method to Flanders, which is among the most sprawled regions in Europe.
Population density increased in urban areas, while in rural areas sprawl is ongoing.
Abstract
Many countries in Europe and North America see their natural and agricultural
landscapes being replaced by a fragmented, sprawled landscape. Spatially detailed modelling of
changes in land use, population and transport could help to forecast the impact of scenarios
aimed at mitigating the process of urban sprawl. A common problem with land-use change
models however, is the lack of historical data for proper model calibration. In this paper we
describe an approach for developing historical population density maps by downdating a recent
high-resolution population density raster, using a time series of sealed surface data and historical
census data as an input. In the proposed approach, we hypothesise a local relationship between
increasing population densities and increasing sealed surface fraction estimates, the latter
obtained from remote sensing imagery. We apply the method to Flanders, Belgium, a region
where population growth and improved transport networks led to a diffuse urban expansion, with
ribbon development along many roads and a strong fragmentation of open space. The resulting
population and sealed surface maps provide interesting data on the urban sprawl phenomenon in
the past decades. By computing a densification index we observe that most urban areas witness a
recent population density increase while in several rural areas the built-up area per inhabitant is
still growing. The downdated time series of population maps obtained in this study will be used
to set up a historical calibration for an activity-based cellular automata model for Flanders and
Brussels which, among other data, needs high-resolution population maps.
1. Introduction
Many environmental problems worldwide arise from the ever growing area on Earth
occupied by human activities. This urban growth often manifests itself in the form of urban
2006; Ravetz, Fertner, & Nielsen, 2013). The main causes of urban sprawl are a growing
population, increased income and new fast transportation networks with decreased travel costs
(Anas, Arnott, & Small, 1998; Brueckner, 2000; European Environment Agency, 2006). Other
important forces leading to the diffuse growth of urban areas are economies and diseconomies of
agglomeration (Richardsson, 1995): while a concentration of population and companies produces
advantages of proximity, a too high concentration of activity in a single location can also lead to
high land prices, increasing traffic congestion and environmental pollution. Extended
transportation networks and diseconomies of agglomeration can both lead to a growth of
suburban housing and employment. This, in turn, causes new health concerns (Jackson, 2003)
and environmental problems due to high commuting distances and related congestion (Camagni,
Gibelli, & Rigamonti, 2002), increased energy consumption (Newman & Kenworthy, 1989), and
altered natural landscapes and loss of valuable agricultural land (Antrop, 2000). In recent times
the average home-to-work travel distance has grown significantly (Boussauw, Derudder, &
Witlox, 2011). For many reasons residential location choices are often determined by more than
the current job location: two-worker households need housing in between both jobs, job
uncertainty plays a major role, and moving costs can be substantial (Anas, Arnott, & Small,
1998; Crane, 1996). In the US, job accessibility has become less important for land prices since
non-work travel for social interactions has increased (Giuliano, Gordon, Pan, & Park, 2010).
Owning a suburban house is therefore often perceived as an ‘ideal’ living location (Batty,
Besussi, & Chin, 2003). Recently, however, a number of cities and regions in both North
America and Europe have started to recognise the need for more compact urban forms (Dieleman
To gain a spatially differentiated insight in the future evolution of urban land use and the
associated population growth or decline, land-use change modelling could be beneficial. Several
land-use change models have been developed over the years to simulate the spatial evolution of
the urban sprawl phenomenon (Haase & Schwarz, 2009; Poelmans & Van Rompaey, 2010). One
particularly successful type of highly-detailed raster based models are cellular automata (CA)
(Santé, Garcia, Miranda, & Crecente, 2010). Thanks to their high resolution and regular
structure, they fully integrate spatial input data and are computationally efficient for large
regions. In the constrained cellular automata model of White, Engelen, and Uljee (1997), which
has been widely used (e.g. Barredo, Kasanko, McCormick, & Lavalle, 2003), the neighbourhood
rules are the core of the CA land-use dynamics. For each cell, they weigh the influences exerted
by the land uses present in a given neighbourhood of the cell to determine its future land use. A
historical calibration strategy is necessary to obtain reliable parameter estimates for this model.
Efforts have been made to develop automatic calibration algorithms for the CA neighbourhood
rules (Straatman, White, & Engelen, 2004; van der Kwast et al., 2012). An important problem,
though, is the lack of consistent historical land-use data to serve as input for the calibration
(Engelen & White, 2007). The CA model has many applications since it also deals with regional
interactions between population and economic forces in its regional component. Recently, some
publications have proposed an integration of the population and the economic data within the CA
structure itself by using an activity-based approach (Crols et al., 2015; van Vliet, Hurkens,
White, & van Delden, 2012; White, 2006; White, Uljee, & Engelen, 2012). This implies that for
calibration, next to historical land-use maps, also detailed maps of population and employment
The development of a time series of regional land-use maps is a time consuming task, and
existing series are often produced with inconsistent methodologies (van der Kwast et al., 2009;
Van de Voorde et al., 2016). Remote sensing imagery can be a useful data source to build
consistent land-use time series for recent decades. Spectral unmixing of medium-resolution
images, available since the 70s, enables the mapping of sealed surfaces, which are an indicator of
urbanised land uses (Vanderhaegen, De Munter, & Canters, 2015; Van de Voorde, De Roeck, &
Canters, 2009; Weng, 2012; Wu, 2004). Van de Voorde, Jacquet, and Canters (2011) used a
spectral unmixing technique to produce sealed surface maps from Landsat TM/ETM+ data, and
to use these maps for distinguishing urban from non-urban land use, and even residential from
non-residential urban land uses by computing spatial metrics on pixel-based sealed surface
fractions for each urban block. A thematically more detailed mapping of land use though, as is
often required for historical calibration of land-use models, cannot be achieved with this
approach.
A possibility to obtain historical land-use maps with a higher number of urban classes is
to start with present land-use information, and then move progressively back in time by defining
a downdating procedure, using remote sensing data available for previous time steps to downdate
the most recent map. Using this approach, Fricke and Wolff (2002) succeeded in building a
land-use series for the agglomeration of Brussels ranging from 1955 until 1997. All land-land-use maps
they produced involved manual interpretation of orthophotos or aerial photos and topographical
maps. For the 1997 map, which formed the basis for downdating, extra information out of
satellite remote sensing and a GIS database was used. The procedure involves much manual
work, and hence is not feasible for application to larger regions. Nevertheless, downdating a
interesting idea, if image interpretation for previous time steps can be automated. Time-series of
sealed surface maps obtained through spectral unmixing seem promising for developing such a
strategy.
In a similar way, sealed surface time-series seem also an interesting data source for
downdating population maps. High-resolution population density maps are mostly constructed
using dasymetric mapping approaches, which model population distribution within census units
based on spatially detailed ancillary data explaining differences in population density (Wu, Qiu,
& Wang, 2005). Often use is made of multiple regression analysis, with population as the
dependent variable and land-use data as one of the independent variables (e.g. Eicher & Brewer,
2001; Gallego, Batista, Rocha, & Mubareka, 2011; Langford, Maguire, & Unwin, 1991; Mennis,
2003). Stevens, Goughan, Linard, and Tatem (2015) proposed nonparametric modelling to
include a large set of land cover and other spatial variables. Several publications confirm that
population density within a certain land use and census unit is related to sealed surface cover
(Batista e Silva, Gallego, & Lavalle, 2013; Lu, Weng, & Li, 2006; Wu & Murray, 2007;
Zandbergen & Ignizio, 2010). If available, information on the building type in parcels (Jia, Qiu,
& Goughan, 2014; Xie, 2006) or in land-use polygons (Goerlich & Cantarino, 2013) can
improve the results, and can be combined with land cover data such as sealed surface cover (Jia
& Goughan, 2016). Recently, the number of address points within a land use and census unit was
suggested as the most accurate factor to compute high-resolution population density maps
(Cockx & Canters, 2015; Tapp, 2010). Alternatively, nighttime mobile phone data can be used to
downscale population maps (Deville et al., 2014) or to update existing outdated population maps
are generally not available for the past. Hence, in the absence of address data, sealed surface
cover can be considered the best option for estimating population density (Zandbergen, 2011).
We recently defined a workflow for downdating both land use and population maps using
time series of sealed surface maps for the Flanders-Brussels region, to be used as an input for the
historical calibration of the activity-based land-use model developed by White, Uljee and
Engelen (2012) and Crols et al. (2015). Downdating of land-use data using sealed surface cover
as ancillary data has proven to be a complex and partially ad hoc process which we do not intend
to discuss in detail in this publication. The downdating of population though is more generic and
has proven useful for documenting the phenomenon of urban sprawl. Therefore, in this paper we
focus on the latter. Starting from a recent high-resolution population map, and using remote
sensing derived sealed surface data and statistical population data for previous time steps, we
demonstrate the downdating method proposed by applying it to the Flanders-Brussels region.
The analysis focuses on the years 1986, 2001, and 2013. As such, the development of the
population time series, in combination with the sealed surface data for each time step enables us
to analyse in detail the last stage of the urban flight of the late 20th century in the region, the 21st
century revival of the regional cities, and the still declining population density of new built-up
areas around these cities.
2. Methods
2.1 Study area and land use
The northern half of Belgium, i.e. Flanders, the Brussels Capital Region and the north of
Wallonia, is a region with one of the highest proportions of built-up surfaces and fragmented
landscapes in Europe, with extensive urban sprawl and ribbon development with mixed urban
finds its origin in two 19th century government policies decided when Belgian cities were
rapidly industrialising but the political elite wanted to inhibit massive migration from the rural
population to the cities in order to avoid social unrest and health problems (De Decker, 2008).
Firstly, a dense light railway network was built to enable fast and cheap travel from rural areas to
the city (De Block & Polasky, 2011). Secondly, home ownership was promoted with beneficial
tax policies for mortgages. Frequent moving is discouraged by high transaction costs, and has
gradually become almost exceptional in a society where almost everybody has become used to
owning a suburban house with a large garden, close to several cities and job possibilities (Meeus
& De Decker, 2015). In 2013, 70% of the Flemish population lived in a unit they owned, and
85% of these units were single-family dwellings (Winters et al., 2015). From 1970 till 2000 there
was still an ongoing ‘urban flight’ in Belgian cities with a declining urban population, while the
rate of suburban population growth did not fall (Hertogen, 2013). At first sight, the Flemish cities
and Brussels seem to have regained their attractiveness after the year 2000 due to improved
spatial policies and urban revitalisation projects, yet the total picture is more complex since the
main reason for urban population growth is external migration (De Decker, 2011).
Flanders has a relatively high population considering its size (6,381,859 inhabitants in
2013, or 472 per km²). The Brussels Capital Region (BCR), a territory of only 161.38 km²,
forms an enclave in Flanders (Figure 1). With a population of 1,154,635 inhabitants in 2013
(data of the Belgian Federal Department of Economics), it has a density of 7155 inhabitants/km².
Just outside the BCR, the population density rapidly falls: in comparison with other large
European capitals, Brussels has one of the highest densities in the core but one of the lowest in
According to the 10 m resolution land-use map of the Flemish Institute for Technological
Research (VITO) of 2013 used in this study (Figure 1, Tables 1 and 2), the 13,522 km² of the
Flemish Region consist of 27.6% of built-up land uses, while the Brussels Capital Region
contains 69.3% built-up land uses. Not all sources agree on the amount of built-up surfaces. The
Cadastre of Belgium reports only 20.1% of built-up registered parcels for Flanders and 58.6% for
the BCR in 2013 (FOD Economie, 2015) (Table 2). The big differences can be attributed to other
land-use definitions: in the Cadastre, infrastructure and unbuilt parts of industrial and
commercial terrains are regarded as unbuilt.
2.2 Sealed surface fraction mapping
This study uses sealed surface fraction estimates for Flanders and Brussels for the years
1987 (as a proxy for 1986), 2001 and 2013, produced from a time series of medium-resolution
Landsat imagery at 30 m resolution by applying a sub-pixel mapping approach, as described in
Vanderhaegen, De Munter, and Canters (2015). In this approach, the sealed surface fraction
within each pixel that is part of the urban area is assumed to be the complement of the vegetation
fraction. Therefore, the first step in the mapping is to determine an urban mask for each date
delineating the urbanised area. The mask for 2013 was defined based on large-scale reference
data sets of Flanders (GRB Vlaanderen) and Brussels (UrbIS), combined with the 10 m
resolution land-use map of VITO. The masks for previous years were considered to be subsets of
the 2013 mask. The Normalised Difference Vegetation Index (NDVI: see e.g. Mather, 2004) was
used to exclude pixels fully covered by vegetation for each year. Based on four high-resolution
IKONOS images (4 m resolution) covering part of the study area, a detailed mapping of
vegetation cover was accomplished. Based on this detailed mapping, the vegetation fraction of
regression model was built with known vegetation fraction, derived from the IKONOS images as
the dependent variable, and the Landsat NDVI value as independent variable:
(1)
with VFi the reference vegetation fraction in pixel i, a0the model’s intercept, aN the regression
coefficient for the NDVI, NDVIi the NDVI value of pixel i, and i the residual for pixel i.
Multiple linear regression with Landsat spectral band values as extra independent variables did
not improve the model’s outcome, hence the model with NDVI as the sole variable was applied
to estimate the vegetation fraction for each Landsat pixel within the urban mask. Finally, as
indicated above, the sealed surface fraction SSF was defined as the complement of VF:
(2)
To produce a temporally consistent SSF series and correct for errors due to uncertainty in
the estimation procedure, the SSF value of a pixel for a later time step was defined to be
minimally the value of the previous step. As such, the sealed surface cover is assumed to only
increase over time, which can be expected to be true for almost the entire study area. For a full
description and discussion of the technique used, the reader is referred to Vanderhaegen and
Canters (2016).
2.3 High-resolution mapping of population density for 2013
For each first day of the year, there exist population data made available by the Federal
Department of Economics at the municipality level, and for certain years also at the more
detailed level of statistical sectors. Flanders and the BCR include 327 municipalities and 9906
statistical sectors. We obtained data per statistical sector for 1981, 1991, 2001 and 2011, and
made an interpolation for 1986 and an extrapolation for 2013; in both the latter cases we rescaled
For the purpose of downdating, we required a detailed population density raster for 2013.
The Belgian Federal Department of the Interior provided population data at 100 m resolution for
2013 which we resampled to a 30 m raster to enable computations with the sealed surface series.
However, the original population raster had a number of drawbacks. The raw population data
were extracted from a database of the Belgian National Population Register (Rijksregister) which
contains the addresses of all inhabitants. Unfortunately, these addresses were transformed into
coordinates with an unknown interpolation method. Especially in rural areas we noticed a
mismatch between the built-up area in the land-use map and the sealed surface maps on the one
hand, and the population map on the other. Furthermore, the totals were slightly different from
those of the Federal Department of Economics.
Hence, we decided to evenly redistribute all the population living in cells without
buildings, i.e. cells without an urban land use or without sealed surfaces, over nearby cells
having a ‘habitable’ urban land use with sealed surface cover. At 10 m resolution, residential and
industrial cells, commerce and services, port areas, and military buildings were considered to be
‘habitable’, while cells labelled as infrastructure and all rural and natural land uses were not.
Thus all 30 m pixels containing at least one ‘habitable’ cell in the 10 m land-use map, and having
SSFi > 0, were defined to be ‘habitable’. The redistribution was done in 5 x 5 focal
neighbourhoods around the wrongly located 30 m ‘inhabited’ cells, and repeated with remaining
erroneous locations in 11 x 11 and 17 x 17 focal neighbourhoods. The remaining very small
amount of population not having ‘habitable’ cells within a 17 x 17 focal neighbourhood was
considered to be totally wrong, and was therefore excluded. In the end, we performed a rescaling
of Economics data. The rescaling was proportional to the population already present in a cell.
The resulting map is shown in Figure 2.
2.4 Downdating of the population density map
To produce a population density map for 1986 and 2001, we developed a downdating
strategy using the population raster constructed for 2013, as well as the sealed surface fractions
of 1987 and 2001 and the statistical data for 1986 and 2001. The results of the downdating for
2001 served as input data for the 1986 estimates.
In the proposed strategy, cells that are not part of the urban mask in a previous time step
do not receive any population. For cells with changing SSF values we hypothesise a local
relationship between the evolution of the population and sealed surface cover. We do so by
assuming that the local building style imposes a more or less constant population density per unit
of built-up area. Therefore, increases in sealed surface cover in urban cells between an earlier
and a later date can be associated with increases in population:
(3)
with i,t-1 the estimated population in pixel i at an earlier time step t – 1, Pi,t the population in
pixel i at step t, and SSFi, t-1 and SSFi, t the sealed surface fraction in pixel i at time steps t – 1 and
t. The fact that ribbon development next to existing roads is one of the most common
mechanisms of built-up area growth in Flanders supports the hypothesis that SSF increase goes
along with local population growth, with little changes in population density per unit built-up
area. As such, the proposed procedure seems a valid option to create rasters with spatial
resolution higher than the level of statistical sectors for past decades. On the other hand, the
approach does not account for large-scale major evolutions such as population decline or
related to an increase in the number of inhabitants. As such, a rescaling of local population
estimates obtained is required, accounting for these effects. The rescaling ensures correct totals
at the statistical sector level:
(4)
with Pi,t-1 the rescaled population in pixel i at time step t – 1, Ps,t-1 the total population in
statistical sector s, j a pixel in sector s, and n the number of pixels in sector s. The applied
correction factor for every statistical sector serves both as a validation of the
constant density hypothesis and, in case of a rejection of this hypothesis in a statistical sector, as
an indicator of density changes. If the correction factor for a statistical sector is close to 1, then
use of equation (3) to estimate the population seems justified. A correction factor not close to 1
indicates that population density trends in the statistical sector are not in line with the extension
of the urban tissue. In that case, the factor gives an indication of population density changes in
relation to the sealed surface fraction evolution within the sector. The inverse of the correction
factor can be defined as a densification index Ds,t-1,t for a statistical sector s between time steps t
– 1 and t:
(5)
For sectors with an increasing population, Ds serves as a detection method for urban
densification (if Ds > 1) or deteriorative sprawl (if Ds < 1). The index is not suited though to
analyse causes for a shrinking population since there is clearly no direct link between population
decrease and sealed surface growth.
2.5 Uncertainty propagation analysis
Because sealed surface mapping from remotely sensed data inevitably introduces
Canters, 2014) and may be considered the most important source of error in the downdating
method proposed in this study, we analysed how this uncertainty affects the computation of the
historical population maps and the densification indices through Monte Carlo uncertainty
propagation analysis.
The sealed surface fraction estimates obtained in this study were validated for a set of
Landsat pixels, located in parts of the study area covered by the IKONOS images used for
calibrating the sub-pixel mapping model (see section 2.2). For a set of validation pixels, not used
in the calibration, and for which it was verified that sealed surface cover did not change between
1986 and 2013, the error in sealed surface fraction estimates was calculated, using the average
sealed surface fraction in the underlying IKONOS pixels as ground truth. Validation pixels were
selected with stratified random sampling: each of ten quantiles of all possible sealed surface
fraction values are equally represented in the validation set. Next, random errors were drawn for
all Landsat pixels from a multivariate normal distribution defined by the mean error vector and
the variance-covariance error matrix, calculated from the errors observed at each time step. This
way, error perturbed versions of the sealed surface maps for each of the three time steps could be
produced, accounting for temporal correlation in the errors. The error simulation process was
repeated 100 times, producing 100 sealed surface maps for all time steps. These maps were used
to compute 100 population maps of 2001 and 1986 and 100 densification index maps for the
periods 1986-2001 and 2001-2013. As such, we can analyse the uncertainty in the resulting
population and densification maps.
3. Results
Sealed surface cover increased in Flanders and the Brussels Capital Region (BCR) from
1911km² in 1987 to 2687 km² in 2013 (Vanderhaegen & Canters, 2016), which corresponds to
an overall growth of 41%. The proportions of sealed surface cover in each time step largely
match the proportions of built-up land use reported by the Belgian Cadastre (Table 2). The
average daily growth of sealed surfaces was 10 ha between 1987 and 2001, and 6 ha between
2001 and 2013. During the same period, the population evolved from 6,652,730 in 1986 to
7,536,494 in 2013, or a 13% overall growth (Table 3). The average annual population growth
increased from 19,246 during the 1986–2001 period to 49,589 during the 2001–2013 period. In
other words, while the population growth rate has risen significantly, the sealed surface growth
rate has declined.
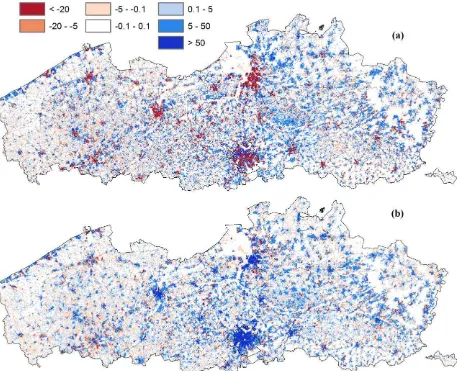
To show and analyse the trends observed, we have aggregated our 30 m population maps
obtained for the three dates to a 300 m resolution. Between 1986 and 2001 the population
decreased in almost all urban centres, Antwerp, Ghent and Bruges being the best examples, as
well as in some rural areas (Figure 3a). In the BCR the trend was more mixed, with some
neighbourhoods increasing and others decreasing in population, resulting in almost no total
population change over the whole period (Table 3). Suburban areas attracted the most
population, especially around Antwerp and in the north of Limburg province. Another growth
zone was the Belgian coast, situated at the northwest edge of West Flanders province. Between
2001 and 2013 population in all cities increased, especially in Brussels, Antwerp and Ghent
(Figure 3b). At the same time, the population increase was still considerable in suburban areas,
as well as along the Belgian coast. Decreases in population were mostly limited to rural areas,
with some neighbourhoods at the edges of cities as exceptions.
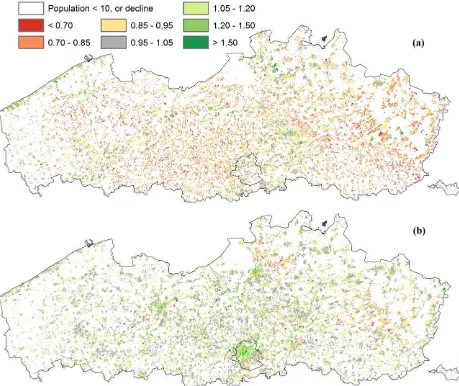
We also aggregated the results obtained for the densification index of equation (5) to a
300 m resolution, and excluded all 300 m cells with a population below 10 in the start year of a
time period to avoid outliers, as well as all cells with a population decline during that time
period. Before 2001 the trend towards sprawl is clear in almost the whole of Flanders (Figure
4a): index values below 1 indicate that sealed surfaces grew more strongly than the population.
The lower the population density of a cell, the more obvious is the trend (Table 4). There are
only a few exceptions, with the Belgian coast standing out. After 2001 some regional differences
appear (Figure 4b). In general, the densification index is higher for cells with a higher population
density (Table 4). In most cities, the densification process brought extra population to areas
where sealed surface fractions were already high. In many suburban zones, the increase of sealed
surfaces was proportional to the population growth. However, in some rural areas with an
increasing population, and especially in suburban areas north of Antwerp and in the centre of
Limburg province, there was still a stronger increase of the built-up area than of the population.
This continuing process of sprawl is also observed at the level of municipalities in the north and
east of Flanders (Figure 5). Not all municipalities covering urban core areas have the highest
values for the densification index, since they often are much larger than only the urban core.
Some smaller municipalities in the ‘Flemish Diamond’, the central region between the cities of
Brussels, Ghent, Antwerp and Leuven, have equally high index values.
3.3 Uncertainty propagation analysis
Since error in sealed surface maps can be substantial, we wanted to investigate if this
causes a high uncertainty in the resulting population and densification maps. There is no
significant bias in sealed surface error and the errors for each time step prove to be normally
multivariate normal error distribution. Like in the original procedure, the maps obtained for the
three time steps in each of the 100 simulations were made temporally consistent. The standard
deviation of the 100 resulting sealed surface fractions, averaged over all cells, which provides a
measure of the magnitude of the uncertainty, is for all time steps around 15% (Table 5). Errors
are lower in urban areas, and more specifically in the three largest cities (Brussels, Antwerp and
Ghent). While these errors are significant, they seem to level each other out when sealed surface
ratios are used together with other available information to produce population maps. The
average standard deviation in the population maps (aggregated to the 300 m resolution used in
the population and densification analysis) is only around 1 person per cell (Table 5). Absolute
uncertainty values are higher in dense urban areas since the population per cell is higher and the
sealed surface differences in time are mostly limited. However, the standard deviations are still
relatively small with values of around 10 persons per 300 m cell (Figure 6), while most of these
cells are inhabited by 1000 to 2000 persons. The densification indices have a limited uncertainty
too (Table 5) in comparison with the range of observed values in Figure 4. There is only very
little spatial variation in densification uncertainty, except in a few cells with changed urban
functions, like old industrial terrains that were reconverted into dense residential areas.
4. Discussion
The combination of population growth with the construction of a dense road network
have caused widespread sprawl in Flanders with large areas of ribbon development in between
villages. This phenomenon can be seen in the land-use map (Figure 1), but is even more striking
when analysing detailed population maps as produced in this study (Figure 2). A real urban flight
during the last decades of the 20th century towards suburban areas caused a huge intake of
population trends, as can be inferred from the low densification factor values in almost all areas
with a population increase in the period 1986–2001. An exception is the Belgian coastline, which
has been almost entirely filled up with high rise apartment buildings for decades. These buildings
were originally intended for recreational stays but have gradually been more and more used as
permanent residences, especially by the growing number of older people (Schillebeeckx, De
Decker, & Oosterlynck, 2013). One of the causes of the population decline per unit of built-up
area is the shrinking household size. In Belgium an average household had 2.73 members in
1981, 2.52 in 1991, and 2.31 in 2008 (Deboosere et al., 2009; FOD Economie, 2011). 30% of all
households in Flanders and 50% in the BCR consisted of singles in 2008.
The massive sprawl has been made possible due to a lack of spatial planning. It was only
in 1997 that Flanders adopted the general Spatial Structure Plan (Ruimtelijk Structuurplan
Vlaanderen). But even in this plan residential development is still allowed in a large number of
non-urban lots (De Decker, 2008). Likewise, ribbon development continues to occur along roads
where building is still allowed (Verbeek, Boussauw, & Pisman, 2014).
Since 2001, the urban population has significantly increased. Household sizes are larger
again in cities, especially in the BCR (FOD Economie, 2011). Migration is an important factor in
this new urban revival since cities serve as an arrival station for newcomers (Schillebeeckx, De
Decker, & Oosterlynck, 2013). In our analysis we see indeed that migrant neighbourhoods in
Brussels and Antwerp have the largest densification index values. However, we also clearly
observe population growth and a densification increase in almost all other urban
neighbourhoods, including those of smaller towns and in centres of suburban municipalities,
especially in the ‘Flemish Diamond’. On the other hand, most suburban areas in the north and
The beginning of a trend towards densification seems to be there, but many authors
believe that spatial planning in Flanders still has to improve. The Spatial Structure Plan of
Flanders is in the process of being replaced by the Spatial Policy Plan for Flanders (Beleidsplan
Ruimte Vlaanderen), yet Boussauw and Boelens (2015) criticise the content of the plan. Among
other things, they indicate the persistence of exceptions for large projects, the lack of
quantification and measurable goals, the lack of cooperation between the Belgian regions, and
more specifically the restrictions on the growth of the Brussels urban area in the fringe governed
by the Flanders region encapsulating the city. The recent strong growth of the population in
Brussels caused a rise of real-estate market prices which is leading to new suburbanisation
further away from Brussels, in both Flanders and Wallonia (Boussauw, Allaert, & Witlox, 2013).
Leaving the city is often not the preferred choice of young adults in Belgium who desire to
acquire a home, but the prices force them to do so. Living in less attractive urban
neighbourhoods or renting instead of buying can be intermediate solutions or alternatives
(Slegers, Kesteloot, Van Criekingen, & Decroly, 2012). Within the cities, there is also an
increasing segregation between ethnic groups. The proportion of migrants living in often poorer
neighbourhoods seems to be an important negative attractiveness factor for those who can afford
to live elsewhere (Schuermans, Meeus, & De Decker, 2015).
An enhanced spatial planning policy in Belgium clearly needs quantifiable goals to
prevent the growing population from moving into the rural zones, and rather to house it in
available space in the existing urban centres. Both long-term land use modelling and specific
case studies assessing the impact of different planning scenarios can help to reach these goals.
Job accessibility should again become a more important factor in residential location choices in
activity-based land-use models which need to be fed with reliable population and employment
data to allow for a proper calibration. The approach proposed in this study for producing detailed
historical population maps may help to do so. Between 1986 and 2001 the relation between
population and sealed surface growth was not constant: for a 27% increase of sealed surface
cover in Flanders, there was only a 5% increase of the population. This means that the computed
population density map for 1986 may be less reliable as an input for historical calibration of the
activity-based land-use model for Flanders. From 2001 densification factor values are close to 1
for the less populated cells, which suggests that the hypothesis of equation (3) is valid for this
period (Table 4). A better input population raster for the most recent year (2013) would help to
reduce some of the errors observed, especially in rural neighbourhoods. Within urban cores, and
especially those of the largest cities, a densification trend is observed between 2001 and 2013,
yet one should keep in mind that it is more difficult to examine the ratio between sealed surfaces
and population in an environment that is already largely built-up. The detailed population
predictions within city centres for 2001 are therefore assumed to be less reliable than the local
predictions in rural areas. Since the prime purpose of an urban growth model remains the
prediction of the future extension of urban land uses, the limitations of the proposed downdating
approach seem acceptable for historic calibration purposes.
In summary, downdating a spatially detailed population density map has the advantage of
using today’s high resolution information for predicting population densities in the past, but
involves the risk that errors will increase when going further back in time. To build scenarios for
Flanders’ and Brussels’ future, a calibration based on the most recent period in the past (2001 –
2013 in this study) should give the best results since this period includes the start of the
sealed surface cover seems to hold rather well for this time frame. A modelling scenario exercise
predicting possible urban futures for Flanders has already been carried out with a CA model for
the Department of Spatial Planning (de Kok, Poelmans, Engelen, Uljee, & Van Esch, 2012), but
could be improved with a multifunctional CA model including land use, population, employment
and transport, as has been proposed by Crols et al. (2015). Downdating of population based on
time series of sealed surface maps may be useful for the calibration of this model and was also
the incentive for developing the mapping approach proposed in this paper.
5. Conclusion
This paper presents an approach for downdating a detailed population density map for a
recent date, using a time series of sealed surface data for the past, obtained through remote
sensing. The computed historical population density maps revealed spatial differences and
changing trends in the relation between population and sealed surface cover in Flanders and
Brussels. In the last decades of the 20th century the region experienced an urban population
decline and a massive increase of urban sprawl. Since 2001 the urban population has been
increasing again, primarily due to immigration, but in the centres of smaller towns also as a
result of the advent of an overall spatial structure planning policy that was missing before.
Nevertheless, the built-up area used per inhabitant is still increasing in some rural areas and
several suburban municipalities in the north and east of Flanders.
Land-use models can help spatial planners to define objectives for the spatial allocation
of the still expected population growth in the future. These land-use models should incorporate
population, employment and transport data at a detailed scale level. Downdating of recent
estimates of the past, as proposed in this study, may be useful for producing historical data
needed for the calibration of such models.
Acknowledgments
This work is supported by a PhD-scholarship financed by the Flemish Institute for Technological
Research (VITO), Environmental Modelling Unit, Mol, Belgium. We thank the reviewers for their
helpful comments.
References
Anas, A., Arnott, R., & Small, K. A. (1998). Urban spatial structure. Journal of Economic Literature, 36(3), 1426-1464.
Antrop, M. (2000). Changing patterns in the urbanized countryside of Western Europe. Landscape Ecology, 15(3), 257-270. doi - 10.1023/A:1008151109252
Antrop, M. (2004). Landscape change and the urbanization process in Europe. Landscape and Urban Planning, 67(1-4), 9-26. doi - 10.1016/S0169-2046(03)00026-4
Barredo, J. I., Kasanko, M., McCormick, N., & Lavalle, C. (2003). Modelling dynamic spatial processes: simulation of urban future scenarios through cellular automata. Landscape and Urban Planning, 64(3), 145-160. doi - 10.1016/S0169-2046(02)00218-9
Batista e Silva, F., Gallego, J., & Lavalle, C. (2013). A high-resolution population grid map for Europe. Journal of Maps, 9(1), 16-28. doi - 10.1080/17445647.2013.764830
Batty, M., Besussi, E., & Chin, N. (2003). Traffic, urban growth and suburban sprawl. CASA Working Papers, 70. London, UK: Centre for Advanced Spatial Analysis, UCL. Retrieved from http://eprints.ucl.ac.uk/216/.
Boussauw, K., Derudder, B., & Witlox, F. (2011). Measuring spatial separation processes through the minimum commute: the case of Flanders. European Journal of Transport and Infrastructure Research, 11(1), 42–60. Retrieved from
http://www.ejtir.tudelft.nl/issues/2011_01/pdf/2011_01_02.pdf
Boussauw, K., & Boelens, L. (2015). Fuzzy tales for hard blueprints: the selective coproduction of the Spatial Policy Plan for Flanders, Belgium. Environment and Planning C: Government and Policy, 33(6), 1376-1393. doi - 10.1068/c12327
Brueckner, J. K. (2000). Urban sprawl: diagnosis and remedies. International Regional Science Review, 23(2), 160-171. doi - 10.1177/016001700761012710
Camagni, R., Gibelli, M. C., & Rigamonti, P. (2002). Urban mobility and urban form: the social and environmental costs of different patterns of urban expansion. Ecological Economics, 40(2), 199–216. doi - 10.1016/S0921-8009(01)00254-3
Cockx, K., & Canters, F. (2015). Incorporating spatial non-stationarity to improve dasymetric mapping of population. Applied Geography, 63, 220-230. doi - 10.1016/j.apgeog.2015.07.002
Cockx, K., Van de Voorde, T., & Canters, F. (2014). Quantifying uncertainty in remote sensing based urban land-use mapping. International Journal of Applied Earth Observation and
Geoinformation, 31, 154-166. doi - 10.1016/j.jag.2014.03.016
Crane, R. (1996). The influence of uncertain job location on urban form and the journey to work. Journal of Urban Economics, 39(3), 342-356. doi -10.1006/juec.1996.0018
Crols, T., White, R., Uljee, I., Engelen, G., Poelmans, L., & Canters, F. (2015). A travel time-based variable grid approach for an activity-based cellular automata model. International Journal of Geographical Information Science, 29(10), 1757-1781.
doi - 10.1080/13658816.2015.1047838
De Block, G., & Polasky, J. (2011). Light railways and the rural-urban continuum: technology, space and society in late nineteenth-century Belgium. Journal of Historical Geography, 37(3), 312-328. doi - 10.1016/j.jhg.2011.01.003
Deboosere, P., Lesthaeghe, R., Surkyn, J., Willaert, D., Boulanger, P.-M., Lambert, A., et al. (2009). Huishoudens en gezinnen in België (Households and families in Belgium). In FOD Economie (Ed.), Sociaal-Economische Enquête 2001. Monografieën (Socio-Economic Survey 2001. Monographs), nr 4/2009. Brussels: Algemene Directie Statistiek en Economische Informatie. Retrieved from
http://statbel.fgov.be/nl/binaries/mono_200104_nl%5B1%5D_tcm325-92942.pdf
De Decker, P. (2008). Facets of housing and housing policies in Belgium. Journal of Housing and the Built Environment, 23(3), 155-171. doi - 10.1007/s10901-008-9110-4
De Decker, P. (2011). Understanding housing sprawl: the case of Flanders, Belgium. Environment and Planning A, 43(7), 1634-1654. doi - 10.1068/a43242
Resources of a Limited Planet: Pathways and Visions under Uncertainty, Proceedings of the 6th International Congress on Environmental Modelling and Software (iEMSs 2012), July 1-5, 2012, Leipzig, Germany, (pp. 1984–1991).
http://www.iemss.org/sites/iemss2012//proceedings/F1_0400_deKok_et_al.pdf
Deville, P., Linard, C., Martin, S., Gilbert, M., Stevens, F. R., Gaughan, A. E., et al. (2014). Dynamic population mapping using mobile phone data. Proceedings of the National Academy of Sciences, 111(45), 15888-15893. doi - 10.1073/pnas.1408439111
Dieleman, F., & Wegener, M. (2004). Compact city and urban sprawl. Built Environment, 30(4), 308-323. doi - 10.2148/benv.30.4.308.57151
Douglass, R. W., Meyer, D. A., Ram, M., Rideout, D., & Song, D. (2015). High resolution population estimates from telecommunications data. EPJ Data Science, 4, 4.
doi - 10.1140/epjds/s13688-015-0040-6
Eicher, C. L., & Brewer, C. A. (2001). Dasymetric mapping and areal interpolation:
Implementation and evaluation. Cartography and Geographic Information Science, 28(2), 125-138. doi - 10.1559/152304001782173727
Engelen, G., & White, R. (2007). Validating and calibrating integrated cellular automata based models of land use change. In S. Albeverio, D. Andrey, P. Giordano, & A. Vancheri (Eds.), The Dynamics of Complex Urban Systems (pp. 185-211). Heidelberg: Physica-Verlag.
doi - 10.1007/978-3-7908-1937-3_10
European Commission (2014). Investment for jobs and growth. Promoting development and good governance in EU regions and cities. Sixth report on economic, social and territorial cohesion. Luxembourg: Publication Office of the European Union. doi - 10.2776/81072
European Environment Agency (2006). Urban sprawl in Europe. The ignored challenge. EEA Report No 10/2006. Copenhagen, & Luxembourg: European Environment Agency, & Office for Official Publications of the European Communities. Retrieved from
http://www.eea.europa.eu/publications/eea_report_2006_10.
Ewing, R. H. (2008). Characteristics, causes, and effects of sprawl: a literature review. In J. M. Marzluff, E. Shulenberger, W. Endlicher, M. Alberti, G. Bradley, C. Ryan, et al. (Eds.), Urban Ecology. An International Perspective on the Interaction Between Humans and Nature
(pp. 519-535). Springer US. doi - 10.1007/978-0-387-73412-5_34
FOD Economie (2011). In the spotlight, 6 December 2011. Small and less small households. Brussels: Statistics Belgium. Retrieved from
http://statbel.fgov.be/en/statistics/organisation/statistics_belgium/dissemination/statbel/in_the_sp otlight_archives/in_the_spotlight_2011/20111206_small_and_less_small_households.jsp
Retail and Energy. Retrieved from
http://statbel.fgov.be/nl/modules/publications/statistiques/environnement/downloadbare_bestand en/bodembezetting_volgens_het_Kadaster_(1982_-_2015).jsp
Fricke, R., & Wolff, E. (2002). The MURBANDY project: development of land use and network databases for the Brussels area (Belgium) using remote sensing and aerial photography.
International Journal of Applied Earth Observation and Geoinformation, 4(1), 33-50. doi - 10.1016/S0303-2434(02)00010-7
Gallego, F. J., Batista, F., Rocha, C., & Mubareka, S. (2011). Disaggregating population density of the European Union with CORINE land cover. International Journal of Geographical
Information Science, 25(12), 2051-2069. doi - 10.1080/13658816.2011.583653
Giuliano, G., Gordon, P., Pan, Q., & Park, J. Y. (2010). Accessibility and residential land values: some tests with new measures. Urban Studies, 47(14), 3103-3130.
doi - 10.1177/0042098009359949
Goerlich, F. J., & Cantarino, I. (2013). A population density grid for Spain. International Journal of Geographical Information Science, 27(12), 2247-2263. doi - 10.1080/13658816.2013.799283
Haase, D., & Schwarz, N. (2009). Simulation models on human-nature interactions in urban landscapes: a review including spatial economics, system dynamics, cellular automata and agent-based approaches. Living Reviews in Landscape Research, 3(2). Retrieved from http://landscaperesearch.livingreviews.org/Articles/lrlr-2009-2/.
Hertogen, J. (2013). Bevolkingsevolutie 1831-2012 in gemeenten, arr., prov. en gewesten (Evolution of population 1831-2012 in municipalities, arrondissements, provinces and regions). Non-profit data (npdata.be). Retrieved from
http://www.npdata.be/BuG/190-Bevolking-gemeente-1831-2012/
Jackson, L. E. (2003). The relationship of urban design to human health and condition. Landscape and Urban Planning, 64(4), 191-200. doi - 10.1016/S0169-2046(02)00230-X
Jia, P., & Gaughan, A. E. (2016). Dasymetric modeling: A hybrid approach using land cover and tax parcel data for mapping population in Alachua County, Florida. Applied Geography, 66, 100-108. doi - 10.1016/j.apgeog.2015.11.006
Jia, P., Qiu, Y., & Gaughan, A. E. (2014). A fine-scale spatial population distribution on the High-resolution Gridded Population Surface and application in Alachua County, Florida. Applied Geography, 50, 99-107. doi - 10.1016/j.apgeog.2014.02.009
Langford, M., Maguire, D. J., & Unwin, D. J. (1991). The areal interpolation problem:
estimating population using remote sensing in a GIS framework. In I. Masser, & M. Blakemore (Eds.), Handling Geographical Information: Methodology and Potential Applications (pp. 55– 77). New York: Wiley.
Lu, D., Weng, Q., & Li, G. (2006). Residential population estimation using a remote sensing derived impervious surface approach. International Journal of Remote Sensing, 27(16), 3553-3570. doi - 10.1080/01431160600617202
Mather, P. M. (2004). Computer processing of remotely-sensed images: An introduction. Chichester: Wiley.
Meeus, B., & De Decker, P. (2015). Staying put! A housing pathway analysis of residential stability in Belgium. Housing Studies, 30(7), 1116-1134. doi - 10.1080/02673037.2015.1008424
Mennis, J. (2003). Generating surface models of population using dasymetric mapping. The Professional Geographer, 55(1), 31-42. doi - 10.1111/0033-0124.10042
Newman, P., & Kenworthy, J. (1989). Cities and automobile dependence. A sourcebook. Aldershot: Gower.
Poelmans, L., & Van Rompaey, A. (2009). Detecting and modelling spatial patterns of urban sprawl in highly fragmented areas: a case study in the Flanders-Brussels region. Landscape and Urban Planning, 93(1), 10-19. doi -10.1016/j.landurbplan.2009.05.018
Poelmans, L., & Van Rompaey, A. (2010). Complexity and performance of urban expansion models. Computers, Environment and Urban Systems, 34(1), 17–27.
doi - 10.1016/j.compenvurbsys.2009.06.001
Ravetz, J., Fertner, C., & Nielsen, T. S. (2013). The dynamics of peri-urbanization. In K.
Nilsson, S. Pauleit, S. Bell, C. Aalbers, & T. A. S. Nielsen (Eds.), Peri-urban futures: scenarios and models for land use change in Europe (pp. 13–44). Berlin/Heidelberg: Springer-Verlag. doi - 10.1007/978-3-642-30529-0_2
Richardson, H. W. (1995). Economies and diseconomies of agglomeration. In H. Giersch (Ed.), Urban agglomeration and economic growth (pp. 123–155). Berlin/Heidelberg: Springer-Verlag. doi - 10.1007/978-3-642-79397-4_6
Santé, I., García, A. M., Miranda, D., & Crecente, R. (2010). Cellular automata models for the simulation of real-world urban processes: A review and analysis. Landscape and Urban Planning, 96(2), 108-122. doi - 10.1016/j.landurbplan.2010.03.001
http://www.steunpuntruimte.be/index.php?option=com_joomdoc&task=doc_download&gid=173 3&Itemid=112&lang=nl
Schuermans, N., Meeus, B., & De Decker, P. (2015). Geographies of whiteness and wealth: white, middle class discourses on segregation and social mix in Flanders, Belgium. Journal of Urban Affairs, 37(4), 478-495. doi - 10.1111/juaf.12155
Slegers, K., Kesteloot, C., Van Criekingen, M., & Decroly, J.-M. (2013). Fordist housing behaviour in a post-fordist context. Journal of Settlements and Spatial Planning, 3(2), 77-91.
Stevens, F. R., Gaughan, A. E., Linard, C., & Tatem, A. J. (2015). Disaggregating census data for population mapping using random forests with remotely-sensed and ancillary data. PloS ONE, 10(2), e0107042. doi - 10.1371/journal.pone.0107042
Straatman, B., White, R., & Engelen, G. (2004). Towards an automatic calibration procedure for constrained cellular automata. Computers, Environment and Urban Systems, 28(1-2), 149-170. doi - 10.1016/S0198-9715(02)00068-6
Tapp, A. F. (2010). Areal Interpolation and Dasymetric Mapping Methods Using Local Ancillary Data Sources. Cartography and Geographic Information Science, 37(3), 215-228.
doi - 10.1559/152304010792194976
Vanderhaegen, S., & Canters, F. (2016). Use of Earth observation for monitoring soil sealing trends in Flanders and Brussels between 1976 and 2013. Belgeo [Online], 2 | 2016. Retrieved from http://belgeo.revues.org/18025
Vanderhaegen, S., De Munter, K., & Canters, F. (2015). High resolution modelling and forecasting of soil sealing density at the regional scale. Landscape and Urban Planning, 133, 133-142. doi - 10.1016/j.landurbplan.2014.09.016
van der Kwast, J., Poelmans, L., Van de Voorde, T., de Jong, K., Uljee, I., Karssenberg, D., et al. (2012). Uncertainty analysis and data-assimilation of remote sensing data for the calibration of cellular automata based land-use models. In R. Seppelt, A. A. Voinov, S. Lange, & D. Bankamp (Eds.), Managing Resources of a Limited Planet: Pathways and Visions under Uncertainty, Proceedings of the 6th International Congress on Environmental Modelling and Software (iEMSs 2012), July 1-5, 2012, Leipzig, Germany, (pp. 997–1004).
http://www.iemss.org/sites/iemss2012//proceedings/D1_2_0452_vanderKwast_et_al.pdf
van der Kwast, J., Uljee, I., Engelen, G., Van de Voorde, T., Canters, F., & Lavalle, C. (2009). Using remote sensing derived spatial metrics for the calibration of land-use change models. IEEE Proceedings of the 7th International Urban Remote Sensing Conference (URS 2009), May 20-22, 2009, Shanghai, China. doi - 10.1109/URS.2009.5137596
Van de Voorde, T., Jacquet, W., & Canters, F. (2011). Mapping form and function in urban areas: An approach based on urban metrics and continuous impervious surface data. Landscape and Urban Planning, 102(3), 143-155. doi - 10.1016/j.landurbplan.2011.03.017
Van de Voorde, T., van der Kwast, J., Poelmans, L., Canters, F., Binard, M., Cornet, Y., et al. (2016). Projecting alternative urban growth patterns: The development and application of a remote sensing assisted calibration framework for the Greater Dublin Area. Ecological Indicators, 60, 1056-1069. doi - 10.1016/j.ecolind.2015.08.035
van Vliet, J., Hurkens, J., White, R., & van Delden, H. (2012). An activity-based cellular automaton model to simulate land-use dynamics. Environment and Planning B: Planning and Design, 39(2), 198-212. doi - 10.1068/b36015
Verbeek, T., Boussauw, K., & Pisman, A. (2014). Presence and trends of linear sprawl:
Explaining ribbon development in the north of Belgium. Landscape and Urban Planning, 128, 48-59. doi - 10.1016/j.landurbplan.2014.04.022
Weng, Q. (2012). Remote sensing of impervious surfaces in the urban areas: Requirements, methods, and trends. Remote Sensing of Environment, 117, 34-49.
doi - 10.1016/j.rse.2011.02.030
White, R. (2006). Modelling multi-scale processes in a cellular automata framework. In J. Portugali (Ed.), Complex artificial environments (pp. 165–178). Berlin: Springer-Verlag. doi - 10.1007/3-540-29710-3_11
White, R., Engelen, G., & Uljee, I. (1997). The use of constrained cellular automata for high-resolution modelling of urban land-use dynamics. Environment and Planning B: Planning and Design, 24(3), 323-343. doi - 10.1068/b240323
White, R., Uljee, I., & Engelen, G. (2012). Integrated modelling of population, employment and land-use change with a multiple activity-based variable grid cellular automaton. International Journal of Geographical Information Science, 26(7), 1251-1280.
doi - 10.1080/13658816.2011.635146
Winters, S., Ceulemans, W., Heylen, K., Pannecoucke, I., Vanderstraeten, L., Van den Broeck, K., et al. (2015). Wonen in Vlaanderen anno 2013. De bevindingen uit het Grote Woononderzoek 2013 gebundeld (Housing in Flanders anno 2013. The compiled findings of the Great Housing Research 2013). Leuven: Steunpunt Wonen. Retrieved from
https://steunpuntwonen.be/Documenten/Onderzoek_Werkpakketten/gwo-volume-1-eind.pdf
Wu, C. (2004). Normalized spectral mixture analysis for monitoring urban composition using ETM+ imagery. Remote Sensing of Environment, 93(4), 480–492.
Wu, C., & Murray, A. T. (2007). Population estimation using Landsat Enhanced Thematic Mapper imagery. Geographical Analysis, 39(1), 26-43. doi - 10.1111/j.1538-4632.2006.00694.x
Wu, S., Qiu, X., & Wang, L. (2005). Population estimation methods in GIS and remote sensing: a review. GIScience and Remote Sensing, 42(1), 80-96. doi - 10.2747/1548-1603.42.1.80
Xie, Z. (2006). A framework for interpolating the population surface at the residential-housing-unit level. GIScience & Remote Sensing, 43(3), 233-251. doi - 10.2747/1548-1603.43.3.233
Zandbergen, P. A. (2011). Dasymetric mapping using high resolution address point datasets. Transactions in GIS, 15(s1), 5-27. doi - 10.1111/j.1467-9671.2011.01270.x
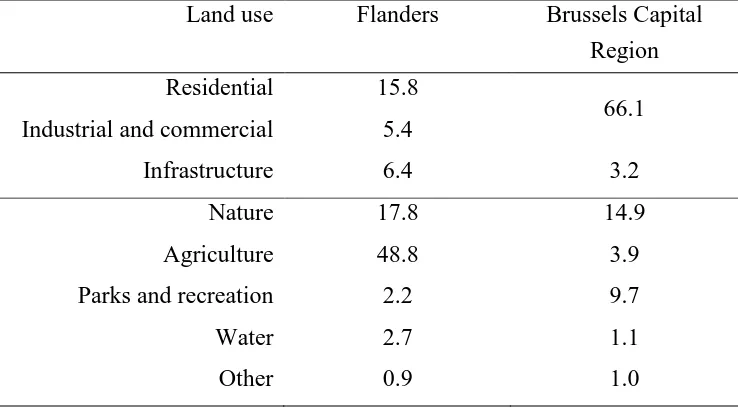
Table 1. Proportions of land uses (%) in Flanders and the Brussels Capital Region according to the 2013 land-use map of the Flemish Institute for Technological Research (VITO). Residential, industrial and commercial, and infrastructure are built-up land uses. Natural land covers in military terrains were moved from infrastructure to nature to produce this table.
Land use Flanders Brussels Capital
Region
Residential 15.8
66.1 Industrial and commercial 5.4
Infrastructure 6.4 3.2
Nature 17.8 14.9
Agriculture 48.8 3.9
Parks and recreation 2.2 9.7
Water 2.7 1.1
Other 0.9 1.0
Table 2. Proportion of built-up land use / land cover (%) in Flanders and the Brussels Capital Region for 1986, 2001, and 2013 according to the 2013 land-use map of VITO, the Belgian Cadastre, and the sealed surface time series (SSF × pixel area) used in this study.
LU/LC data Flanders Brussels Capital Region
1986 2001 2013 1986 2001 2013
LU map of VITO - - 27.6 - - 69.3
LU in the Cadastre 12.7 17.8 20.1 50.9 55.8 58.6
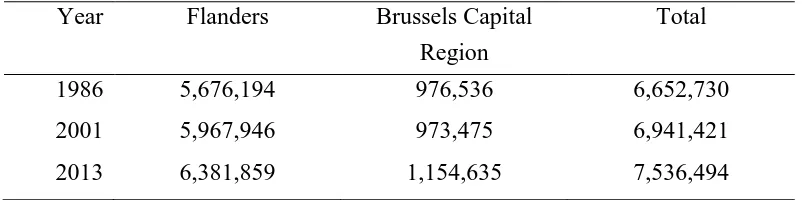
[image:32.612.76.509.455.555.2]Table 3. Population of Flanders and the Brussels Capital Region for 1986, 2001, and 2013.
Year Flanders Brussels Capital
Region
Total
1986 5,676,194 976,536 6,652,730
2001 5,967,946 973,475 6,941,421
[image:33.612.70.430.299.453.2]2013 6,381,859 1,154,635 7,536,494
Table 4. Average (Avg) densification index values and standard deviations (SD) for different categories of population per 300 m cell in the population density map for 2013. Cells with a population below 10 were excluded as outliers.
Population per
300 m cell (2013)
Densification index Ds
for cells with growing population
1986 – 2001 2001 – 2013
Avg SD Avg SD
10 – 30 0.866 0.187 1.006 0.139
30 – 100 0.905 0.181 1.022 0.170
100 – 300 0.948 0.201 1.043 0.170
[image:33.612.79.517.563.664.2]> 300 0.990 0.152 1.098 0.169
Table 5. Standard deviation of sealed surface fraction (30 m cells), population estimate (inhabitants per 300 m cell) and resulting densification index (300 m cells), averaged over all cells, in a Monte Carlo uncertainty propagation analysis.
1986
1986-2001
2001
2001-2013
2013
Sealed surface fraction 0.1560 0.1592 0.1574
Population 1.4635 1.0296 ---
Figure 1. Land-use map of Flanders and Brussels in 2013 (10 m resolution map developed by VITO aggregated to a 100 m resolution), with an indication of both regions (thick black lines; Brussels Capital Region (B)), the Flemish provinces (thin black lines) and their capitals (Bruges (Bg), Ghent (G), Antwerp (A), Leuven (L) and Hasselt (H)).
[image:34.612.77.539.431.615.2]Figure 3. Population difference maps (aggregated to a 300 m resolution) for the periods (a) 1986
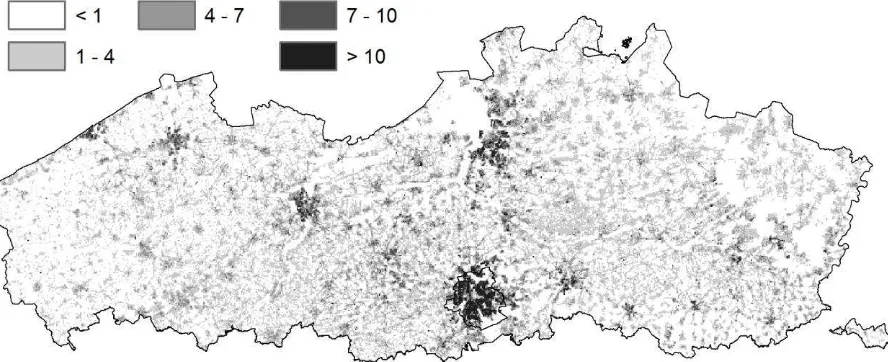
Figure 5. Average densification index values per municipality for the period 2001 – 2013. The Flemish provincial capitals are indicated: Bruges (Bg), Ghent (G), Antwerp (A), Leuven (L) and Hasselt (H).