Learning and Training at
Work 2001
David Spilsbury
IFF Research Ltd
Research Report
No 334
Learning and Training at Work 2001
David Spilsbury
IFF Research Ltd
The views expressed in this report are the authors' and do not necessarily reflect those of the Department for Education and Skills.
© Queen’s Printer 2002. Published with the permission of DfES on behalf of the Controller of Her Majesty's Stationery Office. Applications for reproduction should be made in writing to The Crown Copyright Unit, Her Majesty's Stationery Office, St Clements House, 2-16 Colegate, Norwich NR3 1BQ.
Table Of Contents
1
Introduction... 5
1.1 Background ...5
1.2 Aims and Objectives ...5
1.3 Methodology ...5
1.4 Sample Design and Weighting...6
1.5 Report Structure and Conventions ...6
2
Summary of Findings... 11
2.1 Introduction...11
2.2 Learning Opportunities and Facilities Available for Employees ...11
2.3 Provision of Job-Related Training and Reasons for Non-Provision ...12
2.4 Provision of Off-the-Job Training...12
2.5 Management of Training and Training Delivery ...12
2.6 Provision of On-the-Job Training ...13
2.7 Awareness of, and Involvement with, Training Initiatives ...13
2.8 NVQs ...13
2.9 Younger Employees...14
3
Learning Opportunities and Facilities Available for Employees ... 17
3.1 Learning Opportunities Offered to Employees ...17
3.2 Organisations with which Links or Networks Built to Give Employees Training and Development Opportunities ...19
3.3 Helping Employees Learn Things not Directly Connected to their Jobs...21
4
Provision of Job-Related Training and Reasons for Non-Provision... 23
4.1 Introduction...23
4.2 Employers Providing Job-Related Training...23
4.3 Reasons why Job-Related Training not Provided over Previous 12 Months...23
5
Provision of Off-the-Job Training ... 23
5.1 Introduction...23
5.2 Employers Who Provide Off-the-Job Training...23
5.3 Proportion of Employees Receiving Off-the-Job Training...23
5.4 Amount of Off-the-Job Training Provided ...23
6
Management and Delivery of Off-the-Job Training... 23
6.1 Introduction...23
6.2 Existence of Business, Training and Human Resource Plans and Budgets ...23
6.3 Use of Outside Support in Drawing up Planning Tools...23
6.4 Investor in People ...23
6.5 Resources for Off-the-Job Training ...23
6.6 Types of Off-the-Job Training Provided...23
6.7 Off-the-Job Training Leading to Formal Qualifications...23
6.8 Location of Off-the-Job Training...23
6.9 Satisfaction with Quality of Off-the-Job Training ...23
6.10 Methods of Providing Off-the-Job Training ...23
7
Provision of On-the-Job Training... 23
7.1 Employers Who Provide On-the-Job Training ...23
7.2 Methods Used to Provide On-the-Job Training ...23
8
Awareness Of, and Involvement with, Training Initiatives... 23
8.1 Introduction...23
8.2 Awareness Of Training Initiatives ...23
8.4 Extent to which NVQs/SVQs Offered... 23
8.5 Average Proportion of Employees to whom NVQs/SVQs on Offer ... 23
8.6 Average Proportion of Employees who have Achieved and who are Working towards NVQs/SVQs... 23
8.7 Level of Satisfaction with NVQs/SVQs ... 23
8.8 Assessment of NVQs/SVQs ... 23
8.9 Reasons for Not Offering NVQs/SVQs... 23
9
Young Employees Aged 16-24... 23
9.1 Employment of 16-24 Year Olds... 23
9.2 Recruitment of 16-24 Year Olds... 23
9.3 Training Initiatives for Young Employees ... 23
9.4 Factors Taken into Account when Recruiting 16-24 Year Olds... 23
9.5 Methods Used to Recruit 16-24 Year Olds... 23
9.6 Extent to which Qualifications Attained and being Worked towards by 16-17 and 18-19 Year Olds... 23
10
Small Firms ... 23
10.1 Introduction... 23
10.2 Provision of Learning Opportunities ... 23
10.3 Organisations with which Links or Networks Built to Give Employees Training and Development Opportunities... 23
10.4 Provision of Job Related Training ... 23
10.5 Provision of Off-The-Job Training ... 23
10.6 Provision of On-The-Job Training... 23
10.7 Awareness of Training Initiatives... 23
11
Technical Appendix... 23
11.1 Sampling Approach ... 23
11.2 The Questionnaire... 23
11.3 Piloting and Method of Data Collection ... 23
11.4 The Respondent ... 23
11.5 Interviews Obtained and Response Rates ... 23
11.6 Weighting of Results ... 23
1 Introduction
1.1 Background
1.1.1 Learning and Training at Work 2001 is the third in an annual series of
employer surveys that investigate workforce development. The survey also
investigates awareness of, and involvement with, a number of training and
development initiatives.
1.1.2 Learning and training information had previously been collected, along with
information on recruitment difficulties, skill shortages and skill gaps, in the
annual Skill Needs in Britain (SNIB) surveys, which were carried out
between 1990 and 1998.
1.2
Aims and Objectives
1.2.1 The objectives of the 2001 Learning and Training at Work survey were to
collect information about:
♦
The volume, type and pattern of off-the-job training
♦
Key indicators of employers’ commitment to training such as Investors
in People
♦
Learning opportunities offered
♦
Awareness of, and involvement with, a number of initiatives relevant
to training
1.3 Methodology
1.3.1 The survey consisted of 4,006 telephone interviews with employers in
England having 1 or more employees at the specific location sampled. All
business sectors, public and private, with the exception of schools and Local
Education Authorities were covered.
1.3.2 A pilot of 100 interviews was conducted in September 2001, prior to the main
interviewing programme, in order to ensure the questionnaire and general
approach met the objectives of the study.
1.3.3 All interviews were carried out from IFF’s telephone centre in London by fully
trained business-to-business interviewers.
1.3.4 In the 2001 study, the main stage of interviewing was carried out between 20
October and 4 December. In the 2000 study fieldwork took place between
17 July and 20 October: and in the 1999 study fieldwork took place between
3 November and 21 December.
6
1.3.5 The average length of interview in the 2001 study was 20 minutes.
1.3.6 The overall response rate to the survey was 63%.
1.3.7 Fuller details of the methodology employed can be found in the Technical
Appendix in Chapter 11.
1.4
Sample Design and Weighting
1.4.1 Sample design involved setting separate sample targets for each cell on a
Government Office region by industry sector by establishment size matrix.
1.4.2 Results from Learning and Training at Work 1999 and 2000 were originally
weighted to population estimates derived from the Annual Employment
Survey (AES). Following the demise of the AES, the Inter Departmental
Business Register (IDBR) was used to weight results from Learning and
Training at Work 2001. In order to provide a consistent time series, results
from the 1999 and 2000 surveys have been reweighted to IDBR population
estimates.
1.5
Report Structure and Conventions
1.5.1 There is some concern about the reliability of the results from all sizes of
establishment combined because of the large weighting factors used in
grossing up results from employers with 1-4 employees, allied with the fact
that these establishments account for 67% of all employers. The main body
of the report therefore presents results for employers with 5 or more
employees. In Chapter 10 we show results in key areas for employers with
1-4 employees so that readers can obtain an idea of the practices of small
firms.
1.5.3 Percentages may add to just over or under 100%, or absolute figures
aggregated across sub-samples may not add exactly to the total, due to
rounding. Where multiple answers were allowed the sum of the answers
may exceed 100%.
1.5.4 In most cases, percentages reported have been calculated on those
employers asked the question. However in a few places, for reasons of
clarity, percentages have been rebased. In the tables and figures in this
report the word “coverage” has been used to describe the employers asked
the question and the word “base” to describe employers on which the results
have been reported.
1.5.5 Results refer to the 2001 Learning and Training at Work survey unless
otherwise indicated.
1.5.6 Much of the information collected has been shown in tabular or graphical
form with appropriate written commentary on the findings. It is not the
intention of this report to interpret findings.
1.5.7 When a question was asked of all employers with 5 or more employees, the
results quoted are generally accurate, at 95% confidence levels, to +/- 1.5%.
Results reported for subsamples are subject to larger margins of error.
This means that if one is comparing the results from two surveys in two
different years, the percentages based on all employers need to differ by a
minimum of 4% for the apparent differences to be statistically significant at
95% confidence levels.
2 Summary of Findings
2.1 Introduction
2.1.1 Learning and Training at Work 2001 is the third in an annual series of
surveys amongst employers that investigates workforce development.
2.1.2 The objectives of the study were to collect information about:
♦
Key indicators of employers’ commitment to training, including the
volume of off-the-job training provided
♦
Employers’ awareness of, and involvement with, a number of
initiatives relevant to training.
2.1.3 The survey consisted of 4,006 telephone interviews with employers having 1
or more employee at the location sampled. All business sectors, private and
public, with the exception of schools and Local Education Authorities were
covered. Only employers in England were interviewed. Interviewing took
place between 20 October and 4 December 2001.
2.1.4 This summary is based on the 3,431 interviews carried out with employers
having 5 or more employees. This is due to concerns over the influence on
the overall results of employers with 1-4 employees because of the high
weighting factors involved when their results are projected up to population
estimates. When relevant, results have been compared with those obtained
from the 1999 and 2000 Learning and Training at Work surveys.
2.2
Learning Opportunities and Facilities Available for Employees
2.2.1 Six out of ten employers (59%) offered at least one of eight nominated types
of learning opportunity to their employees. Learning in information
technology (40%) and in working with others (37%) were most commonly
offered. In the 2000 study a larger proportion of employers (76%) offered a
learning opportunity. In 1999, 62% did so. (ref. section 3.1)
2.2.2 In the 2001 study, half of all employers (51%) reported that they had built
links or networks with organisations in order to give employees training and
development opportunities. Further education establishments (31%) had
most commonly been used, followed by schools (22%) and NTOs/ITOs
(20%). (ref. section 3.2)
12
2.3
Provision of Job-Related Training and Reasons for Non-Provision
2.3.1 In the 2001 study, almost nine out of ten employers (88%) had provided
employees at the location with either off-the-job or on-the-job training in the
12 months prior to interview. This compares with 89% and 92% found in
1999 and 2000 respectively. (ref. section 4.2)
2.3.2 By far the most common reason for not having provided any job-related
training was that employers felt the skills needed by their employees met the
needs of the establishment so training was not necessary. (ref. section 4.3)
2.4
Provision of Off-the-Job Training
2.4.1 Off-the-job training had been provided by over half of employers (55%) in the
12 months prior to interview. This figure is midway between the 52% found
in 1999 and the 59% found in 2000. (ref. section 5.2)
2.4.2 Overall, in the 2001 study, 28% of employees had received off-the-job
training over the previous 12 months. For most sizes of employer this is
lower than in 2000 but still higher than in 1999. (ref. section 5.3)
2.4.3 The amount of off-the-job training per employee has increased to 2.3 days
from 1.6 days in 1999 and 1.7 days in 2000. The amount provided per
trainee has increased to 8.2 days from 7.1 days in 1999 and 6.1 days in
2000. (ref. section 5.4)
2.5
Management of Training and Training Delivery
2.5.1 Three out of five employers (60%) had a business plan, half (49%) a training
plan, two out of five (38%) a training budget and a third (31%) a human
resources plan. (ref. section 6.2)
2.5.2 Over a quarter of employers (28%) reported that their establishment had
been recognised as an Investor in People. This represents a slight increase
over the 25% found in the 2000 study. (ref. section 6.4)
2.5.3 Three-quarters of employers (76%) who had provided off-the-job training in
the 12 months prior to interview had a member of senior management within
the organisation responsible for training. This figure is very similar to the
77% and 78% reported in the 1999 and 2000 studies. (ref. section 6.5)
2.5.5 Over half of employers (55%) providing off-the-job training stated that at
least some of this training was leading to formal qualifications, most
commonly NVQs. The corresponding figures in 1999 and 2000 were 52%
and 56%. (ref. section 6.7)
2.6
Provision of On-the-Job Training
2.6.1 Over three-quarters of employers (78%) had carried out on-the-job training in
the twelve months prior to interview. This is similar to the proportion found in
1999 (79%) and represents a decline over that found in 2000 (83%).
(ref. section 7.1)
2.6.2 On-the-job training had most commonly been provided by a line manager or
supervisor followed by other experienced staff in the company.
(ref. section 7.2)
2.7
Awareness of, and Involvement with, Training Initiatives
2.7.1 Over nine out of ten employers (94%) were aware of NVQs, the initiative with
the highest level of awareness. This is similar to the levels of awareness
found in the two previous surveys (93% in 1999 and 96% in 2000).
(ref. section 8.1)
2.7.2 At least half of all employers had heard of New Deal (56%) and Advanced
Modern Apprenticeships (51%). (ref. section 8.1)
2.7.3 Over a third (37%) had been involved with one or more of the eleven
initiatives discussed, with more employers having been involved with NVQs
than any of the other initiatives. (ref section 8.3)
2.8 NVQs
2.8.1 One in three employers (34%) reported that they offered NVQs to employees
at their location. This represents an increase over the 30% found in the
1999 and the 31% found in the 2000 study. (ref. section 8.4)
2.8.2 On average, in establishments where they are on offer, NVQs were being
offered to 42% of employees. This represents an increase over the 38%
found in the 2000 study. (ref. section 8.5)
2.8.3 Overall, 17% of employees in establishments where NVQs are on offer have
achieved the qualification and 10% are working towards it. (ref. section 8.6)
14
2.9 Younger
Employees
2.9.1 Approaching three out of four employers (71%) employed 16-24 year olds.
(ref. section 9.1)
2.9.2 Employers in the 2001 study employing younger employees stated that 40%
of their 16-17 year old employees and 48% of their 18-19 year old
employees had attained a
Level 2
or equivalent qualification.
(ref. section 9.6)
2.9.3 These employers stated that 7% of their 16-17 year old employees and 21%
of their 18-19 year old employees had attained a
Level 3
or equivalent
qualification. (ref. section 9.6)
3
Learning Opportunities and Facilities Available for
Employees
3.1
Learning Opportunities Offered to Employees
3.1.1 Employers were asked which, if any, of a number of learning opportunities
they offered to employees at the location.
3.1.2 Overall, six out of ten (59%) offered at least one of the eight types of learning
opportunity discussed. Learning in information technology (40%) and
working with others (37%) were the types most commonly offered.
The proportion of employers offering learning opportunities has declined
since the 2000 study when 76% did so. The figure in 1999 was 62%.
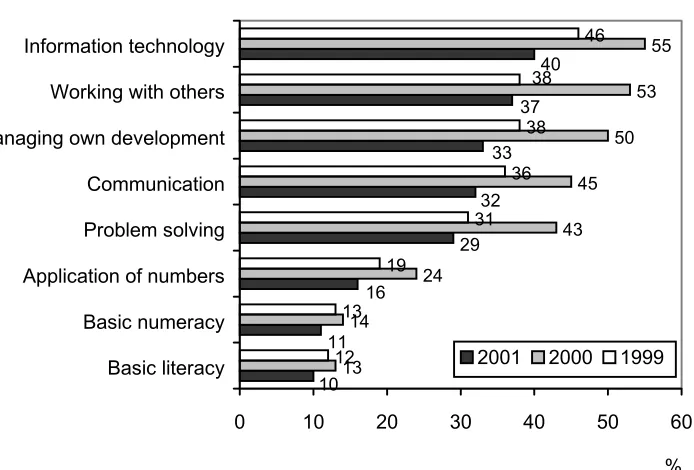
Fig 1
Learning opportunities offered
Base/Coverage: all employers with 5 or more employees – 3431
13 14 24 43 45 50 12 13 19 31 36 38 46 10 11 16 29 32 33 37 40 53 55 38
0 10 20 30 40 50 60
Basic literacy Basic numeracy Application of numbers Problem solving Communication Managing own development Working with others Information technology
%
[image:19.595.111.458.287.522.2]18
3.1.3 The tendency to offer all eight types of learning opportunity increased with
increasing employer size.
Table 1
Learning opportunities offered by size of employer
Total 5-24 25-99 100-199 200-499 500+% % % % % % Information technology 40 35 56 70 74 86 Working with others 37 35 45 51 57 73 Managing own development 33 29 46 53 60 71 Communication (through either
written work or oral presentation) 32 29 40 51 59 78 Problem solving 29 27 35 47 55 65 Application of numbers 16 16 17 26 30 45 Basic numeracy 11 10 13 22 25 42 Basic literacy 10 8 13 22 27 44
Any of the above 59 55 73 80 84 91
Total no. of employers 661052 519245 111280 17695 9565 3267 Base/Coverage: all employers with 5 or more employees – 3431
3.1.4 Employers in the transport, public administration and other services sector
were more likely to offer a wider range of learning opportunities than those in
other sectors.
Table 2
Learning opportunities offered by industry sector of
employer
Total Manufac -turing Agriculture mining, construction, utilities Distribution & consumer services Finance & business services Transport, public admin, other services % % % % % %Information technology 40 38 29 26 51 54 Working with others 37 25 21 41 32 45 Managing own development 33 23 18 31 34 41 Communication (through either
written work or oral
presentation) 32 20 16 30 32 43 Problem solving 29 21 16 30 29 36 Application of numbers 16 13 11 19 15 17 Basic numeracy 11 10 6 11 8 15 Basic literacy 10 10 6 9 8 14
Any of the above 59 48 40 56 60 72
Total no. of employers 661052 73785 50095 230095 123940 183137
Base/Coverage: all employers with 5 or more employees – 3431
3.2
Organisations with which Links or Networks Built to Give Employees
Training and Development Opportunities
3.2.1 Employers were asked which, if any, of a number of types of organisation
they had built links or networks with in order to give employees training and
development opportunities.
Half of employers (51%) had done so, with Further Education establishments
most commonly used, followed by schools and NTOs/ITOs.
Table 3
Organisations with which links or networks built to give
employees training and development opportunities
%
Any of those below 51
Further education establishments 31
Schools 22 NTOs/ITOs 20
Learning Partnerships 12
LLSCs/TECs 11 UfI/Learndirect 6 Base/Coverage: all employers with 5 or more employees – 3431
3.2.2 Larger employers were more likely than smaller ones to have built links or
networks with all types of organisation.
Table 4
Organisations with which links or networks built to give
employees training and development opportunities by size of employer
Total 5-24 25-99 100-199 200-499 500+
% % % % % %
Any of those below 51 46 66 79 83 87
Further education establishments 31 27 43 56 60 74
Schools 22 18 32 39 48 53
NTOs/ITOs 20 16 31 39 41 46
Learning Partnerships 12 9 20 26 30 42
LLSCs/TECs 11 8 18 27 34 47
UfI/Learndirect 6 4 10 17 20 29
20
3.2.3 Employers in the transport, administration and public services sector were
most likely to have built links or networks: those in the distribution and
consumer services sector least likely to have done so.
Table 5
Organisations with which links or networks built to give
employees training and development opportunities by industry sector
of employer
Total Manufac-turing Agric-ulture, mining, utilities, const-ruction Distribution & consumer services Finance & business services Transport, public admin, other services % % % % % %Any of those below 51 47 55 37 49 71
Further education establishments 31 26 34 19 30 48
Schools 22 22 19 15 14 36
NTOs/ITOs 20 20 27 12 17 29
Learning Partnerships 12 10 6 5 10 24
LLSCs/TECs 11 11 9 6 10 18
UfI/Learndirect 6 5 3 3 6 11
Total no. of employers 661052 73785 50095 230095 123940 183137 Base/Coverage: all employers with 5 or more employees – 3431
3.2.4 The proportion of employers in each region who had built links or networks
with one or more of the types of organisations discussed was as shown
below:
Table 6
Organisations with which links or networks built to give
employees training and development opportunities by Government
Office region of employer
Total Total no. of employers
% %
Any of those covered 51 661052
North East 52 28995
North West 50 86155
Yorkshire and the Humber 63 63945
East Midlands 51 54500
West Midlands 61 69405
Eastern 55 71360
London 44 108970
South East 43 109785
South West 53 67937
3.3
Helping Employees Learn Things not Directly Connected to their Jobs
3.3.1 Employers were asked whether they helped employees learn things not
directly connected to their job.
3.3.2 Almost one in three employers (30%) did so. This is similar to the
proportions found in the 2000 and 1999 studies (32% and 29% respectively).
3.3.3 The proportion of employers who offer employees learning opportunities not
directly connected to employees’ jobs, broadly speaking, increases with
increasing size of employer.
Table 7
Offer of learning activities not directly connected to
employees’ jobs by size of employer
1999 2000 2001 Total no.
% % % of employers
5-24 27 32 28 519245
25-99 33 31 37 111280
100-199 36 37 36 17695
200-499 44 49 43 9565
500+ 51 53 56 3267
TOTAL 29 32 30 661052
Base/Coverage: all employers with 5 or more employees – 3431
3.3.4 Employers in service sectors are more likely to offer these learning
opportunities than those in other sectors.
Table 8
Offer of learning activities not directly connected to
employees’ jobs by industry sector of employer
1999 2000 2001 Total no.
% % % of employers
Manufacturing 22 26 26 73785
Agriculture, mining, utilities & construction 27 22 22 50095 Distribution & consumer services 27 32 31 230095
Finance & business services 30 29 29 123940
Transport, public admin & other services 34 38 33 183137
TOTAL 29 32 30 661052
22
3.3.5 The proportion of employers offering these learning opportunities varies by
region as shown below:
Table 9
Offer of learning activities not directly connected to
employees’ jobs by Government Office region of employer
1999 2000 2001 Total no.
% % % of employers
North East 30 35 25 28995
North West 32 35 29 86155
Yorkshire and the Humber 32 29 34 63945
East Midlands 30 26 28 54500
West Midlands 29 36 35 69405
Eastern 26 30 25 71360
London 29 31 36 108970
South East 27 29 26 109785
South West 26 38 28 67937
TOTAL 29 32 30 661052
4
Provision of Job-Related Training and Reasons for
Non-Provision
4.1 Introduction
4.1.1 In this section we summarise:
♦
the proportion of employers who have provided training, either
off-the-job or on-the-off-the-job, for any of the employees at the location over the
previous 12 months
and
♦
for the 2000 and 2001 studies only, the reasons given by employers
who have not provided any training for not having done so.
4.2
Employers Providing Job-Related Training
4.2.1 Overall, in the 2001 study, nine out of ten employers (89%) reported that
they had provided employees at the location with either off-the-job or
on-the-job training over the previous 12 months. This compares with the 92% found
in the 2000 study and the 89% found in the 1999 study.
The proportion of employers providing off-the-job, on-the-job, both and either
types of training over the 12 months prior to interview is shown below:
Table 10 Provision of job-related training
1999 2000 2001
% % %
Off-the-job 52 59 55
On-the-job 79 83 78
Both 42 51 45
Either 89 92 88
26
4.2.2 The chart below shows the proportion of employers in 2001 providing only
off-the-job training, only on-the-job training, both types and neither type.
Fig 2
Provision of job-related training
4.2.3 The figures from the 2001 study also show that 81% of employers who
provide off-the-job training also provide on-the-job training, and that 58% of
employers who provide on-the-job training also provide off-the-job training
(the equivalent figures from the 2000 study were 86% and 61%, and for the
1999 study 81% and 54%).
On-the-job only 33%
Off-the-job and on-the-job 45%
Neither 12%
[image:28.595.132.375.108.361.2]4.2.4 The larger the employer the more likely it is that they have provided training
over the past 12 months.
Table 11 Provision of job-related training by size of employer
Total 5-24 25-99 100-199 200-499 500+
% % % % % %
Off-the-job
- 1999 52 47 72 82 89 91
- 2000 59 54 78 92 96 98
- 2001 55 49 75 87 85 93
On-the-job
- 1999 79 77 85 88 94 94
- 2000 83 82 89 94 93 92
- 2001 78 75 88 91 91 94
Both
- 1999 42 36 62 74 83 86
- 2000 51 45 70 87 90 90
- 2001 45 38 68 79 78 87
Either
- 1999 89 87 95 97 99 99
- 2000 92 90 97 99 100* 100*
- 2001 88 86 95 99 98 100*
Base/Coverage: all employers with 5 or more employees – 3431 (2001), 3498 (2000), 3430 (1999)
Note: 100* indicates a percentage of more than 99.5% that has been rounded up to 100%
4.2.5 In the 2001 study, employers in the transport, public administration and other
services sector were most likely to have provided training in the previous 12
months.
Table 12 Provision of job-related training by industry sector of
employer
Total Manufac -turing Agric-ulture, mining, utilities, const-ruction Distribution & consumer services Finance & business services Transport, public admin, other services % % % % % % Off-the-job- 1999 52 48 57 42 56 64
- 2000 59 55 62 46 66 74
- 2001 55 50 60 41 61 70
On-the-job
- 1999 79 76 60 83 81 79
- 2000 83 78 69 90 77 85
- 2001 78 78 64 83 72 78
Both
- 1999 42 42 36 35 45 53
- 2000 51 48 45 42 53 64
- 2001 45 42 40 36 48 57
Either
- 1999 89 83 81 90 92 90
- 2000 92 85 86 94 90 95
- 2001 88 85 84 88 86 92
[image:29.595.123.529.127.347.2] [image:29.595.126.541.486.735.2]28
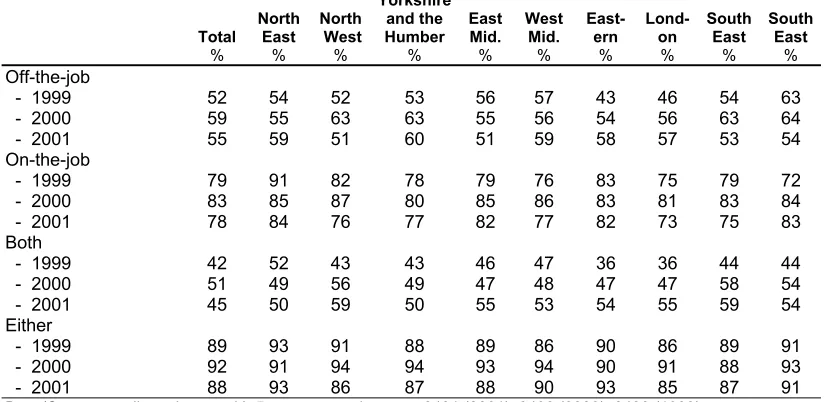
4.2.6 In the 2001 study, employers in the North East, Eastern and South West
regions were more likely than the national average to have provided training
over the previous 12 months.
Table 13 Provision of job-related training by Government Office
region of employer
Total North East West North
Yorkshire and the
Humber East Mid. West Mid. East-ern Lond-on South East South East
% % % % % % % % % %
Off-the-job
- 1999 52 54 52 53 56 57 43 46 54 63 - 2000 59 55 63 63 55 56 54 56 63 64 - 2001 55 59 51 60 51 59 58 57 53 54
On-the-job
- 1999 79 91 82 78 79 76 83 75 79 72 - 2000 83 85 87 80 85 86 83 81 83 84 - 2001 78 84 76 77 82 77 82 73 75 83 Both
- 1999 42 52 43 43 46 47 36 36 44 44 - 2000 51 49 56 49 47 48 47 47 58 54 - 2001 45 50 59 50 55 53 54 55 59 54 Either
- 1999 89 93 91 88 89 86 90 86 89 91 - 2000 92 91 94 94 93 94 90 91 88 93 - 2001 88 93 86 87 88 90 93 85 87 91
Base/Coverage: all employers with 5 or more employees – 3431 (2001), 3498 (2000), 3430 (1999)
4.3
Reasons why Job-Related Training not Provided over Previous 12
Months
4.3.1 Employers in the 2000 and 2001 studies who had not provided either
off-the-job or on-the-off-the-job training over the previous 12 months were asked why they
had not done so.
4.3.2 By far the most common reason reported was that the skills that their
employees currently meet their needs, so training was not needed.
Table 14 Reasons why job-related training not provided
2000 2001
% %
Existing skills of employees meet our needs so training
not needed 70 62
New recruits are sufficient to obtain the skills required /
already have the required skills 9 16
Employees learn from experience 4 9
Training programme not yet in place 3 4
Lack of finance / cannot afford it 2 3
Employees too busy to give training 3 3
Employees too busy to receive training 1 3
Other 4 9
Base/Coverage: all employers with 5 or more employees who had not provided training in the previous 12 months – 210
[image:30.595.100.512.161.362.2]5
Provision of Off-the-Job Training
5.1 Introduction
5.1.1 In this section we explore:
♦
the proportion of employers who have provided off-the-job training in
the 12 months prior to interview
♦
the types of employer who were most likely to provide off-the-job
training
♦
the proportion of employees who received off-the-job training
♦
the amount of off-the-job training provided
5.1.2 It was explained to employers that:
“... by off-the-job training, we are including all training away
from the immediate work position. It can be given at your
premises or elsewhere. It includes all sorts of courses - full or
part time; correspondence or distance learning; health and
safety training and so on - as long as it is funded or arranged
by you”.
5.2
Employers Who Provide Off-the-Job Training
5.2.1 The survey indicates that over half of employers (55%) provided off-the-job
training to at least some of their employees in the 12 months prior to the
interview. This represents a decline of four percentage points since the
2000 study when 59% of employers had provided off-the-job training over
the previous 12 months. The figure in 1999 was 52%.
Comparisons with the Labour Force Survey suggest that the size of the
reported increase between the 1999 and 2000 surveys is probably
32
5.2.2 The following table shows that, broadly speaking, the proportion of
employers providing off-the-job training increases with increasing employer
size and that there has been a decline since the 2000 study in the proportion
amongst all sizes of employer, particularly those with 200-499 employees.
Table 15 Provision of off-the-job training by size of employer
1999 2000 2001 Total no.% % % of employers
5 – 24 47 54 49 519245
25 – 99 72 78 75 111280
100 – 199 82 92 87 17695
200 – 499 89 96 85 9565
500 + 91 98 93 3267
TOTAL 52 59 55 661052
Base/Coverage: all employers with 5 or more employees – 3431
5.2.3 Employers in the transport, public administration and other services sector
(70%) were most likely to have provided off-the-job training and those in the
distribution and consumer services sector least likely to have done so (41%).
There has been a decline in the proportion of employers providing off-the-job
training in all industry sectors since the 2000 study.
Table 16 Provision of off-the-job training by industry sector of
employer
1999 2000 2001 Total no.
% % % of employers
Manufacturing 48 55 50 73785
Agriculture, mining, utilities, construction 57 62 60 50095
Distribution & consumer services 42 46 41 230095
Finance & business services 56 66 61 123940
Transport, public administration and
other services 64 74 70 183137
TOTAL 52 59 55 661052
5.2.4 The provision of off-the-job training by employers in the last year was highest
in Yorkshire and the Humber (60%) and lowest in the North West and East
Midlands regions (51%).
Table 17 Provision of off-the-job training by Government Office
region of employer
1999 2000 2001 Total no.
% % % of employers
North East 54 55 59 28995
North West 52 63 51 86155
Yorkshire and the Humber 53 63 60 63945
East Midlands 56 55 51 54500
West Midlands 57 56 59 69405
Eastern 43 54 58 71360
London 46 56 57 108970
South East 54 63 53 109785
South West 63 64 54 67937
TOTAL 52 59 55 661052
Base/Coverage: all employers with 5 or more employees - 3431
5.3
Proportion of Employees Receiving Off-the-Job Training
5.3.1 Overall, 28% of employees had received off-the-job training in the 12 months
prior to interview. This is very similar to the 27% reported in the 2000 study,
with both figures being higher than the 23% found in 1999.
5.3.2 The data in the remainder of this chapter presents results on an employee
as opposed to an employer basis. Readers should note that since results
were weighted on an employer basis these findings are subject to greater
variability.
5.3.3 The proportion of employees trained does not vary widely by establishment
size.
Between 1999 and 2000, establishments with 500 or more employees were
the only size of establishment in which the proportion of employees receiving
off-the-job training declined; between 2000 and 2001 it was the only size of
establishments in which the proportion rose.
Table 18 Proportion of employees receiving off-the-job training by
size of employer
1999 2000 2001
% % %
5 – 24 23 27 25
25 – 99 29 33 30
100 – 199 25 36 31
200 – 499 25 35 31
500 + 20 17 31
TOTAL 23 27 28
34
5.3.4 The proportion of employees trained was highest in the transport, public
administration and other services sector and lowest in the distribution and
consumer services sector.
Table 19 Proportion of employees receiving off-the-job training by
industry sector of employer
1999 2000 2001
% % %
Manufacturing 18 22 23
Agriculture, mining, utilities, construction 23 30 30
Distribution & consumer services 19 26 20
Finance & business services 23 30 30
Transport, public administration & other services 28 29 33
TOTAL 23 27 28
Base/Coverage: all employers with 5 or more employees providing off-the-job training over the previous 12 months – 2516
5.3.5 The proportion of employees who had received off-the-job training over the
previous year was highest in Yorkshire and the Humber (31%) and lowest in
the East Midlands and South East (25%).
Table 20 Proportion of employees receiving off-the-job training by
Government Office region of employer
1999 2000 2001
% % %
North East 26 26 29
North West 23 29 28
Yorkshire and the Humber 21 27 31
East Midlands 20 26 25
West Midlands 19 26 28
Eastern 20 29 28
London 23 28 28
South East 26 26 25
South West 29 28 26
TOTAL 23 27 28
5.4
Amount of Off-the-Job Training Provided
5.4.1 Employers were asked to estimate the number of days off-the-job training
they had provided per employee trained. When using these figures it should
be borne in mind that these figures may be subject to a greater degree of
inaccuracy than other data in this report.
5.4.2 Over the last 12 months, employees receiving off-the-job training had, on
average, received 8.2 days each. This equates to an average of 2.3 days
having been provided per employee.
The equivalent figures in the 2000 study were 6.1 days per employee trained
and 1.7 days per employee; and in the 1999 study 7.1 days per employee
trained and 1.6 days per employee.
5.4.3 In the following three paragraphs when the average number of days
off-the-job training provided is shown, the first table in each paragraph shows the
average number of days provided per trainee, and the second the average
number per employee employed, whether trained or not.
5.4.4 The average number of days off-the-job training provided by establishments
of various sizes is shown in the two tables below.
It can be seen from Table 21 that the average number of days reaches a
peak amongst establishments with 25-99 employees and then declines.
Table 21 Average number of training days per employee
trained
by
size of employer
1999 2000 2001
5 – 24 7.8 6.7 9.5
25 – 99 7.3 6.9 10.4
100 – 199 7.2 6.2 7.3
200 – 499 7.0 5.2 7.3
500 + 6.2 4.9 5.5
TOTAL 7.1 6.1 8.2
Base/Coverage: all employers with 5 or more employees providing off-the-job training over the previous 12 months – 2516
Table 22 Average number of training days per employee by size of
employer
1999 2000 2001
5 – 24 1.8 1.8 2.4
25 – 99 2.1 2.3 3.1
100 – 199 1.8 2.2 2.2
200 – 499 1.7 1.8 2.2
500 + 1.3 0.8 1.7
TOTAL 1.6 1.7 2.3
36
5.4.5 The average number of training days provided by employers in each industry
sector is shown in the next two tables.
It can be seen from Table 23 that trainees in the transport, public
administration and other services sector had received the most training.
Table 23 Average number of training days per employee
trained
by
industry sector of employer
1999 2000 2001
Manufacturing 7.3 5.6 7.4
Agriculture, mining, utilities, construction 7.2 7.1 8.7
Distribution & consumer services 7.4 5.5 8.3
Finance & business services 7.2 6.3 7.4
Transport, public admin & other services 6.9 6.4 8.9
TOTAL 7.1 6.1 8.2
Base/Coverage: all employers with 5 or more employees providing off-the-job training over the previous 12 months – 2516
Table 24 Average number of training days per employee by industry
sector of employer
1999 2000 2001
Manufacturing 1.3 1.2 1.7
Agriculture, mining, utilities, construction 1.7 2.1 2.6
Distribution & consumer services 1.4 1.5 1.7
Finance & business services 1.7 1.9 2.2
Transport, public admin & other services 1.9 1.8 2.9
TOTAL 1.6 1.7 2.3
5.4.6 As shown in Table 25, trainees in the North East region had received the
highest number of days training in the last year. Trainees in the Yorkshire
and the Humber region had received the least.
Table 25 Average number of training days per employee
trained
by
Government Office region of employer
1999 2000 2001
North East 6.4 6.1 12.3
North West 8.3 6.5 7.3
Yorkshire and the Humber 7.4 6.2 6.3
East Midlands 8.3 6.9 7.2
West Midlands 6.4 6.7 9.7
Eastern 6.3 5.1 8.2
London 5.7 6.5 8.3
South East 7.2 5.7 7.8
South West 7.9 5.5 9.4
TOTAL 7.1 6.1 8.2
Base/Coverage: all employers with 5 or more employees providing off-the-job training over the previous 12 months – 2516
Table 26 Average number of training days per employee by
Government Office region of employer
1999 2000 2001
North East 1.7 1.6 3.6
North West 1.9 1.9 2.0
Yorkshire and the Humber 1.6 1.7 2.0
East Midlands 1.7 1.8 1.8
West Midlands 1.2 1.8 2.7
Eastern 1.3 1.5 2.3
London 1.3 1.8 2.3
South East 1.9 1.5 1.9
South West 2.3 1.5 2.5
TOTAL 1.6 1.7 2.3
Base/Coverage: all employers with 5 or more employees - 3431
Chapter 6
Management and Delivery
6
Management and Delivery of Off-the-Job Training
6.1 Introduction
6.1.1 This section examines employers’ approach to off-the-job training in a
number of areas:
♦
The existence of business, training and human resource plans and
budgets and the use of outside support in drawing these up
♦
Recognition as an Investor in People
♦
The allocation of staff and resources to training of employees
♦
The types of off-the-job training provided over the last year
♦
Employers
using
off-the-job training to provide formal qualifications for
their employees and the types of formal qualification towards which
employees were training
♦
The location of the off-the-job training provided and levels of
satisfaction with training provided at each location
42
6.2
Existence of Business, Training and Human Resource Plans and
Budgets
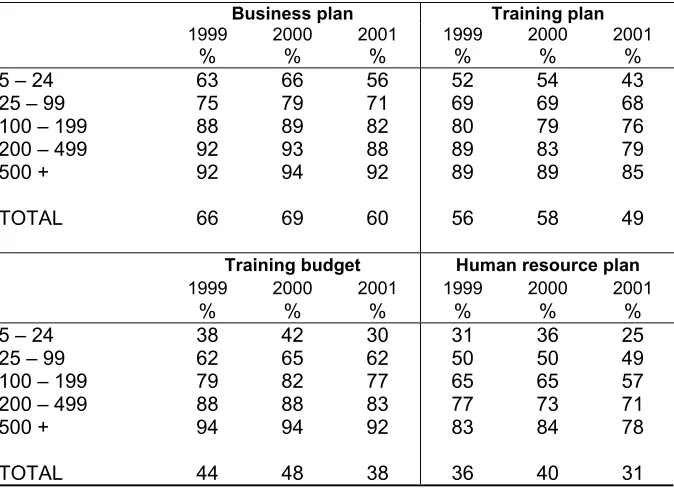
6.2.1 The proportion of employers having a business plan, a training plan, a
training budget and a human resources plan is shown in the table below.
It can be seen that three out of five (60%) had a business plan, half (49%) a
training plan, two out of five (38%) a training budget and a third (31%) a
human resources plan.
The existence of all four planning tools has decreased since the 2000 study.
Fig 3
Existence of plans and budgets
Base/Coverage: all employers with 5 or more employees – 3431
69
58
48
40 60
49
38
31 36
44 56
66
0 10 20 30 40 50 60 70 80
Business plan Training plan Training budget Human resources plan %
6.2.2 As the following table illustrates, the existence of plans and budgets
increases with increasing size of employer.
Table 27 Existence of plans and budgets by size of employer
Business plan Training plan1999 2000 2001 1999 2000 2001
% % % % % %
5 – 24 63 66 56 52 54 43
25 – 99 75 79 71 69 69 68
100 – 199 88 89 82 80 79 76
200 – 499 92 93 88 89 83 79
500 + 92 94 92 89 89 85
TOTAL 66 69 60 56 58 49
Training budget Human resource plan 1999 2000 2001 1999 2000 2001
% % % % % %
5 – 24 38 42 30 31 36 25
25 – 99 62 65 62 50 50 49
100 – 199 79 82 77 65 65 57
200 – 499 88 88 83 77 73 71
500 + 94 94 92 83 84 78
TOTAL 44 48 38 36 40 31
Base/Coverage: all employers with 5 or more employees – 3431
6.2.3 Employers in the transport, public administration and other services and in
the finance and business services sectors were most likely to have plans
and budgets.
Table 28 Existence of plans and budgets by industry sector of
employer
Business plan Training plan 1999 2000 2001 1999 2000 2001
% % % % % %
Manufacturing 65 69 60 45 50 40
Agriculture, mining, utilities, construction 58 68 53 36 47 42 Distribution & consumer services 60 64 56 57 56 46
Finance & business services 73 77 66 58 56 43
Transport, public admin & other services 72 70 63 64 67 61
TOTAL 66 69 60 56 58 49
Training budget Human resource plan 1999 2000 2001 1999 2000 2001
% % % % % %
Manufacturing 28 41 34 24 30 26
Agriculture, mining, utilities, construction 28 36 31 23 24 22 Distribution & consumer services 37 38 27 34 37 28
Finance & business services 47 54 39 44 42 34
Transport, public admin & other services 61 62 56 44 50 37
TOTAL 44 48 38 36 40 31
[image:45.595.125.462.125.369.2]44
6.2.4 The existence of plans and budgets varied between regions as shown in the
table below.
Table 29 Existence of plans and budgets by Government Office
region of employer
Business plan Training plan 1999 2000 2001 1999 2000 2001
% % % % % %
North East 62 61 59 57 62 56
North West 67 76 62 57 62 46
Yorkshire and the Humber 58 67 57 57 51 57
East Midlands 63 73 60 57 63 58
West Midlands 65 63 63 51 59 48
Eastern 63 67 63 51 58 49
London 72 66 56 58 50 46
South East 71 68 54 54 56 40
South West 65 76 69 60 64 55
TOTAL 66 69 60 56 58 49
Training budget Human resource plan 1999 2000 2001 1999 2000 2001
% % % % % %
North East 47 46 39 40 35 33
North West 41 50 36 36 45 27
Yorkshire and the Humber 40 43 41 33 37 33
East Midlands 45 47 37 29 39 36
West Midlands 40 46 35 33 38 25
Eastern 37 42 37 30 36 35
London 49 44 36 43 39 32
South East 46 48 37 40 42 28
South West 48 64 47 38 41 33
TOTAL 44 48 38 36 40 31
[image:46.595.108.451.143.481.2]6.3
Use of Outside Support in Drawing up Planning Tools
6.3.1 For the first time in 2001, employers who had any of the four planning tools
in place were asked whether or not they had received any outside support in
drawing up the plans or budgets and, if so, from whom.
Overall, a quarter of employers (23%) had received outside support. A wide
variety of types of organisation had been used, with the organisation’s head
or regional office, a government body and a Business Link being most
commonly used.
Table 30 Receipt of outside support in drawing up planning tools
%
Outside support received 23
Of those receiving support, support received from:
Head / regional office / sister company 19
Government / local authority / council / NHS / hospital 13
Business Link 12
HE / FE College 7
Trade association 7
LLSC/TEC 6
Independent consultant 6
Private training company / provider 6
Accountant 5 Other 16
Not stated 7
Base/Coverage: all employers with 5 or more employees with planning tools in place – 2933 all employers with 5 or more employees who had received outside support – 528
6.3.2 Use of outside support in drawing up planning tools was more common
amongst smaller employers.
Table 31 Receipt of outside support in drawing up planning tools by
size of employer
%
5 – 24 24
25 – 99 21
100 – 199 17
200 – 499 16
500 + 13
46
6.3.3 Receipt of outside support varied by industry sector as follows:
Table 32 Receipt of outside support in drawing up planning tools by
industry sector of employer
% Manufacturing 12
Agriculture, mining, utilities, construction 26
Distribution & consumer services 20
Finance & business services 25
Transport, public admin & other services 27
TOTAL 23 Base/Coverage: all employers with 5 or more employees with planning tools in place -2933
6.3.4 The proportion of employers in each region receiving outside support when
drawing up planning tools is show below:
Table 33 Receipt of outside support in drawing up planning tools by
Government Office region of employer
%
North East 27
North West 18
Yorkshire and the Humber 27
East Midlands 20
West Midlands 21
Eastern 29 London 24
South East 18
South West 25
6.4
Investor in People
6.4.1 Employers were asked whether or not their establishment was formally
recognised as an Investor in People.
Over one in four employers (28%) reported that they were. This represents
a slight increase over the 25% who reported that they had been recognised
in the 2000 survey.
6.4.2 The proportion of larger establishments that have been recognised is,
broadly speaking, higher amongst larger establishments.
Table 34 Recognition as an Investor in People by size of employer
2000 2001 Total no. of employers% % %
5 – 24 22 24 519245
25 – 99 33 43 111280
100 – 199 37 42 17695
200 – 499 42 45 9565
500 + 48 53 3267
TOTAL 25 28 661052
Base/Coverage: all employers with 5 or more employees - 3431
6.4.3 The proportion of establishments recognised is highest in the transport,
public administration and other services and distribution and consumer
services sectors.
Table 35 Recognition as an Investor in People by industry sector of
employer
2000 2001 Total no. of employers
% % %
Manufacturing 19 17 73785
Agriculture, mining, utilities, construction 16 16 50095 Distribution & consumer services 29 34 230095
Finance & business services 18 18 123940
Transport, public admin & other services 29 35 183137
TOTAL 25 28 661052
48
6.4.4 Recognition as an Investor in People varies by region as follows:
Table 36 Recognition as an Investor in People by Government Office
region of employer
2000 2001 Total no. of employers
% % %
North East 30 22 28995
North West 32 25 86155
Yorkshire and the Humber 18 42 63945
East Midlands 25 24 54500
West Midlands 26 28 69405
Eastern 23 24 71360
London 22 25 108970
South East 28 28 109785
South West 20 32 67937
TOTAL 25 28 661052
Base/Coverage: all employers with 5 or more employees - 3431
6.5
Resources for Off-the-Job Training
6.5.1 In all three studies, employers who had provided off-the-job training in the
last 12 months were asked about the existence of resources for training
within their
organisation
(not just at the establishment sampled).
Specifically:
♦
whether the organisation had someone at senior management level
responsible for training
♦
whether the organisation had a separate training facility such as a
training school or centre
♦
whether the organisation had members of staff to design and teach
training courses
6.5.2 Three-quarters (76%) of the employers who had provided off-the-job training
in the last 12 months had a member of senior management with
responsibility for training within their organisation.
This compares with the 78% reported in the 2000 study and the 77%
reported in the 1999 study.
6.5.3 Staff to design and teach training courses existed in over a third (36%) of
organisations providing off-the-job training and a separate training facility in
almost a third (30%) of organisations.
6.5.4 On average, those employing staff to design and teach training courses
employed 11 such people within their organisation.
6.5.5 As the following table indicates, broadly speaking, the allocation of staff and
resources to training within the organisation increases with increasing size of
employer.
Table 37 Allocation of staff and resources for training by size of
employer
Senior management Training staff Training facility 1999 2000 2001 1999 2000 2001 1999 2000 2001
% % % % % % % % %
5 – 24 76 76 73 31 31 31 28 26 26
25 – 99 80 81 83 42 46 45 34 36 36
100 – 199 82 83 76 51 57 50 43 41 39
200 – 499 83 84 86 67 66 68 52 49 52
500 + 91 92 85 84 86 81 68 64 66
TOTAL 77 78 76 35 37 36 30 29 30
Base/Coverage: all employers with 5 or more employees providing off-the-job training in the last 12 months – 2516
6.5.6 Employers in the transport, public administration and other services sector
were the most likely to dedicate staff and resources within the organisation
to off-the-job training.
Table 38 Allocation of staff and resources for training by industry
sector of employer
Senior management Training staff Training facility
1999 2000 2001 1999 2000 2001 1999 2000 2001 % % % % % % % % % Manufacturing 67 67 71 22 19 18 16 14 17 Agriculture,
mining, utilities, construction
65 75 66 12 16 12 9 14 11
Distribution & consumer
services 80 80 80 45 44 39 46 33 37
Finance & business
services 77 74 70 32 28 31 21 22 24
Transport, public admin &
other services 82 83 80 39 46 48 34 39 36
TOTAL 77 78 76 35 37 36 30 29 30
[image:51.595.127.525.448.680.2]50
6.5.7 The proportion of employers in each region having someone at senior
management level within the organisation responsible for training, training
staff to design and teach courses and a separate training facility is shown
below:
Table 39 Allocation of staff and resources for training by Government
Office region of employer
Senior management Training staff Training facility
1999 2000 2001 1999 2000 2001 1999 2000 2001 % % % % % % % % %
North East 89 82 75 55 43 43 53 36 30
North West 81 79 68 33 30 38 28 28 32
Yorkshire and the
Humber 72 81 81 29 38 50 26 31 38
East Midlands 72 82 79 38 36 40 29 27 34
West Midlands 84 78 82 35 40 31 29 32 36
Eastern 83 80 71 36 36 32 37 25 28
London 69 69 77 37 37 36 30 26 25
South East 78 77 74 37 34 31 31 30 20
South West 76 81 78 30 42 33 26 33 33
TOTAL 77 78 76 35 37 36 30 29 30
Base/Coverage: all employers with 5 or more employees providing off-the-job training in the last 12 months – 2516
6.5.8 For the first time in the 2001 study, as a further measure of employers’
commitment to training those who had provided off-the-job training in the 12
months prior to interview were asked whether or not they have (a) a trade
union learning representative, and (b) an NVQ assessor.
One in eight (12%) have a trade union learning representative and over a
quarter (27%) an NVQ assessor.
6.5.9 Both are more common in larger establishments.
Table 40 Existence of Trade Union learning representatives and NVQ
assessors by size of employer
Trade Union
learning representative NVQ assessor
% %
5 – 24 9 23
25 – 99 16 34
100 – 199 19 34
200 – 499 27 45
500 + 32 61
TOTAL 12 27
6.5.10 Employers in the transport, public administration and other services and in
the distribution and consumer services sectors are more likely to have a
Trade Union learning representative and an NVQ assessor than those in
other sectors.
Table 41 Existence of Trade Union learning representatives and NVQ
assessors by sector of employer
Trade Union
learning representative NVQ assessor
% %
Manufacturing 5 18
Agriculture, mining, utilities,
construction 3 12
Distribution & consumer services 14 30
Finance & business services 3 12
Transport, public administration &
other services 19 40
TOTAL 12 27
Base/Coverage: all employers with 5 or more employees providing off-the-job training in the last 12 months – 2516
6.5.11 The existence of Trade Union learning representatives and NVQ assessors
varies by region as follows:
Table 42 Existence of Trade Union learning representatives and NVQ
assessors by Government Office region of employer
Trade Union
learning representative NVQ assessor
% %
North East 6 32
North West 13 30
Yorkshire and the Humber 21 36
East Midlands 11 28
West Midlands 12 27
Eastern 10 25
London 11 17
South East 9 20
South West 11 38
TOTAL 12 27
52
6.6
Types of Off-the-Job Training Provided
6.6.1 Employers who had provided off-the-job training over the past 12 months
were read a list of possible types of training and asked which ones they had
provided over this period.
As shown in the table below, health and safety and job specific training were
the types that had been provided by most employers over the previous 12
months.
There has been a slight decrease since the 2000 study in the proportion of
employers providing each type of training.
Fig 4
Types of off-the-job training provided at the location in the
last 12 months
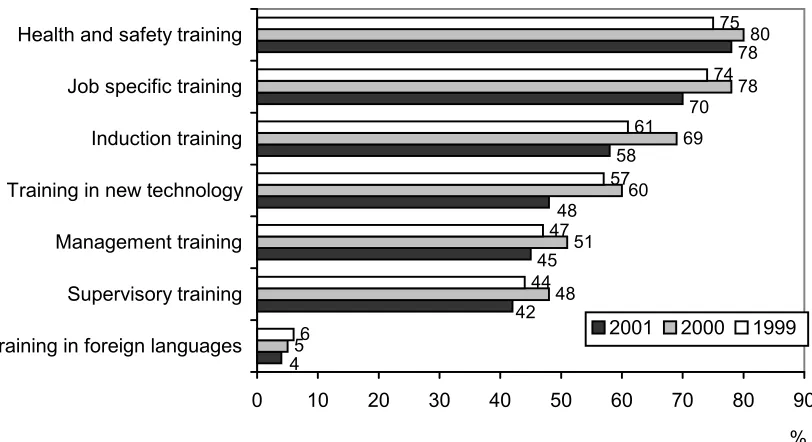
5 48 51 60 69 78 80 6 44 47 57 61 74 75 78 70 48 45 42 4 58
0 10 20 30 40 50 60 70 80 90
Training in foreign languages Supervisory training Management training Training in new technology Induction training Job specific training Health and safety training
%
2001 2000 1999
[image:54.595.92.498.278.499.2]6.6.2 The provision of all types of training increases with increasing employer size.
Table 43 Types of off-the-job training provided by size of employer
Total 5-24 25-99 100-199 200-499 500+ % % % % % %
Health and safety training 78 75 83 89 90 94
Job specific training 70 65 82 84 86 92
Induction training 58 51 74 81 82 90
Training in new technology 48 42 57 72 77 88
Management training 45 37 59 68 79 89
Supervisory training 42 35 55 68 73 87
Training in foreign languages 4 2 8 10 18 31
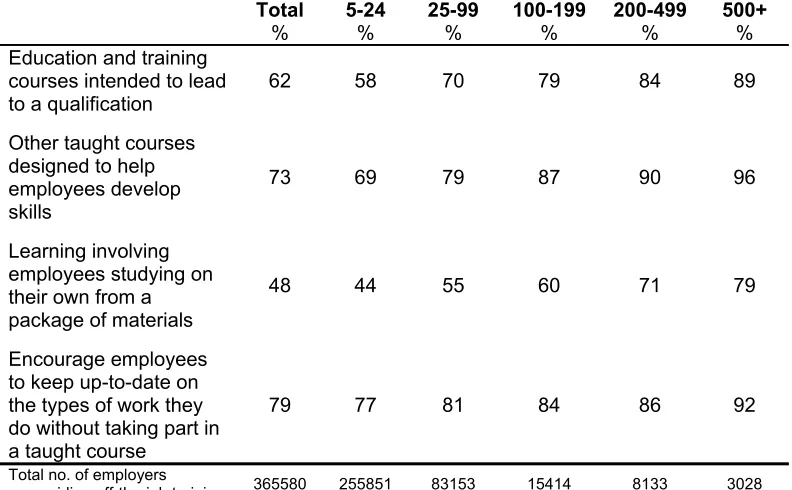
Total no. of employers providing off-the-job training 365580 255851 83153 15414 8133 3028 Base/Coverage: all employers with 5 or more employees providing off-the-job training in the
last 12 months – 2516
6.6.3 The table below shows the types of training provided in the last year by
industry sector of employer.
Table 44 Types of off-the-job training provided by industry sector of
employer
Total Manufac -turing Agric-ulture, mining, utilities, const-ruction Distribution & consumer services Finance & business services Transport, public admin, other services % % % % % %Health and safety training 78 79 81 78 70 83
Job specific training 70 63 64 65 72 76
Induction training 58 54 41 58 53 67
Training in new technology 48 39 38 38 59 53
Management training 45 37 28 48 39 51
Supervisory training 42 34 31 47 33 48
Training in foreign languages 4 8 1 5 4 4
54
6.6.4 In the 2001 survey, employers were asked what proportion of all the
off-the-job training undertaken, in terms of employee hours, each type of training
accounted for.
It can be seen from the results below that job specific and health and safety
training account for the most employee hours. It should however be borne in
mind that employers found the question difficult to answer – almost a third of
those providing off-the-job training were unable to do so. For this reason we
do not feel it prudent to show results by size, industry sector or region of
employer.
Table 45 Average proportion of off-the-job training that is of each
type
% of Trainee Hours
Health and safety training 28
Job specific training 32
Induction training 13
Training in new technology 13
Management training 8
Supervisory training 6
Training in foreign languages *
Base/Coverage: all employers with 5 or more employees providing off-the- job training in the last 12 months able to break down amount of training provided by type – 1717
6.7 Off-the-Job
Training
Leading to Formal Qualifications
6.7.1 Of those employers who provided off-the-job training, over half (55%)
reported that at least some of this training was leading to formal
qualifications. The equivalent figures in the 2000 and 1999 studies were
56% and 52% respectively.
6.7.2 As shown in the table below, a higher proportion of larger employers offered
training that was leading to formal qualifications.
Table 46 Employers offering off-the-job training leading to formal
qualifications by size of employer
1999 2000 2001 Total no. of employers providing % % % off-the-job training
5 – 24 48 51 50 255851
25 – 99 57 64 62 83153
100 – 199 66 73 71 15414
200 – 499 85 82 80 8133
500 + 89 90 84 3028
TOTAL 52 56 55 365580
Base/Coverage: all employers with 5 or more employees providing off-the-job training in the last 12 months – 2516
6.7.3 The provision of training leading to formal qualifications varied by industry
sector as shown below:
Table 47 Employers offering off-the-job training leading to formal
qualifications by industry sector of employer
1999 2000 2001 Total no. of employers providing
% % % off-the-job
training
Manufacturing 59 49 55 36574
Agriculture, mining, utilities, construction 58 62 49 30267
Distribution & consumer services 45 57 43 94220
Finance & business services 53 53 50 75899
Transport, public administration & other services 55 58 67 128619
TOTAL 52 56 55 365580
56
6.7.4 The proportion of employers in each region providing off-the-job training who
had provided training leading to formal qualifications is shown below:
Table 48 Employers offering off-the-job training leading to formal
qualifications by Government Office region of employer
1999 2000 2001 Total no. of employers providing % % % off-the-job training
North East 56 63 52 16999
North West 61 61 48 43806
Yorkshire and the Humber 50 59 60 38575
East Midlands 50 53 69 27770
West Midlands 54 57 66 41099
Eastern 57 57 50 41062
London 42 47 45 61904
South East 46 55 53 57647
South West 60 60 58 36718
TOTAL 52 56 55 365580
Base/Coverage: all employers with 5 or more employees providing off-the-job training in the last 12 months – 2516
6.7.5 Employers who stated that some of the off-the-job training they provided was
leading to formal qualifications were asked which of the following
qualifications it was leading to:
♦
NVQs/SVQs
♦
Other nationally recognised qualifications, eg RSA, BTEC, City and
Guilds
♦
Qualifications specific to the company
♦
Higher qualifications such as degrees
6.7.6 NVQs/SVQs were the types of qualification that off-the-job training was most
commonly leading to, followed by other nationally recognised qualifications
(52% and 43% of those providing training leading to qualifications
respectively).
Table 49 Types of formal qualification to which off-the-job training
leading
1999 2000 2001
% % %
NVQs/SVQs 49 55 52
Other nationally recognised qualifications 47 48 43
Higher qualifications such as degrees 25 28 27
Qualifications specific to company 30 35 26
6.8
Location of Off-the-Job Training
6.8.1 The most common location for providing off-the-job training was at a private
training centre (54% of employers providing off-the-job training), followed by
at an FE college (38%), at the employer’s establishment (36%) and at a
company training centre (24%).
Table 50 Location of off-the-job training
1999 2000 2001 % % %
Private training centre 53 65 54
FE college 38 39 38
Establishment interviewed 26 46 36
Organisation training centre 26 28 24
Other sites of organisation n/a n/a 16
Elsewhere 12 12 17
Base/Coverage: all employers with 5 or more employees providing off-the-job training in the last 12 months – 2516
6.8.2 The likelihood of using each location increased with increasing size of
employer.
Table 51 Location of off-the-job training by size of employer
Total 5-24 25-99 100-199 200-499 500+% % % % % %
Private training centre 54 51 57 64 69 75
FE college 38 33 44 52 64 69
Establishment interviewed 36 30 45 53 58 67
Organisation training centre 24 21 29 34 41 60
Other sites of organisation 16 12 20 29 30 36
El