Research Report No 269
Learning and Training at Work
2000
Table Of Contents
1 Introduction... 3
1.1 Background... 3
1.2 Aims and Objectives... 3
1.3 Methodology... 3
1.4 Sample Design ... 4
1.5 Comparison with Skill Needs in Britain Surveys ... 4
1.6 Reporting Conventions ... 5
2 Summary of Findings ... 9
2.1 Introduction ... 9
A) Learning and Training at Work 1999 and 2000 Surveys ... 10
2.2 Skill Needs and Recruitment Difficulties ... 10
2.3 Learning Opportunities and Facilities Available for Employees... 10
2.4 Provision of Off-the-Job Training ... 11
2.5 Management of Training and Training Delivery ... 11
2.6 Provision of On-the-Job Training... 12
2.7 Provision of Training and Reasons for Non-Provision... 12
2.8 Costs of Job-Related Training ... 12
2.9 Awareness of Training Initiatives... 13
2.10 NVQs ... 13
2.11 Investors in People... 13
2.12 Young Employees... 13
B) Comparison with SNIB 97 and 98 and Learning and Training at Work 1999 Surveys (ref. section 12) ... 14
2.13 Skill Needs and Recruitment Difficulties ... 14
2.14 Learning Opportunities and Facilities Available for Employees... 14
2.15 Provision of Off-the-Job Training ... 14
2.16 Management and Delivery of Off-the-Job Training ... 15
2.17 Provision of On-the-Job Training... 15
2.18 Awareness of, and Involvement with, Training Initiatives... 15
3 Skill Needs and Recruitment Difficulties ... 19
3.1 Introduction ... 19
3.2 Proficiency of Existing Staff ... 19
3.3 Changes in Skill Needs... 21
3.4 Recruitment Difficulties ... 23
4 Learning Opportunities and Facilities Available for Employees ... 27
4.1 Learning Opportunities Offered to Employees... 27
4.2 Helping Employees Learn Things not Directly Connected to their Jobs... 29
4.3 Existence of Staff Association and Trade Union Representation... 31
5 Provision of Off-the-Job Training ... 35
5.1 Introduction ... 35
5.2 Employers Who Provide Off-the-Job Training ... 35
5.3 Proportion of Employees Receiving Off-the-Job Training... 37
5.4 Amount of Off-the-Job Training Provided ... 38
6 Management and Delivery of Off-the-Job Training ... 45
6.1 Introduction ... 45
6.2 Existence of Business, Training and Human Resource Plans and Budgets ... 45
6.3 Form in Which Planning Tools Exist ... 48
6.4 Resources for Off-the-Job Training... 49
6.5 Types of Off-the-Job Training Provided ... 51
6.6 Off-the-Job Training Leading to Formal Qualifications ... 52
6.7 Types of Formal Qualification ... 54
6.8 Location of Off-the-Job Training ... 55
6.9 Satisfaction with Quality of Training Provided by Private Training Providers and FE Colleges... 56
6.10 Methods of Providing Off-the-Job Training... 57
7 Provision of On-the-Job Training ... 61
8 Provision of Job-Related Training and Reasons for Non-Provision ... 65
8.1 Introduction ... 65
8.2 Employers Providing Training ... 65
8.3 Reasons why Training not Provided over Previous 12 Months ... 68
9 Cost to Employers of Providing Job-Related Training ... 71
9.1 Introduction ... 71
9.2 Costs of Providing Training ... 71
9.3 Cost Components ... 74
9.4 Average costs per employee ... 75
9.5 Average costs per trainee... 76
10 Awareness Of, and Involvement with, Training Initiatives ... 81
10.1 Introduction ... 81
10.2 Awareness Of Training Initiatives... 81
10.3 Involvement with Training Initiatives in the Last 12 Months ... 84
10.4 Extent to which NVQs/SVQs Offered ... 88
10.5 Average Proportion of Employees to whom NVQs/SVQs on Offer ... 90
10.6 Level of Satisfaction with NVQs/SVQs... 92
10.7 Assessment of NVQs/SVQs ... 93
10.8 Investors in People ... 94
11 Young Employees Aged 16-24 ... 99
11.1 Employment of 16-24 Year Olds ... 99
11.2 Extent to which Qualifications Attained and being Worked towards by ... 16-24 Year Olds ... 102
12 Comparison with Skill Needs in Britain Surveys... 107
12.1 Introduction ... 107
12.2 Changing Level of Skill Needs... 107
13 Technical Appendix... 125
13.1 Sampling Approach ... 125
13.2 The Questionnaire... 125
13.3 Piloting and Method of Data Collection ... 125
13.4 The Respondent ... 126
13.5 Interviews Obtained and Response Rates... 126
13.6 Data Simulation ... 128
13.7 Calculation of Costs of Training... 131
13.8 Grossing-up ... 132
1 Introduction
1.1 Background
1.1.1 Learning and Training at Work (LTW) 2000 is the second in what is now an annual series of employer surveys that investigate the provision of learning and training at work. The survey also investigates awareness of, and involvement with, a number of existing and new training and development initiatives.
1.1.2 Learning and training information had previously been collected, along with information on recruitment difficulties, skill shortages and skill gaps, in the annual Skill Needs in Britain (SNIB) surveys, which were carried out between 1990 and 1998.
1.2
Aims and Objectives
1.2.1 The objectives of the 2000 Learning and Training at Work survey were to collect information about:
♦ Key indicators of employers’ commitment to training, including the volume of off-the-job training provided
♦ Awareness of, and involvement with, a number of initiatives relevant to training
♦ The costs associated with the provision of training
The information collected will be used to inform policy decision making.
1.3 Methodology
1.3.1 The survey consisted of 4,001 telephone interviews with employers having 1 or more employees at the specific location sampled. All business sectors, public and private, were covered.
1.3.2 It is not feasible to collect the costs of providing training reliably in a single stage telephone interview for two reasons:
♦ Reference may need to be made to written records
♦ The single respondent interviewed may need to refer to other people at the establishment.
1.3.3 This information was therefore collected through a two stage process:
4
1.3.7 In the 2000 study, the main stage of interviewing was carried out between 17 July and 20 October: in the 1999 study fieldwork took place between 3 November and 21 December. Readers may wish to bear in mind the fact that fieldwork in the two surveys was not carried out at the same time of year and that employers’ responses may be influenced by the timing of the fieldwork.
1.3.8 The average length of interview in the 2000 study, including the time taken to collect datasheet information, was 20 minutes.
1.3.9 The overall response rate to the main part of the survey from employers was 66%. The response rate for the datasheet element was 24%.
1.3.10 Fuller details of the methodology employed, in particular in relation to calculation of the costs of training, can be found in the Technical Appendix in Chapter 13.
1.4 Sample
Design
1.4.1 Sample design involved setting separate sample targets for each cell on a Government Office region by industry sector by establishment size matrix.
1.4.2 Results were grossed up at the analysis stage to population estimates derived from the 1998 Annual Employment Survey. Results are therefore representative of the 2.1 million employers in England who have 1 or more employees. It should be noted that data shown for all employers is heavily influenced by the results for employers with 1-4 employees as 72% of employers fall into this category.
1.5
Comparison with Skill Needs in Britain Surveys
1.5.1 As mentioned previously, the 1999 and 2000 Learning and Training at Work studies covered employers in establishments with 1 or more employees in all business sectors in England. Chapters 3-11 present comparative results from these studies, when appropriate, broken down by establishment size, industry sector and region.
1.5.2 The SNIB surveys covered employers with 25 or more employees in all business sectors, except agriculture, hunting, forestry and fishing, in Great Britain.
1.5.3 Fieldwork for the 1997 SNIB study was carried out between 8 May and 27 June 1997. In the 1998 SNIB study fieldwork was carried out between 5 May and 26 June.
1.5.4 Given this differing coverage, we have therefore run analyses on the SNIB and Learning and Training at Work data, based on all employers with 25 or more employees in all business sectors except agriculture, hunting, forestry and fishing, in England. This has allowed us to compare results from the two series of surveys. These results are provided in Chapter 13.
1.6 Reporting
Conventions
1.6.1 All data shown in this report are grossed up percentage data unless otherwise stated. The unweighted sample size from the 2000 study is shown at the foot of all tables to indicate to the reader the number of employers on whose responses the results are based. When appropriate, tables also show weighted figures for the number of employers in each industry sector, region or establishment size band, on which the percentages are based.
1.6.2 An asterisk has been used to signify a percentage of less than 0.5% and a – to indicate that a percentage is zero. In a few places the symbol 100* has been used – this indicates a percentage of more than 99.5%, which has been rounded up to 100%. Percentages may add to just over or under 100%, or absolute figures aggregated across sub-samples may not add exactly to the total, due to rounding. Where multiple answers were allowed the sum of the answers may exceed 100%.
1.6.3 In most cases percentages reported have been calculated on those employers asked the question. However in a few places, for reasons of clarity, percentages have been rebased. In the tables and figures in this report the word “coverage” has been used to describe the employers asked the question and the word “base” to describe employers on which the results have been reported.
1.6.4 Results refer to the 2000 Learning and Training at Work survey unless otherwise indicated. 1.6.5 Much of the information collected has been shown in tabular or graphical form with
appropriate written commentary on the findings. It is not the intention of this report to interpret findings.
1.6.6 When a question was asked of all employers, the results quoted are generally accurate, at 95% confidence levels, to +/- 1.5%. Results reported for subsamples are subject to larger margins of error.
1.6.7 This means that if one is looking at the results given for two surveys in two different years, the percentages based on all employers need to differ by a minimum of 4% for the apparent differences to be statistically significant at 95% confidence levels.
1.6.8 Results concerned with the number of days of off-the-job training provided are less accurate than other results due to the difficulties that employers have in providing this information. Results concerned with the costs of providing training are less accurate still due to the smaller number of responses from which the information has been calculated and the fact that many employers, through necessity, provided estimates rather than hard data. It is not possible to quote a precise level of accuracy but figures pertaining to the cost of training should be interpreted as best estimates rather than more definitive measurements.
2 Summary of Findings
2.1 Introduction
2.1.1 Learning and Training at Work 2000 is the second in an annual series of surveys amongst employers that investigates the provision of learning and training at work.
2.1.2 The objectives of the study were to collect information about:
♦ Key indicators of employers’ commitment to training, including the volume of off-the-job training provided
♦ Employers’ awareness of, and involvement with, a number of initiatives relevant to training.
♦ The costs associated with the provision of training.
2.1.3 The survey consisted of 4,001 telephone interviews with employers having 1 or more employee at the location sampled. All business sectors, private and public, were covered. Only employers in England were interviewed.
2.1.4 Information pertaining to the costs of training was collected through use of a datasheet. Employers who had provided training over the previous 12 months were sent a datasheet at the end of the interview and asked to complete this. They were then recalled by telephone and the information collected. Responses to this element of the study were obtained from 924 employers, of which those from 883 employers were useable in analysis. Because only a small number of datasheets were obtained from employers with 1-9 employees, it was not possible to project results from this group up to national estimates reliably. Therefore data pertaining to the costs of training relate to the 711 employers with 10 or more employees who returned the datasheet.
2.1.5 Much of the information collected in the Learning and Training at Work surveys had previously been collected in the annual Skill Needs in Britain (SNIB) surveys. The SNIB surveys covered employers in Great Britain with 25 or more employees. All business sectors with the exception of agriculture, hunting, forestry and fishing were covered.
2.1.6 As well as providing results from all employers interviewed on this and the 1999 Learning and Training at Work studies (sections 2.2–2.12), we have reanalysed the results from these two surveys and from the previous two SNIB studies so that comparative results over the last 4 years can be shown (sections 2.13-2.18). This data relates to employers in England with 25 or more employees in all business sectors except agriculture, hunting, forestry and fishing.
10
A)
Learning and Training at Work 1999 and 2000 Surveys
2.2
Skill Needs and Recruitment Difficulties
2.2.1 Over eight out of ten employers (84%) in the 2000 study felt that all or nearly all of their existing staff were fully proficient at their current job. This compares with the 88% reported in the 1999 study. (ref. section 3.2)
2.2.2 Three out of five employers (61%) believed that the skills needed in their average employee were increasing. In the 1999 study the proportion was very similar at 62%. (ref. section 3.3) 2.2.3 One in six employers (17%) in the 2000 study was experiencing a hard-to-fill vacancy at the
time of interview. This represents an increase over the 10% of employers who were doing so in the 1999 study. (ref. section 3.4)
2.3
Learning Opportunities and Facilities Available for Employees
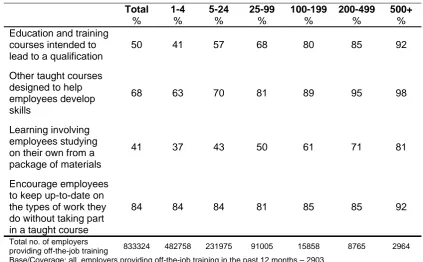
2.3.1 Almost two-thirds (63%) of employers in 2000 offered at least one of eight nominated types of learning opportunity. Learning in information technology (43%) and in managing their own development (41%) were the most commonly offered. (ref. section 4.1)
2.3.2 In the 1999 study a smaller proportion of employers (45%) offered a learning opportunity. Learning in information technology was again the most commonly offered (32%). (ref. section 4.1)
2.3.3 Over a quarter of employers (28%) in the 2000 study helped employees learn skills not directly connected to their job. This is the same proportion as reported in the 1999 study. (ref. section 4.2)
2.4
Provision of Off-the-Job Training
2.4.1 Off-the-job training had been provided by two out of five employers (41%) over the previous 12 months. This represents an increase over the 34% reported in the 1999 study. (ref. section 5.2)
2.4.2 Overall, in the 2000 study, 26% of employees had received off-the-job training over the previous 12 months. This compares with the 22% who had done so in the 1999 study. (ref. section 5.3)
2.4.3 Over the last 12 months, in the 2000 study, employees receiving off-the-job training had on average received 8.2 days each. This equates to an average 2.2 days being provided per employee. The equivalent figures in the 1999 study were 8.6 days per employee trained and 1.9 days per employee. (ref. section 5.4)
2.5
Management of Training and Training Delivery
2.5.1 In the 2000 study, over half of employers (60%) possessed a business plan, two out of five (39%) had a training plan, over a quarter (27%) had a training budget and just under a quarter (24%) a human resource plan. (ref. section 6.2)
2.5.2 All four tools were more likely to be held as formal written documents than as something less formal. (ref. section 6.3)
2.5.3 Over two-thirds (71%) of employers who had provided off-the-job training over the previous 12 months had a member of senior management with responsibility for training within the organisation (1999 study : 67%). Staff to design and teach training courses and a separate training facility existed in 32% and 23% of organisations respectively.
(1999 study : 30% and 23%) (ref. section 6.4)
2.5.4 In the 2000 study, job specific and health and safety training were the types of training that had most commonly been provided by employers (each 69% of those who had provided off-the-job training). Around half had provided training in new technology and induction training (each 52%). (ref. section 6.5)
12
2.6
Provision of On-the-Job Training
2.6.1 Overall, two-thirds of employers (66%) had carried out on-the-job training in the previous 12 months. This compares with the 58% reported in the 1999 study. (ref. section 7.1)
2.6.2 Training by a line manager or supervisor (78% of those carrying out on-the-job training) and training by other experienced staff in the company (56%) were the most common methods of providing on-the-job training in both years. (ref. section 7.1)
2.7
Provision of Training and Reasons for Non-Provision
2.7.1 In the 2000 study, three-quarters of employers (76%) had provided employees at the location with either off-the-job or on-the-job training. This compares with the 68% reported in the 1999 study. (ref. section 8.2)
2.7.2 By far the most common reason for not having provided training was that employers felt the skills possessed by their employees currently met needs, so training was not necessary (ref. section 8.3)
2.8
Costs of Job-Related Training
2.8.1 The total cost to employers with 10 or more employees of providing job-related training over the previous 12 months is estimated to be £23.5bn. (ref. section 9.2)
2.8.2 Of this figure, off-the-job training accounts for £14.5bn, of which £11.8bn relates to training courses and £2.8bn to other forms of off-the-job training such as seminars and workshops, and on-the-job training accounts for £9.0bn. (ref. section 9.2)
2.8.3 The average cost per employee of providing training was £1024. The average cost per employee of providing off-the-job training was £632 and of on-the-job training £393. (ref. section 9.4)
2.9
Awareness of Training Initiatives
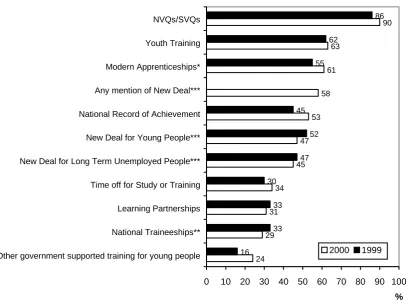
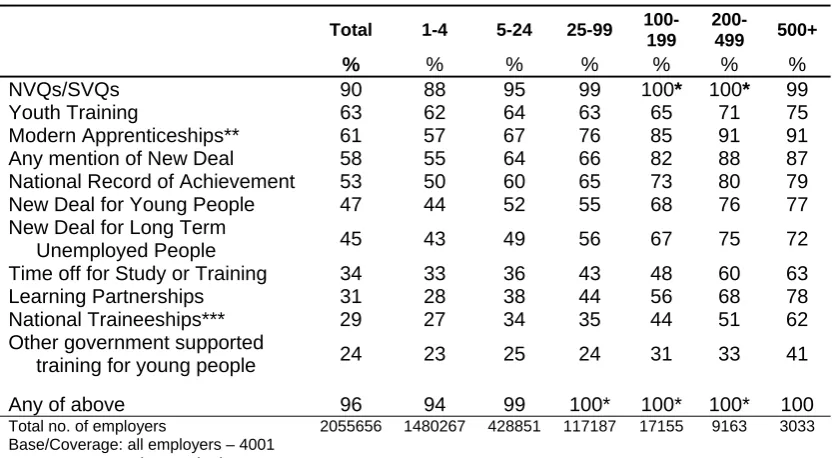
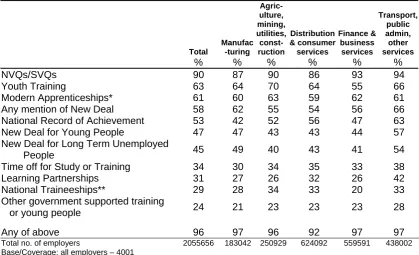
2.9.1 NVQs are the initiative with the highest level of awareness amongst employers, with a large majority (90%) having heard of them (1999 study : 86%). At least half had heard of Youth Training (63%), Modern Apprenticeships (recently relaunched as Advanced Modern Apprenticeships) (61%) and the National Record of Achievement (53%). (1999 study : 62%, 55% and 45% respectively) (ref. section 10.2)
2.10 NVQs
2.10.1 In the 2000 study, 18% of employers aware of NVQs were currently offering the qualification to at least some of their employees. This is slightly higher than the 16% who were doing so in the 1999 study. (ref. section 10.4)
2.10.2 In the 2000 study, where NVQs were on offer, they were on offer to 39% of employees. This equates to the qualification being offered to 17% of employees overall. (ref. section 10.5)
2.10.3 Three-quarters of employers (75%) who offer NVQs were either very or fairly satisfied with them (1999 study : 78%). This high level of satisfaction mainly stems from a feeling that the qualification had improved the level of knowledge of their workforce. (ref. section 10.6) 2.10.4 Approaching two-thirds (62%) of employers offering NVQs felt that the quality of
assessment was either very or fairly good. The equivalent figure in the 1999 study was 61%. (ref. section 10.7)
2.11 Investors in People
2.11.1 Sixteen percent of employers in the 2000 study reported that their establishment had been formally recognised as an Investor in People (no equivalent data for 1999 available). (ref. section 10.8)
2.12 Young
Employees
2.12.1 Approaching half of employers (45%) employed 16-24 year olds, with 20-24 year olds being most commonly employed (1999 study : 37%). (ref. section 11.1)
14
B)
Comparison with SNIB 97 and 98 and Learning and Training at Work
1999 Surveys
(ref. section 12)
The figures for 1999 and 2000 are often substantially different to the figures that have been reported in sections 2.2 to 2.12, as the large number of small employers that dominated the full LTW weighted results are excluded here.
2.13 Skill Needs and Recruitment Difficulties
2.13.1 Over the past four years, around 70% of employers believed that the skills needed by their average employee in order to meet their business objectives have increased.
2.13.2 The proportion of employers experiencing a hard-to-fill vacancy at the time of interview was 18% in the 1997 study, 24% in the 1998 study, 23% in the 1999 study, and 30% in the 2000 study.
2.14 Learning Opportunities and Facilities Available for Employees
(data not available from the 1997 study)2.14.1 The proportion of employers offering one of eight specified learning opportunities to employees has increased from 67% in the 1998 study to 75% in the 1999 study to 86% in the 2000 study.
2.14.2 The proportion of employers having a staff association or trade union representation was 28% in the 1998 study, 37% in the 1999 study and 32% in the 2000 study.
2.15 Provision of Off-the-Job Training
2.15.1 Information on the provision of off-the-job training collected in the 1999 and 2000 studies may not be strictly comparable with that obtained in the 1997 and 1998 surveys due to a change in question wording that may have led to 1999 and 2000 figures being underestimates.
2.15.2 The proportion of employers reporting that they had provided off-the-job training over the previous 12 months was very similar in the 1997, 1998 and 2000 studies (82%, 83% and 81% respectively). It was lower in the 1999 study at 75%.
2.15.3 The proportion of employees who had received off-the-job training declined between 1997 and 1999 from the 41% reported in 1997 slightly to 38% in the 1998 study to 24% in the 1999 study. In the 2000 study the proportion has increased slightly to 28%.
2.16 Management and Delivery of Off-the-Job Training
2.16.1 The proportion of employers reporting that they have a training plan has increased from 65% in the 1997 study to 72% in the 2000 study. The proportion having a training budget has increased from 63% to 69% over this period.
2.16.2 The proportion of employers having a separate training facility has increased from 30% in the 1997 study to 38% in the most recent study. The proportion having staff to design and teach training courses has increased from 39% to 50% between the 1998 (the first year for which data are available) and the 2000 studies.
2.16.3 The proportion of employers who have provided off-the-job training over the previous twelve months reporting that at least some of this training was leading to formal qualifications remained constant between the 1997 and 1998 studies at 65%, declined slightly to 62% in 1999 and has increased to 67% in the most recent study.
2.17 Provision of On-the-Job Training
2.17.1 In the 1998 study nine out of ten employers (90%) reported that they had carried out on-the-job training in the previous twelve months. The figure in the 1999 study was 86% and in the 2000 study 90%. ( data not available from the 1997 study).
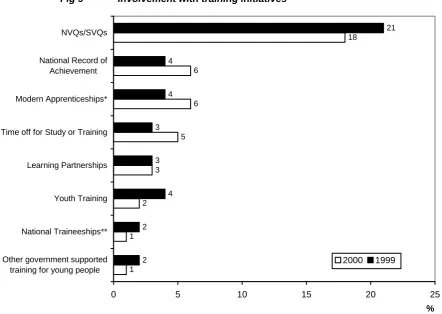
2.18 Awareness of, and Involvement with, Training Initiatives
2.18.1 Awareness of NVQs has been high in all four years, ranging from 96% in the 1997 study to 99% in the 2000 study. Awareness of Modern Apprenticeships (recently relaunched as Advanced Modern Apprenticeships) has been around 75% in all four years, ranging from 72% in the 1999 study to 78% in the 2000 study.
2.18.2 The proportion of employers involved with NVQs was 52% in 1997, 50% in 1998, 58% in 1999 and 48% in the most recent study. Equivalent figures for Modern Apprenticeships are 15%, 15%, 18% and 17%.
2.18.3 The proportion of employers aware of NVQs who were offering the qualification to employees at the time of interview was 41% in the 1997 study, 47% in the 1999 study and 43% in the most recent study (equivalent data are not available from the 1998 study).
3
Skill Needs and Recruitment Difficulties
3.1 Introduction
3.1.1 This section explores employers’ views on the proficiency of their existing staff, whether they felt the skills required to ensure the effective operation of their business were increasing, decreasing or static, and whether or not they were experiencing a hard-to-fill vacancy at the time of interview.
3.2
Proficiency of Existing Staff
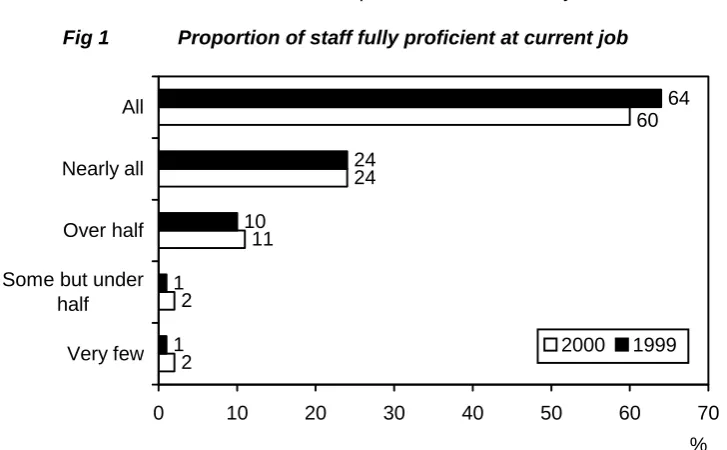
3.2.1 Over eight out of ten employers (84%) felt that all or nearly all of their existing staff were fully proficient at their current job. It should be noted that no definition of “proficiency at their current job” was given to employers.
The results are similar to those reported in the 1999 study. Fig 1 Proportion of staff fully proficient at current job
2 2
11
24
1 1
10
24
64 60
0 10 20 30 40 50 60 70
Very few Some but under
half Over half Nearly all All
% 2000 1999
[image:23.595.91.455.282.507.2]20
3.2.2 In the 2000 study, as the size of the establishment increases, the proportion of employers feeling that all staff are fully proficient declines.
Table 1 Proportion of staff fully proficient at current job by size of employer
Total 1-4 5-24 25-99 100-199 200-499 500+
% % % % % % %
All 60 72 36 19 13 13 10
Nearly all 24 16 40 53 64 59 58
Over half 11 8 18 22 20 25 25
Some but under half 2 2 3 4 3 1 2
Very few 2 2 3 1 1 - *
Not stated 1 1 * 1 1 2 5
Total no. of employers 2055656 1480267 428851 117187 17155 9163 3033 Base/Coverage: all employers – 4001
3.2.3 In the 2000 study, employers in the manufacturing sector were most likely to indicate a lack of proficiency amongst their existing staff.
Table 2 Proportion of staff fully proficient at current job by industry sector of employer Total Manufac-turing Agriculture mining, construction, utilities Distribution & consumer services Finance & business services Transport, public admin, other services % % % % % %
All 60 49 67 59 66 55
Nearly all 24 29 20 24 21 28
Over half 11 13 8 12 10 12
Some but under half 2 4 2 2 2 2
Very few 2 3 1 2 2 1
Not stated 1 1 1 1 * 1
Total no. of employers 2055656 183042 250929 624092 559591 438002
Base/Coverage : all employers – 4001
3.2.4 Results for the 2000 study are shown by region below:
Table 3 Proportion of staff fully proficient at current job by Government Office region of employer
Total North East North West Yorkshire and the Humber East Midlands West
Midlands Eastern London South
East South
West
% % % % % % % % % %
All 60 49 54 54 56 62 57 60 71 64
Nearly all 24 25 28 24 28 17 29 23 19 27
Over half 11 18 10 15 12 16 10 13 6 8
Some but under half 2 5 2 3 4 1 1 3 2 1
Very few 2 3 2 3 * 4 3 1 1 *
Not stated 1 * 4 1 * * * 1 * 1
3.3
Changes in Skill Needs
3.3.1 Three out of five employers (61%) believed that the skills needed in their average employee were increasing.
This figure is very similar to that reported in the 1999 study – 62%. Fig 2 Skills needed in average employee
4 4
32
62
33
61
0 10 20 30 40 50 60 70
Decreasing Static Increasing
%
2000 1999
Base/Coverage : all employers – 4001
3.3.2 The table below shows the general trend that the larger the employer the more likely they were to feel the skills required of an average employee were increasing.
Table 4 Increasing skill needs in average employee by size of employer
1999 2000 Total no
% % of employers
1-4 60 58 1480267
5-24 65 67 428851
25-99 71 69 117187
100 – 199 72 71 17155
200 – 499 71 76 9163
500 + 77 84 3033
TOTAL 62 61 2055656
22
3.3.3 The transport, public administration and other services and the finance and business services sectors are the sectors in which the highest proportion of employers felt the skill needs of their average employee were increasing
Table 5 Increasing skill needs in average employee by industry sector of employer
1999 2000 Total no.
% % of employers
Manufacturing 56 62 183042
Agriculture, mining, utilities & construction 60 52 250929
Distribution & consumer services 55 50 624092
Finance & business services 73 66 559591
Transport, public admin & other services 63 73 438002
TOTAL 62 61 2055656
Base/Coverage: all employers - 4001
3.3.4 The proportion of employers in each region feeling that the skills needed in their average employee were increasing is shown below.
Table 6 Increasing skill needs in average employee by Government Office region of employer
1999 2000 Total no.
% % of employers
North East 52 54 71976
North West 60 63 245697
Yorkshire and the Humber 57 68 179373
East Midlands 65 62 161272
West Midlands 58 56 200189
Eastern 60 61 233332
London 63 64 382198
South East 70 55 366035
South West 64 59 215584
TOTAL 62 61 2055656
3.4 Recruitment
Difficulties
3.4.1 Employers were asked whether or not they were experiencing a hard-to-fill vacancy at the time of interview.
It should be noted that no formal definition of hard-to-fill vacancy was given to employers – it was left to each individual employer to interpret the phrase as they saw fit.
3.4.2 Overall, one in six employers (17%) reported a hard-to-fill vacancy at the time of interview. This represents an increase over the level reported in the 1999 study when 10% of employers did so.
3.4.3 In both the 1999 and the 2000 studies, the existence of hard-to-fill vacancies increased with increasing size of employer. This is what would be expected intuitively as larger employers are more likely to have a hard-to-fill vacancy simply because they employ more people. Table 7 Existence of current hard-to-fill vacancies by size of employer
1999 2000 Total no
% % of employers
1-4 7 15 1480267
5-24 16 20 428851
25-99 23 29 117187
100-199 26 35 17155
200-499 29 32 9163
500+ 29 42 3033
TOTAL 10 17 2055656
Base/Coverage: all employers - 4001
3.4.4 In the 2000 study, employers in the distribution and consumer services sector were experiencing the highest level of hard-to-fill vacancies at the time of interview.
Table 8 Existence of current hard-to-fill vacancies by industry sector of employer
1999 2000 Total no.
% % of employers
Manufacturing 15 17 183042
Agriculture, mining, utilities & construction 9 16 250929
Distribution & consumer services 12 20 624092
Finance & business services 8 14 559591
Transport, public admin & other services 11 18 438002
TOTAL 10 17 2055656
24
3.4.5 In the 2000 study employers in the East Midlands, the South East and in Yorkshire and the Humber were more likely to report a hard-to-fill vacancy at the time of interview than the national average.
Table 9 Existence of current hard-to-fill vacancies by Government Office region of employer
1999 2000 Total no.
% % of employers
North East 4 13 71976
North West 15 14 245697
Yorkshire and the Humber 7 20 179373
East Midlands 4 26 161272
West Midlands 10 9 200189
Eastern 10 15 233332
London 9 17 382198
South East 14 22 366035
South West 10 14 215584
TOTAL 10 17 2055656
4
Learning Opportunities and Facilities Available for
Employees
4.1
Learning Opportunities Offered to Employees
4.1.1 Employers were asked which, if any, of a number of learning opportunities they offered to employees at the location.
4.1.2 Overall, almost two-thirds (63%) offered at least one of the eight types of learning opportunity discussed. Learning in information technology (43%), managing their own development (41%) and working with others (38%) were the types most commonly offered. The proportion of employers offering learning opportunities has increased considerably since the 1999 study when only 45% did so. All eight types of learning opportunity are now being offered by more employers.
Fig 3 Learning opportunities offered
11 11
19
32 34
38 41
43
9 9
14
23 24
27 32 25
0 10 20 30 40 50
Basic literacy Basic numeracy Application of numbers Problem solving Communication Working with others Managing own development Information technology
% 2000 1999
28
4.1.3 The tendency to offer all eight types of learning opportunity increased with increasing employer size.
Table 10 Learning opportunities offered by size of employer
Total 1-4 5-24 25-99 100-199
200-499 500+ % % % % % % % Information technology 43 38 51 67 80 88 94 Managing own development 41 36 47 61 68 75 85
Working with others 38 32 49 62 68 79 86
Communication (through either
Written work or oral presentation) 34 29 41 57 68 77 87
Problem solving 32 28 40 51 60 64 80
Application of numbers 19 18 23 26 28 37 44
Basic numeracy 11 9 13 15 19 29 36
Basic literacy 11 10 12 15 18 30 37
Any of the above 63 58 73 84 91 96 99
Total no. of employers 2055656 1480267 428851 117187 17155 9163 3033
Base/Coverage: all employers – 4001
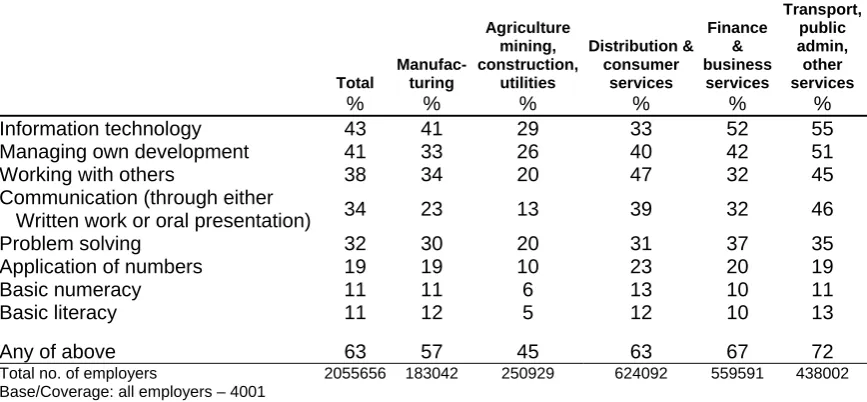
4.1.4 Employers in the transport, public administration and other services and in the finance and business services sectors were more likely to offer a wider range of learning opportunities than those in other sectors.
Table 11 Learning opportunities offered by industry sector of employer
Total Manufac-turing Agriculture mining, construction, utilities Distribution & consumer services Finance & business services Transport, public admin, other services % % % % % %
Information technology 43 41 29 33 52 55 Managing own development 41 33 26 40 42 51
Working with others 38 34 20 47 32 45
Communication (through either
Written work or oral presentation) 34 23 13 39 32 46
Problem solving 32 30 20 31 37 35
Application of numbers 19 19 10 23 20 19
Basic numeracy 11 11 6 13 10 11
Basic literacy 11 12 5 12 10 13
Any of above 63 57 45 63 67 72
Total no. of employers 2055656 183042 250929 624092 559591 438002
Base/Coverage: all employers – 4001
[image:32.595.103.537.398.599.2]4.2
Helping Employees Learn Things not Directly Connected to their Jobs
4.2.1 Employers were asked whether they helped employees learn things not directly connected to their job.
4.2.2 In both the 2000 and the 1999 studies over a quarter of employers (28%) did so.
4.2.3 The proportion of employers who offer employees learning opportunities not directly connected to employees’ jobs, broadly speaking, increases with increasing size of employer.
Table 12 Offer of learning activities not directly connected to employees’ jobs by size of employer
1999 2000 Total no.
% % of employers
1-4 28 27 1480267
5-24 27 32 428851
25-99 33 30 117187
100-199 36 36 17155
200-499 45 49 9163
500+ 51 53 3033
TOTAL 28 28 2055656
Base/Coverage: all employers -4001
4.2.4 Employers in service sectors are more likely to offer these learning opportunities than those in other sectors.
Table 13 Offer of learning activities not directly connected to employees’ jobs by industry sector of employer
1999 2000 Total no.
% % of employers
Manufacturing 23 28 183042
Agriculture, mining, utilities & construction 19 23 250929
Distribution & consumer services 24 29 624092
Finance & business services 33 28 559591
Transport, public admin & other services 36 32 438002
TOTAL 28 28 2055656
30
4.2.5 The proportion of employers offering these learning opportunities varies by region as shown below.
Table 14 Offer of learning activities not directly connected to employees’ jobs by Government Office region of employer
1999 2000 Total no
% % of employers
North East 31 32 71976
North West 30 28 245697
Yorkshire and the Humber 37 21 179373
East Midlands 35 30 161272
West Midlands 20 29 200189
Eastern 21 22 233332
London 23 29 382198
South East 36 33 366035
South West 26 30 215584
TOTAL 28 28 2055656
4.3
Existence of Staff Association and Trade Union Representation
4.3.1 Employers were asked whether or not they had staff association or trade union representation at the location and, if so, whether representatives were involved in promoting or providing learning or training opportunities.
4.3.2 In the 2000 study, 7% of employers reported that they had trade union or staff association representation : the comparable figure in the 1999 study was 8%.
4.3.3 Staff association or trade union representation is much more likely to exist in larger establishments than in smaller ones.
Table 15 Existence of staff association or trade union representation by size of employer
1999 2000 Total no.
% % of employers
1-4 4 4 1480267
5-24 11 8 428851
25-99 32 26 117187
100-199 47 44 17155
200-499 61 62 9163
500+ 76 78 3033
TOTAL 8 7 2055656
Base/Coverage: all employers – 4001
4.3.4 Staff association or trade union representation is considerably more likely to exist in the transport, public administration and other services sector than in other sectors.
Table 16 Existence of staff association or trade union representation by industry sector of employer
1999 2000 Total no.
% % of employers
Manufacturing 8 7 183042
Agriculture, mining, utilities & construction 4 2 250929
Distribution & consumer services 5 4 624092
Finance & business services 4 5 559591
Transport, public admin & other services 19 16 438002
TOTAL 8 7 2055656
32
4.3.5 London is the region in which the existence of staff association or trade union representation is greatest.
Table 17 Existence of staff association or trade union representation by Government Office region of employer
1999 2000 Total no.
% % of employers
North East 11 8 71976
North West 9 6 245697
Yorkshire and the Humber 8 6 179373
East Midlands 7 3 161272
West Midlands 9 5 200189
Eastern 6 5 233332
London 8 14 382198
South East 7 5 366035
South West 10 5 215584
TOTAL 8 7 2055656
Base/Coverage: all employers – 4001
4.3.6 In both studies, staff association and trade union representatives were most likely to be involved in promoting learning or training opportunities than in formally discussing or providing them.
Table 18 Ways in which staff association and trade unions involved
1999 2000 % % Promoting learning or training opportunities with employers 36 42 Formally discussing learning or training opportunities with employers 35 38 Directly providing learning or training opportunities with employers 23 21
5
Provision of Off-the-Job Training
5.1 Introduction
5.1.1 In this section we explore:
♦ the proportion of employers who have provided off-the-job training over the previous 12 months
♦ the types of employer who were most likely to provide off-the-job training
♦ the proportion of employees who received off-the-job training
♦ the amount of off-the-job training provided
♦ the occupational groups most likely to have received off-the-job training
5.1.2 It was explained to employers that:
“... by off-the-job training, we are including all training away from the immediate work position. It can be given at your premises or elsewhere. It includes all sorts of courses - full or part time; correspondence or distance learning; health and safety training and so on - as long as it is funded or arranged by you”.
5.2
Employers Who Provide Off-the-Job Training
5.2.1 The survey indicates that two out of five employers (41%) have provided off-the-job training to at least some of their employees over the previous 12 months. This represents an increase of seven percentage points since the 1999 study when 34% of employers had provided off-the-job training over the previous 12 months.
This increase is not unexpected but it should be noted that the magnitude of the increase is greater than that indicated by other sources such as the Labour Force Survey.
5.2.2 The following table shows that the proportion of employers providing off-the-job training increases with increasing employer size and that there has been an increase since the 1999 study in the proportion amongst all sizes of employer.
Table 19 Provision of off-the-job training by size of employer
1999 2000 Total no.
% % of employers
1-4 25 33 1480267
5-24 47 54 428851
25-99 72 78 117187
36
5.2.3 Employers in the transport, public administration and other services sector (54%) were most likely to have provided off-the-job training and those in the distribution and consumer services sector least likely to have done so (32%).
There has been an increase in the proportion of employers providing off-the-job training since the 1999 study in all industry sectors.
Table 20 Provision of off-the-job training by industry sector of employer
1999 2000 Total no.
% % of employers
Manufacturing 30 44 183042
Agriculture, mining, utilities, construction 31 35 250929
Distribution & consumer services 25 32 624092
Finance & business services 38 41 559591
Transport, public administration and other services 42 54 438002
TOTAL 34 41 2055656
Base/Coverage: all employers – 4001
5.2.4 The provision of off-the-job training by employers in the last year was highest in Yorkshire and the Humber (48%) and lowest in the West Midlands and Eastern regions (37%).
There has been an increase since the 1999 study in the proportion of employers who have provided off-the-job training over the previous 12 months in all regions except the South West.
Table 21 Provision of off-the-job training by Government Office region of employer
1999 2000 Total no.
% % of employers
North East 34 42 71976
North West 34 46 245697
Yorkshire and the Humber 37 48 179373
East Midlands 42 46 161272
West Midlands 31 37 200189
Eastern 34 37 233332
London 28 38 382198
South East 32 39 366035
South West 41 39 215584
TOTAL 34 41 2055656
5.3
Proportion of Employees Receiving Off-the-Job Training
5.3.1 Overall, 26% of employees had received off-the-job training over the previous 12 months. This represents an increase over the 22% reported in the 1999 study.
5.3.2 The proportion of employees trained initially increases with increasing establishment size, reaching a peak amongst establishments with 100-199 employees and then decreases as establishments become larger.
There has been an increase since the 1999 study in the proportion of employees trained in all sizes of establishment except the very largest.
Table 22 Proportion of employees receiving off-the-job training by size of employer
1999 2000
% %
1-4 16 22
5-24 23 27
25-99 28 33
100 - 199 25 36
200 - 499 25 35
500 + 20 16
TOTAL 22 26
Base/Coverage: all employers providing off-the-job training over the previous 12 months – 2903
5.3.3 The proportion of employees trained was highest in the transport, public administration and other services sector and lowest in the manufacturing sector.
There has been an increase in the proportion of employees trained since the 1999 study in all industry sectors.
Table 23 Proportion of employees receiving off-the-job training by industry sector of employer
1999 2000
% %
Manufacturing 18 22
Agriculture, mining, utilities, construction 21 28 Distribution & consumer services 17 25 Finance & business services 22 28 Transport, public administration & other services 27 29
TOTAL 22 26
38
5.3.4 There was little difference by region in the proportion of employees who had received off-the-job training over the previous year.
Table 24 Proportion of employees receiving off-the-job training by Government Office region of employer
1999 2000
% %
North East 26 26
North West 21 28
Yorkshire and the Humber 21 28
East Midlands 21 26
West Midlands 17 25
Eastern 20 28
London 21 27
South East 25 24
South West 27 26
TOTAL 22 26
Base/Coverage: all employers providing off-the-job training over the previous 12 months – 2903
5.4
Amount of Off-the-Job Training Provided
5.4.1 Employers were asked to estimate the number of days off-the-job training they had provided per employee trained. When using these figures it should be borne in mind that these figures may be subject to a greater degree of inaccuracy than other non-cost related data in this report.
5.4.2 Over the last 12 months, employees receiving off-the-job training had, on average, received 8.2 days each. This equates to an average of 2.2 days being provided per employee. The equivalent figures in the 1999 study were 8.6 days per employee trained and 1.9 days per employee.
An explanation of the, at first sight apparently odd, fact that one measure has increased since the 1999 study whilst the second has declined can be found in the way that the per employee figure is calculated. The per employee figure uses (i) the proportion of employees receiving off-the-job training (0.26) and (ii) the number of days of off-the-job training provided per trainee (8.2) as part of the calculation. The reason is that since 1999, the proportion receiving training has increased by a greater margin than the number of days of off-the-job training provided per trainee.
5.4.4 The average number of days training provided by establishments of various sizes is shown in the two tables below.
It can be seen from Table 25 that the average number of days reaches a peak amongst establishments with 100-199 employees and then declines.
Table 25 Average number of training days per employee trained by size of employer
1999 2000
1-4 7.3 8.2
5-24 10.4 8.2
25 – 99 9.4 8.2
100 – 199 9.4 8.7
200 – 499 9.4 6.8
500 + 8.6 6.5
TOTAL 8.6 8.2
Base/Coverage: all employers providing off-the-job training over the previous 12 months - 2903
Table 26 Average number of training days per employee by size of employer
1999 2000
1 – 4 1.2 1.8
5 – 24 2.4 2.2
25 – 99 2.7 2.7
100 – 199 2.3 3.1
200 – 499 2.3 2.4
500 + 1.7 1.1
TOTAL 1.9 2.2
40
5.4.5 The average number of training days provided by employers in each industry sector is shown in the next two tables.
It can be seen from Table 27 that trainees in the agriculture, mining, utilities and construction and in the finance and business services sectors had received the most training.
Table 27 Average number of training days per employee trained by industry sector of employer
1999 2000
Manufacturing 11.4 8.4
Agriculture, mining, utilities, construction 8.9 10.4 Distribution & consumer services 9.6 6.1 Finance & business services 6.5 9.2 Transport, public admin & other services 9.3 8.1
TOTAL 8.6 8.2
Base/Coverage : all employers providing off-the-job training over the previous 12 months – 2903
Table 28 Average number of training days per employee by industry sector of employer
1999 2000
Manufacturing 2.0 1.8
Agriculture, mining, utilities, construction 1.9 2.3 Distribution & consumer services 1.6 2.0 Finance & business services 1.4 2.4 Transport, public admin & other services 2.6 1.9
TOTAL 1.9 2.2
5.4.6 As shown in Table 29, trainees in the North East region had received the highest number of days training in the last year. Trainees in the Eastern, South East and North West regions had received the least.
Table 29 Average number of training days per employee trained by Government Office region of employer
1999 2000
North East 10.0 11.9
North West 9.2 6.3
Yorkshire and the Humber 8.0 8.3
East Midlands 9.7 8.2
West Midlands 9.7 9.1
Eastern 5.2 6.0
London 9.0 10.0
South East 7.7 6.3
South West 10.3 10.7
TOTAL 8.6 8.2
Base/Coverage: all employers providing off-the-job training over the previous 12 months – 2903
Table 30 Average number of training days per employee by Government Office region of employer
1999 2000
North East 2.6 3.1
North West 2.0 1.7
Yorkshire and the Humber 1.7 2.3
East Midlands 2.0 2.2
West Midlands 1.7 2.2
Eastern 1.0 1.7
London 1.9 2.7
South East 1.9 1.5
South West 2.8 2.8
TOTAL 1.9 2.2
42
5.5
Occupations Receiving Off-the-Job Training
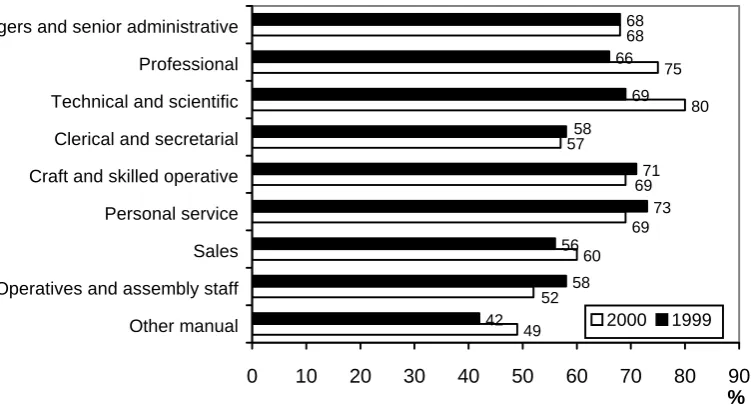
5.5.1 The table below shows the proportion of employers employing each occupational group who had provided employees in that occupational group with off-the-job training in the last 12 months.
Technical and scientific staff are most likely to have received off-the-job training : other manual staff the least likely.
Since the 1999 study there has been a noticeable increase in training activity amongst the technical and scientific and professional occupational groups.
Fig 4 Occupations receiving off-the-job training
49 60 57
80 75
42
58 56
73 71 69 66
68
69
52
69 68
58
0 10 20 30 40 50 60 70 80 90
Other manual Operatives and assembly staff Sales Personal service Craft and skilled operative Clerical and secretarial Technical and scientific Professional Managers and senior administrative
%
2000 1999
[image:46.595.114.490.233.436.2]Chapter 6
Management and Delivery
6
Management and Delivery of Off-the-Job Training
6.1 Introduction
6.1.1 This section examines employers’ approach to off-the-job training in a number of areas:
♦ The existence and format of business, training and human resource plans and budgets - either as written statements or less formally
♦ The allocation of staff and resources towards the training of employees
♦ The types of off-the-job training which had been provided over the last year
♦ The number of employers who used off-the-job training to provide formal qualifications for their employees and the types of formal qualification towards which employees were training
♦ The location of the off-the-job training provided
♦ The methods of off-the-job training used in the last 12 months
6.2
Existence of Business, Training and Human Resource Plans and
Budgets
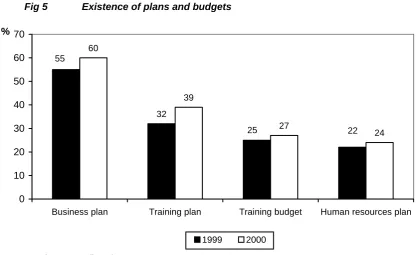
6.2.1 The proportion of employers having a business plan, a training plan, a training budget and a human resources plan is shown in the table below.
It can be seen that three out of five (60%) had a business plan, two out of five (39%) a training plan, over a quarter (27%) a training budget and just under a quarter (24%) a human resources plan.
The existence of all four planning tools has increased since the 1999 study. Fig 5 Existence of plans and budgets
60
39
27
24 22 25
32 55
10 20 30 40 50 60 70
[image:49.595.98.515.425.680.2]46
6.2.2 As the following table illustrates, the existence of plans and budgets increases with increasing size of employer.
Table 31 Existence of plans and budgets by size of employer
Business plan Training plan Training budget Human resource plan
1999 2000 1999 2000 1999 2000 1999 2000
% % % % % % % %
1-4 50 57 22 31 16 18 15 18
5-24 63 66 52 54 38 42 32 36
25 – 99 75 79 69 69 62 65 51 50
100 – 199 88 89 80 79 79 82 65 65
200 – 499 92 93 89 83 88 88 76 73
500 + 92 94 89 88 94 93 83 84
TOTAL 55 60 32 39 25 27 22 24
Base/Coverage: all employers - 4001
6.2.3 Employers in the transport, public administration and other services and in the finance and business services sectors were most likely to have plans and budgets.
Table 32 Existence of plans and budgets by industry sector of employer
Business plan Training plan Training budget
Human resource plan
1999 2000 1999 2000 1999 2000 1999 2000
% % % % % % % %
Manufacturing 57 61 28 35 17 23 16 24
Agriculture, mining, utilities, construction 43 47 18 21 12 18 8 10 Distribution & consumer services 48 54 27 34 17 18 17 21 Finance & business services 62 74 35 43 26 27 26 28 Transport, public admin & other services 60 60 46 52 44 45 31 31
TOTAL 55 60 32 39 25 27 22 24
6.2.4 The existence of plans and budgets varied between regions as shown in the table below. Table 33 Existence of plans and budgets by Government Office region of employer
Business plan Training plan Training budget Human resource plan
1999 2000 1999 2000 1999 2000 1999 2000
% % % % % % % %
North East 50 54 31 45 24 31 21 22
North West 55 63 35 36 27 27 30 24
Yorkshire and the Humber 55 65 36 50 23 32 17 29
East Midlands 57 67 34 50 30 32 13 30
West Midlands 55 53 29 30 25 19 19 20
Eastern 57 59 33 38 28 29 22 18
London 57 59 29 42 19 23 21 26
South East 50 59 31 32 24 23 23 20
South West 56 63 39 36 32 32 25 28
TOTAL 55 60 32 39 25 27 22 24
48
6.3
Form in Which Planning Tools Exist
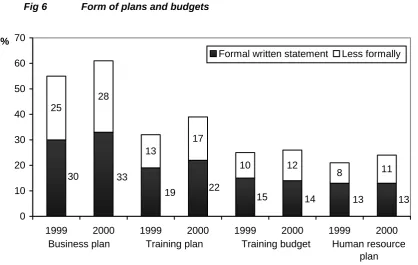
6.3.1 For each planning tool in place, employers were asked whether or not it existed as a formal written statement or as something less formal. The following table shows that in the majority of cases, planning tools existed as formal written statements.
In the case of business plans and training plans there has been a small increase since the 1999 study in the proportion of employers using formal written statements.
Fig 6 Form of plans and budgets
25
28
13
17
10 12
8 11
13 13
14 15
22 19
30 33
0 10 20 30 40 50 60 70
1999 2000 1999 2000 1999 2000 1999 2000
%
Formal written statement Less formally
Business plan Training plan Training budget Human resource plan
Base: all employers – 4001
[image:52.595.77.496.172.437.2]6.4
Resources for Off-the-Job Training
6.4.1 Employers who had provided off-the-job training in the last 12 months were asked about the existence and commitment of resources for training within their organisation (not just at the establishment sampled). Specifically:
♦ whether the organisation had someone at senior management level responsible for training
♦ whether the organisation had a separate training facility such as a training school or centre
♦ whether the organisation had members of staff to design and teach training courses
6.4.2 Over two-thirds (71%) of the employers who had provided off-the-job training in the last 12 months had a member of senior management with responsibility for training within their organisation.
This compares with the figure of 67% reported in the 1999 study.
6.4.3 Staff to design and teach training courses existed in a third (32%) of organisations providing off-the-job training and a separate training facility in about a quarter (23%) of organisations. The equivalent figures in the 1999 study were 30% and 23%.
6.4.4 On average, in both years of the study, those employing staff to design and teach training courses employed 9 such people within their organisation.
6.4.5 As the following table indicates, the allocation of staff and resources to training within the organisation increases with increasing size of employer.
Table 34 Allocation of staff and resources for training by size of employer
Senior management Training staff Training facility
1999 2000 1999 2000 1999 2000
% % % % % %
1-4 56 66 23 28 16 19
5-24 77 76 31 31 28 25
25 – 99 80 81 42 46 33 35
100 – 199 82 83 51 57 43 41
200 – 499 83 84 68 66 52 49
500+ 91 92 84 86 68 64
TOTAL 67 71 30 32 23 23
50
6.4.6 Employers in the transport, public administration and other services sector were the most likely to dedicate staff and resources within the organisation to off-the-job training.
Table 35 Allocation of staff and resources for training by industry sector of employer
Senior
management Training staff Training facility
1999 2000 1999 2000 1999 2000
% % % % % %
Manufacturing 71 68 15 16 11 8
Agriculture, mining, utilities, construction 46 69 6 7 9 7 Distribution & consumer services 70 69 37 25 34 26 Finance & business services 56 70 25 30 16 22 Transport, public admin & other services 82 75 43 55 31 34
TOTAL 67 71 30 32 23 23
Base/Coverage: all employers providing off-the-job training in the last 12 months - 2903
6.4.7 The proportion of employers in each region having someone at senior management level within the organisation responsible for training, training staff to design and teach courses and a separate training facility is shown below.
Table 36 Allocation of staff and resources for training by Government Office region of employer
Senior
management Training staff Training facility
1999 2000 1999 2000 1999 2000
% % % % % %
North East 71 72 41 41 36 36
North West 71 73 25 29 22 25
Yorkshire and the Humber 73 83 20 32 13 21
East Midlands 77 72 39 13 25 14
West Midlands 64 59 27 37 23 16
Eastern 60 70 30 29 19 21
London 52 76 30 36 24 26
South East 67 61 33 36 26 27
South West 74 73 28 35 26 25
TOTAL 67 71 30 32 23 23
6.5
Types of Off-the-Job Training Provided
6.5.1 Employers who had provided off-the-job training over the past 12 months were read a list of possible types of training and asked which ones they had provided over this period.
As shown in the table below, job specific training and health and safety training were the types that had been provided by most employers over the previous 12 months.
There has been an increase since the 1999 study in the proportion of employers providing each type of training.
Fig 7 Types of off-the-job training provided at the location in the last 12 months
8 40 41 52 52 69 69 4 32 36 43 51 62 66
0 10 20 30 40 50 60 70 80 Training in foreign languages
Supervisory training Management training Induction training Training in new technology Health and safety training Job specific training
% 2000 1999
Base/Coverage: all employers providing off-the-job training in the last 12 months - 2903
6.5.2 The provision of all types of training generally increases with increasing employer size. Table 37 Types of off-the-job training provided by size of employer
Total 1-4 5-24 25-99
100-199
200-499 500+
% % % % % % %
Job specific training 69 61 75 84 88 94 95 Health and safety training 69 61 75 88 94 95 95 Training in new technology 52 46 56 66 78 87 93
Induction training 52 39 64 79 88 92 94
Management training 41 33 44 61 73 87 93
52
6.5.3 The table below shows the types of training provided in the last year by industry sector of employer.
Table 38 Types of off-the-job training provided by industry sector of employer
Total Manufac -turing Agric-ulture, mining, utilities, const-ruction Distribution & consumer services Finance & business services Transport, public admin, other services % % % % % %
Job specific training 69 70 59 75 65 69 Health and safety training 69 66 78 69 63 73 Training in new technology 52 52 39 46 59 55
Induction training 52 45 41 57 43 64
Management training 41 30 30 54 28 50 Supervisory training 40 32 23 49 29 51 Training in foreign languages 8 10 1 10 10 8
Total no. of employers providing off-the-job training 833324 80911 87417 199311 230171 235514 Base/Coverage : all employers providing off-the-job training in the last 12 months – 2903
6.6 Off-the-Job
Training
Leading to Formal Qualifications
6.6.1 Of those employers who provided off-the-job training, 46% reported that some of this training was leading to formal qualifications. The equivalent figure in the 1999 study was 43%.
6.6.2 As shown in the table below, a higher proportion of larger employers offered some training which was leading to formal qualifications.
Table 39 Employers offering some off-the-job training leading to formal qualifications by size of employer
1999 2000
Total no. of employers providing
% % off-the-job training
1-4 34 39 482758
5 - 24 48 51 231975
25 - 99 57 64 91005
100 - 199 67 73 15858
200 - 499 85 82 8765
500 + 90 90 2964
TOTAL 43 46 833324
6.6.3 The provision of training leading to formal qualifications varied by industry sector as shown below.
Table 40 Employers offering some off-the-job training leading to formal qualifications by industry sector of employer
1999 2000 Total no. of employers providing
% % off-the-job
training
Manufacturing 50 39 80911
Agriculture, mining, utilities, construction 48 60 87417
Distribution & consumer services 42 45 199311
Finance & business services 38 40 230171
Transport, public administration & other services 46 51 235514
TOTAL 43 46 833324
Base/Coverage: all employers providing off-the-job training in the last 12 months – 2903
6.6.4 The proportion of employers in each region providing off-the-job training who had provided some training leading to formal qualifications is shown below.
Table 41 Employers offering some off-the-job training leading to formal qualifications by Government Office region of employer
1999 2000
Total no. of employers providing
% % Off-the-job training
North East 44 55 29935
North West 50 44 112247
Yorkshire and the Humber 56 41 86396
East Midlands 51 47 74455
West Midlands 45 58 73250
Eastern 43 52 87307
London 25 45 144659
South East 39 39 140957
South West 47 50 84117
TOTAL 43 46 833324
54
6.7
Types of Formal Qualification
6.7.1 Employers who stated that some of the off-the-job training they provided was leading to formal qualifications were asked which, if any, of the following qualifications it was leading to:
♦ NVQs/SVQs
♦ Other nationally recognised qualifications, eg RSA, BTEC, City and Guilds
♦ Qualifications specific to the company
♦ Higher qualifications such as degrees
6.7.2 Other nationally recognised qualifications and NVQs/SVQs were the types of qualification that some off-the-job training was most commonly leading to (48% and 46% of those providing training leading to qualifications respectively).
Since the 1999 study there has been an increase in the extent to which some off-the-job training is leading to company specific qualifications and to higher level qualifications. Table 42 Types of formal qualification to which off-the-job training leading
1999 2000
% %
Other nationally recognised qualifications 48 48
NVQs/SVQs 45 46
Qualifications specific to company 25 32 Higher qualifications such as degrees 17 24
6.8
Location of Off-the-Job Training
6.8.1 The most common location for providing off-the-job training was at a private training centre (66% of employers providing off-the-job training), followed by at an FE college (32%), at the employer’s establishment (31%) and finally at a company training centre (22%).
Since the 1999 study there has been an increase in training taking place at a private training centre and at the establishment interviewed.
Table 43 Location of off-the-job training
1999 2000
% %
Private training centre 55 66
FE College 31 32
Establishment interviewed 22 31 Company training centre 19 22
Elsewhere 10 17
Base/Coverage: all employers providing off-the-job training in the last 12 months – 2903
6.8.2 The likelihood of using each location increased with increasing size of employer. It can be seen that the variation by establishment size is much greater for some types of location than for others.
Table 44 Location of off-the-job training by size of employer
Total 1-4 5-24 25-99 100-199 200-499 500+ % % % % % % % At a private training
Centre 66 67 63 66 74 80 80
At an FE college 32 25 36 45 58 67 73 At establishment
Interviewed 31 19 38 59 72 84 87
At company training
Centre 22 18 23 35 45 53 66
Elsewhere 17 21 12 11 12 10 16
Total no. of employers
providing off-the-job training 833324 482758 231975 91005 15858 8765 2964
56
6.8.3 The most commonly used locations varied according to the industry sector of the employer. For example:
♦ A private training centre was most likely to be used by employers in the manufacturing sector
♦ An FE college was most likely to be used by employers in the agriculture