This is a repository copy of An Analysis of Motorists’ Route Choice Using Stated Preference Techniques.
White Rose Research Online URL for this paper: http://eprints.whiterose.ac.uk/2340/
Monograph:
Wardman, M.R. (1985) An Analysis of Motorists’ Route Choice Using Stated Preference Techniques. Working Paper. Institute of Transport Studies, University of Leeds , Leeds, UK.
Working Paper 212
[email protected] https://eprints.whiterose.ac.uk/
Reuse See Attached
Takedown
If you consider content in White Rose Research Online to be in breach of UK law, please notify us by
White Rose Research Online
http://eprints.whiterose.ac.uk/Institute of Transport Studies University of Leeds
This is an ITS Working Paper produced and published by the University of Leeds. ITS Working Papers are intended to provide information and encourage discussion on a topic in advance of formal publication. They represent only the views of the authors, and do not necessarily reflect the views or approval of the sponsors.
White Rose Repository URL for this paper: http://eprints.whiterose.ac.uk/2340/
Published paper
Wardman, M.R. (1985) An Analysis of Motorists’ Route Choice Using Stated Preference Techniques. Institute of Transport Studies, University of Leeds, Working Paper 212
Working -Paper -212
September 1985
AN ANALYSIS OF MOPORISTS' FGWE CHOICE
USING STATED PREmmmx TEalNIQUES
ITS Working Papers are intended to provide information and encourage discussion on a topic i n
advance of £onnal publication. They represent only the views of the authors and do not necessarily reflect the views or approval of
-;
M. (Sept- 1985) An Analysis of Motorists' kute Choice Using Stated Freference Techniques. WrHng-Papr'212; Institute for Transport Studies; University of Leeds.This paper presents sane results of
an
analysis of motorists' route choice based on stated preference responses. 'Ibis is done £or koth an inter-urban andurban
route choice context.The nature
of
the stdy is exploratory; the anaLysis being based upon a pilot survey of sane79
motorists undertakeni
n
MarchIApril 1984. The quality an3 nature of the responses are assessed
i
n
terms of a 'rationality' test and also through a consideration of lexicographical forms of decision making.ABSTRACT
ACKN-S
1. INTRODUCTION
2. M T A C O ~ I O N EXERCISE
3. QUALITATIVE A S s F s m s OF THE HESFONSES
4. MODELLING PRaCESS
5. ANALYSIS OF l%TER-URBAN W3UTE CEDICE
6. SEGMEhFPATION ACXXRDIMG M IN- LEVELS
7. ANALYSIS C F URBAN RoUlX CHOICE
8. IIESPONDEKE-
9. CONCLUSIONS
Unpinlished vrnxk quoted in this paper was prduced as part of a
research project into the value of tine; urvlertaken for the
Department of Transprt by a joint team fjsan the ElVA Consultancy
Imdan; Leeds University Institute for Wansport Studies and Oxford University Transport Studies Unit. The m a k e r s of the team a t the current phase of the project are:
Dr J J Bates Mr M Bradley
Dr A S Fowkes
Dr P B Gooawin
M r H F G u n n
Prof K M ~ l l i a m
Dr P M Jones
Mr R P Kilvington
M s P M a r k s
Mr M Roberts
MrMWardman
John Bates Services Oxford University b e d s University Oxford University
Cambridge Systematics m o p e Leds University
Oxford University Oxford University Leeds University
MVA mnsultancy
Leeds University
I muld especially l i k e to thank John Bates; TCply F ' e s and
Phillipa Marks for their assistance; Professor Owilliam for
ccm'raents on a draft version of this paper and Dr Ian Johnson wlao
collected the data. The views eXp?sSed i n this paper
The findings
e
a
n
an analysis of motorists' route choice travel behaviour reported here are based upon a p i l o t survey of matorists undertaken i n March/April 1984. The aims of thissurvey were tm£old:
-
a ) The stated pceference experiments mdertaken in an e a r l i e r phase of this value of time project related only to r a i l and coach ccnmIUterS in North Kent (Value of Time Study 1983)
.
Hence problans specific to the d y s i s of motorists' travel behaviour have not received similar consideration. It is; therefore; - necessary to iwestigate c e W issues; such as the repesentation of the mnetary costs associated with car use; and to assess certain factors whichmay be hypathesised to influence motorists' travel behaviour.
The survey also provides sane means of assessing how respondents perceived the stated peference exercise by noting; for example; their c m e n t s concerning the difficulty of the ranking task and also ðer m e infonnation than that supplied was needed to r e a l i s t i c a l l y represent the route choice process.b) The p i l o t survey ms also mdertaken in order to consider different survey methcds i n terms of t h e i r cost effectiveness in obtaining a given sample of m t o r i s t s .
This enabled recarmendations to be made a s to the best
s m e y method to use i n any further data collection exercise i n canparable circunstances.
This paper concentrates on the former objective. The aim i s to assess the per£onnance of the ranking approach to v a l e of time estimation i n a motorists route choice context. This i s done by means of both a qualitative and quantitative examination of the responses obtained £ran the ranking exercise. Considerations of the cost effectiveness of each survey method; along w i t h d e t a i l s of the suntey methods themselves; can be fomd elsewhere (Value of Time Study: 1984a; 198413)
.
In the decade to 1980; conjoint analysis: being a generic t e r m for the analysls of ordinal statements of preference, had been mployed i n more than 300 m e r c i a l projects (Wittink and Cattin 1981). The ranking approach has also found nmerous transport applications in a variety of contexts (Bates and Roberts 1983: Beggs; Cardell and Hauman 1981: Hensher and Muviere 1983: Steer; Davies and Gleave 1981: Val* of Time Study 1983; F-es and Marks 1985: Bates 1985). The ranking approach used here was applied i n tm hypothetical circunstances:
a ) Interarban Route m i c e
This expriment offered the respndent the choice of a 100
mile circuitous route which had no t o l l charge or a more direct 70 mile route vhere a toll was payable. This task involved the ranking of twelve travel options where eight of these options here tolled routes. The options offered the respondent the opprtunity to trade-off between attributes across options such that estimates of the relative valuations placed upon various attributes could be cbtained. The respondent was asked to imagine that the p-se of the journey was to v i s i t f r i e d s
£or
a weekend.b) Urban Route Choice
This expriment £bllaws along similar lines to the inter- urban; the respondent again being able to trade-off between attributes across options in the &ice between a rongested route of 9 miles and a longer but higher quality route of 12 miles &ere a toll was pyable. f i e r e s p d e n t ms required to rank ten travel alternatives i n order of preference where eight of the options bere tolled routes. As w i t h the inter- urban ranking; the journey purpse ms to v i s i t friends.
In each expriment; the motorist was given the distance; toll charge; average speed; travel
time
and petrol cost for each of the alternatives and a brief description of the hypothetical circunstances ms also given.The nature of the exercise is m r e hypothetical than was the case for the North Kent stated preference analysis ard than i s likely ,
to be the case in future applications i n this v a l e of time study. This i s because the exercise was not based upon routes o r journeys w i t h vhich
the
reqxmdent muld be familiar. This must be borne i n mind when considering certain problems t h a t may be encountered: the h y p i h t i c a l nature of the exercise as it i s undertaken here i s not an inherent feature of this technique.3. Qualitative-Assesshents-of-W-Respbnses
A feature of the ranking task i s the apportunity it provides to
make sane assessnent of both the quality and nature of the respnses supplied. ?he l c g i t nrdel to be used can handle error in the stated preference respnses; to a certain extent; due to its stochastic canpnent. fb&ver; we wuld be concerned i f a high proportion of individuals supplied respnses which appeared t o be of p r quality given that this may increase the range in which the value of time estimate l i e s o r indeed d i s t o r t the estimate of the true value of time. Furthemre; respnses a c h do not r e f l e c t t r a d e o f f behaviour may be misleading i n the context of value of time esthiiation. It m y ; therefore; be
preferable to d t £ran the formal analysis those orderirgs which can be identified as being of p r quality or a c h do not exhibit trade-off behaviour.
If the options had been formulated in a manner such that one option was clearly superior to all others (option j) vhilst amther option was clearly inferior to a l l others (option k)
;
a rationality test might involve assessing whether options j and k are placed a t the appropriate extremes of an individual's ordering. Such an assessment was p s s i b l e for the ranking exercise canpleted by North Kent r a i l ad. coach cannuters where it was found that approximately 10% of respondents did not place either one; or k&n; of these opticms a t the appropriate extrenes of their ranking (Value of Time Study 1983).As no option i n the s e t of route choice travel alternatives was t o t a l l y daninant or daninated; such an assessnent cannot be
undertaken here. The options were; hawwer; fomulated in such a way that certain alternatives can be identified as being rationally preferred to certain others. It is assmed that the
relevant monetary cost t h a t i n f l e n c e s choice
is
the straightforward unweighted sun of t o l l charge and petrol cost; that is a u n i t change i n toll charge i s regarded as being of an equal &isbenefit to a unit change in petrol costs; and also thatchoice is influenced cmly by the level of time and t o t a l
cost.
Given the travel time (T) and t o t a l cost (C) of tm options i and j; rationality i s defined such that i f conditions 1 and 2 below ' are satisfied; for any plirwise canprison of travel alternatives; then option i daninates and is rationally preferred.
A more rigourow test m i g h t introduce the variables speed and
toll ard canpare options a c h are dcminant i n terms of petrol
&never; this muld r e s t r i c t the nLnnber of caaparisons that could be made whilst it i s considered that useful insights into the quality of the respnses can be obtained by assessing the data according to cotditions 1 and 2 abare.
?he assessnent requires that the respndent has expressed preferences for l e s s d i s u t i l i t y rather than more such that his stated preferences are consistent with &at we hypthesise to be his actual preferences. The inter-urban and urban route choice experiments contained seventeen and nineteen of these daninated pairwise canprisons respectively out of a possible total nmber of pairwise ~ n p r i s o n s of sixty- six and forty five respectively.
Other qualitative assessments of the respnses were undertaken as
fbllows :
a ) Sane individuals may have a distinct aversity to paying tolls, for example; paying for the use of road space is opposed as a matter of principle. A s such; motorists &o are opposed to toll rods; and who believe that such toll roads are a p s s i b i l i t y ; may bias their responses i n sane attempi to reduce the likelihodi that they perceive of tolls being more widely intrcduced or simply to register sane protest against tolled roads. % i s respnse bias may take the £om of mtolled options being ranked as preferred. Analysis of the respnses; i n terms of ðer mtolled options are ranked as preferred; gives sane indication as to the m a x h number of reslpndents bho have biased their respnses i n this way. Such an assessment has been undertaken with respect to the inter-urban rankings; where four routes are untolled; but not with respect to the urban rankings there only tm routes are untolled. If it was fomd that a considerable number of respondents ranked the untolled options as preferred; it muld be necessary to consider the data further to examine ðer such ranking could be reconciled by reference to other c r i t e r i a ; such as; for example; the implied values of time £ran the ranking.
b) Certain respsndents may possess mn canpnsatory decision rules; £or example; a lexicographic choice process. whilst
.
the l a t t e r is only one form of norGmnpensatory choice process; such decision making processes are often ignored i n econanic considerations of travel behaviour and in n& classical econanic theories of consuner behaviour i n
Non canpnsatory choice processes involve an attribute by
attribute consideration of alternatives where the d i s u t i l i t i e s associated with various attributes are not traded-off across options (Foerster 1979; 1980: Golob a d Richardson 1980).
A lexicographic choice pocess identifies the most imprtant attribute £ran those which characterise an option and choice i s
based upon that option a c h pssesses this most inpz~rtant attribute a t its highest u t i l i t y ( l e a s t d i s u t i l i t y ) yielding level. Once the most preferred option i s identified; the process is repeated for the remaining options whereupn a canplete ranking is eventually firmed. &I individual may rank the options on offer in terms of, £or example; ascend* levels of time.
If a respndent p s s e s s e s a non-canpnsatory choice rule; the mdie/route choice process is quite distinct &an any benefit; i n terms of reduced d i s u t i l i t y ; t h a t is obtained fran; £or example; travel time savings. As such; the responses of individmls vho p s s e s s mn-canpsatory choice rules m i g h t be anitted &an the
h r m a l analysis cndertaken tbr the purpses of inter-attribute
valuation. Their choices are mt consistent with u t i l i t y maximising models of canpensatory choice &an a c h estimates of relative valuations are to be obtained.
The analysis cndertaken here focuses upon the p s s i b l e presence of lexiccgraphic choice rules. Tnis choice rule is the
most
amenable to assessment given the nature of the data. It is also perhaps that process which i s mst likely to be adopted i f i n d i v i d d s are forced to ccnsider the options; in a non trade'- off manner in tenns of one dimensicn; i f they find the ranking task ot%emise too dananding.
It is not clear dnat the implications for the ranking supplied muld be i f other forms of non canpensatory choice rules applied; such as the elimination by aspects decision rule (Tversky 1972: G m 1982: Fecker ard Golob 1979). &ices based
upon
attributes achieving certain standards; plrticularly standards ukLich are revised in the process of ranking options; can mt be identifiedw i t h the respnses available here.
I t i s not p s s i b l e ; lnwwer; to uniquely distitquish '
lexicographic orderings although same prcgress can be made and
insights obtained into the possible existence of such decision rules. 'Ihere are a nunber of reasons why a ranking vhich appears
to be based on a lexiccgraphic choice rule may not in fact be
so.
N-x trade-off behavoiur may be erroneously implied.
(i) I f there are no apparent tradGoffs in the ranking supplied; this may r e f l e c t a veryhigh o r very low value of time. Ihe individual may be willing to trad&off time and
(ii) A ranking that exhibits no frad&offs between attributes may be obtained i f certain included attributes are not relevant to travel choice. This is mlikelv to be the case
- - -
for the majority of respndents given the attributes that characterise each option in the expements mdertaken here. Enever, i f the respondent muld m t pry for the petrol used, or i f petrol costs are not considered i n route choice or are treated not as a variable cost but rather as, for e x q l e , a fixed weekly cost; the ranking supplied has an
increased l i k e l i h c d of exhibiting peferences vhich do not exhibit trade-offs.
(iii) Respnse bias, in an attempt to a l t e r the perceived likelihood of sane occurence; may lead to a ranking which appears lexicographic men a resprdent's true decision process i s of a canpensatcry nature. Thus; for example; a respondent may emrJnasise travel time savings; by ranking options according to time; to increase the chances of a time saving project being undertaken. Although such respndents do not p s s e s s non canpensatory choice rules; anitting these respndents on the basis of apparently lexicographic choice rules m a d cause l i t t l e concern a s their respnses are biased. Enever; i f cost and time variations are perceived a s equally likely; there i s no incentive to bias responses as the individml muld gain the greatest benefit by the intrcduction of t h a t option f i c h i s most preferred. mere is a lesser tendency for actual and stated preferences to diverge d w to bias than is the case with; for example; transfer price.
(iv) Of sane cornern is the psssibility that certain r e s m e n t s are forced to supply one dimensional orderings due to d i f f i c u l t i e s in ranking the options according to a cangensatory criterion. Whilst the res~ondent's ordering could laere be correctly identified as being lexicogarphic; the problem r e s t s with an ordering which is based on canpmsatory principles where psssible; but h e r e this proves
too
demanding; a lexicographic choice rule simplifies the remaining tasks required of the resprdentin canpleting the ranking.
rn
1: 'Irrational' RespnsesN* of
Irrationalities 0 1 2 3 4 5 6 7 8 9 10
Inter Urban 2 9 1 1 1 3 1 6 2 4 1 1 0 1 0
Urban 3 0 1 4 1 4 6 3 5 1 1 0 1 2
Notes :
Inter-wban contains 17 daninated a n p r i s o n s f r p ~ a possible 66. Urban contains 19 daninated an*i&ns out of a p s s i b l e 45.
The nmter of i r r a t i o n a l i t i e s , in p i n v i s e canprisons of options based an travel time and total cost, follows a similar p t t e r n i n bath experiments. The degree of inconsistency i s relatively low; bearing in mind that an 'incorrect' ranking of one option may imply several irrational preferences of the type defined above in
conditions 1 and 2. 'he findings do mt give rise to serious concern about the quality of the responses s q p l i e d . Furthermore; few respondents supplied rankings &ich exhibited
serious i r r a t i o n a l i t i e s i n both the urban and inter-urban cases.
If this rationality t e s t had suggested that there =e widespread
i r r a t i o n a l i t i e s i n .the responses; the more rigourous but also mxe restricted examination of the respnses; as outlined above; muld have been undertaken.
%me assessment of the quality of the resFonses is necessary a s the task required of r e s d e n t s i s not straight5xmrd: involving the ranking of either M v e or ten options. As either the nunber of options t o be ranked or the number of attributes per option increases; so the ranking task becanes more d i f f i c u l t . Research undertaken by Wtganery e t a1 (1977) ard =pert e t a1
(1978) raises questions concerning the use of rankings *ch include nunerous attributes. They found that the tm factor a t a
time
approach performed better than the f u l l profile approach tihere eight andnine
attributes respectively characterised the options in the choice set. However; using three and five attributes respectively; O p F i j k van Veen and Beazley (1977) and ' Jain et a1 (1978) fomd a greater degree of consistency between thet m
factor a t a time and f u l l profile approaches.lhe inclusion of too many options; or attributes per option; i s likely t o lead to information overload whereupon the respondent may ignore variations in variables of lesser impxtance o r f i c h
exhibit l i t t l e variation between options; o r may resort to a on&
To identify potential lexicogra&ich choice rules; rankings were constructed according t o l e a s t travel time; total cost; petrol cost and toll charge. Where the relevant attribute has the same value between options; the individual i s ass& t o c h a s e that
option which daninates according to the remaining attributes. If such daninance does not exist for these remaining attributes; the appropriate options are interchangeable within the ordering.
In the inter-urban experiment; four of the 78 individuals supplied rankings which conformed to an orderkg according to least travel
time.
One respndent supplied such a ranking based on ascendixq levels of total cost whilst one r e s p d e n t supplieda ranking based on the level of t o l l charge.
I n addition to those who supplied one-dimensional orderings; tvm respondents ranked the four untolled inter-urban options as preferred but did not supply a canplete toll based ranking. Hence there i s a l i m i t of only two to the n-r of respondents who might have biased their responses against tolled roads; along with one person who supplied a canplete toll based ranking.
I n the urban route choice experiment; five respondents; £ran a total of 77; supplied time based r a n k i q s whilst the c o r r e s p d i n g figures for such rankings based on total cost and petrol cost were five and one respectively. The rankings based on t o t a l cost and toll charge were quite similar; but not identical; i n the urban case.
Approximately 8% of the inter-urban rankings and 14% of the urban rankings exhibited no apparent trade-offs. Moreover; there are several additional respidents whose ordering of the options i s suspiciously approximate to a lexicographic £om.
Four respondents supplied apparently lexicographic orderings in
b t h route choice contexts: three of which were based upon travel
time and one upon total cost. As nine respndents supplied such rankings i n only one of the two route choice contexts, it might be inferred that these individmls do not have true lexicograpkic choice rules and that there is an upper limit of £our t o the
nunber of respondents who p s s e s s such decision making processes.
.
Bxwer; this finding suggests that these nine respndents eithex have varying decision rules, depending upon travel circunstances; or m r e likely that they possess canpensatary choice functions but have £omd it too d i f f i c u l t to rank the options on this basis and have; therefore; resorted t o a onedimensional consideration of the options to simplify the task required of them. S h(1955; 1978) has argued that the use of satisficing levels may be
The, m a x i m q nmber of respondents d o possibly possess true lexicqraphlc choice processes is relatively low. Others may have resorted to such a choice rule; .either
%.I
vuhole o r i n p w t yto simplify the task required of them. Morewer; there i s l i t t l e evidence of resp3nse bias i n terms of favouring mtolled options.
As motorists are asslmed to be constrained u t i l i t y maximisers; such that a value to travel time i s implied; the modelling process conforms to cunventional disaggregate practice. Ihe logit model is derived by assuning that i d i v i d u a l s choose amongst alternatives according to greatest u t i l i t y ( l e a s t d i s u t i l i t y ) i n a canpensatory manner w h i l s t the stochastic canpnent; a c h allows for unobservable or anitted effects; is assuned to conform to a Weibull distribution.
The stochastic element i s also called upon to represent the deviation of the i ' t h individual's tastes f m the average w i t h
respect to each variable. Whilst the error term is no longer identically and independently distributed when inter-personal taste variation i s present; work done by Horowitz (1980; 1981) and %&es and Warhan (1985) sxggests that the coefficient estimates of the l c g i t mJdel remain reasonably robust i n such circunstances
.
The responses to a rankiw exercise; for each individual; yield a nunber of discrete choices betwen travel options and conventional disaggregate models of travel behaviour can be applied w i t h the advantage that; for a given sample size; there are more observations of choice than muld be the case with a revealed preference amoach.
?he specific &el used to explain individml's behaviour is a modification of the lcgit model; adapted to allow for the input of ranked data. If n options have been ranked in order of preference; a m u l t i n a n i a l logit &el can be calibrated for the
most pre£erred option i n relation to the remaining rr-1
alternatives. This prccess i s repeated for the preference of the second best alternative wer the remaining G 2 options and
-
continued until the ranking i s exhausted. Hence for each individml; given a ranking of n options; m have Gl observations of preference t o be input to the m u l t i n a n i a l l o g i t &el. 'Ihis represents the maximun nunber of indepndent observations of choice that can be obtained £ran the ranking supplied.the estimation of relative preferences &an crdered preference statenents; for example; PREFlvPIP (Carroll 1972)
;
MONiW3VA (Kruskal 1965) and LINMAP (Srinivasen and Shocker 1973a; 1973b).Whilst the p i l o t survey obtained only a limited sample of
respndents (78 Inter Urban; 77 Urban); the ordered statements of preference allows the effective data s e t of discrete choices; which are input to the logit ⪙ to be considerably expmded. Effective sample sizes of 858 and 693 a t the maxhm depth of ranking; for the inter-urban and ur* cases respectively; allow worthwhile analysis t o be undertaken.
Tne formal analysis of the respnses assesses various representations of motorists' route choice and whilst value of time estimates are derived, this i s not the m l e purpse of the exercise. The findirqs of the n~3els of inter-urban and urban route choice w i l l be considered in turn.
Various models attempt t o explain route choice by reference to relevant variables &ch are hypothesised to influence &ice. The estimated coefficients of the logitmcdel s M d have a negative sign i f an increase in the level of an attribute leads to a reduction i n u t i l i t y (increase in d i s u t i l i t y ) and heme to a reduction
in
the probability of dhoosing that option as the mostpreferred i n the choice set. The coefficients associated w i t h each attribute are specified as generic; that
is;
for example; the same time coefficient is assmed to apply across a l lalternatives.
Alternative specific constants are rot specified as there is tn reason to suspect that any route i s preferred to others for reasons other than those vhich are explained by the incluled relevant variables. For example; whether there is saue M e m y
to favour untolled options; regardless of the level of the other relevant attributes; i s analysed by use of a variable to reflect whether the route is tolled or not.
Table 2 lists the f i r d i g s £ran an analysis of motorists' stated route &references using the most straightforward foms of linear *
u t i l i t y functions w i t h 858 observations of discrete choice. bbnetary costs are specified in pence; and travel time is expressed i n minutes; which i s the case throughout.
M e 1 2.1 i s the most straightfomard &m of u t i l i t y e x ~ e s s i o n where the probability of choosing an option a s preferred i s explained simply as a h c t i o n of total cost and travel time. Model 2.2 s p l i t s total cost into its constituent parts; p t r o l cost and toll chiuge; as is also
the
case w i t h d e l 2.5; i n an attempt to explore the hypothesis that a unit change in either petrol cost o r t o l l charge have the same u t i l i t y effect. Models 2.4 and 2.5 introduce a dmny variable to reflect whether a t o l l is payable; essentially specifying an alternative s p c i f i c constant for tolled routes vhilst 2.3 examines ðer choice canbe best explained w i t h reference only to travel time and toll charge.
TABIE 2: Linear W e l s of Inter-Urban mute Choice . . .
: MODEL . . . : 2.1 : 2.2 : 2.3 : 2.4 : 2.5
: PETROL : : -.00380 : : 1.01036 :
: COST : : (-7.24) : : ( - 5 . 8 6 ) :
:
: TOLL : 1.00521 : 1.00398 : : 1.00523 : CHARGE
.
. : (-16.45) -: (-15.75) : : (-16.40) ::
: TIME :-.03073 : -.03080 : 1.02562 : -.03398 : 1.04271 : :(-17.88): (-17.96) : (-17.23) : (-17.77): (-11.93) :
f f f r :
NOTES 1\3 TABIE 2:
1. V a l e of time in terms of totdL cost (p/mh). 2. Value of time in terms of p t r o l C& (p/min).
3. Value of time in terms of toll charge (p/min). t statistics in brackets.
In all cases; the coefficients have the correct sign and are
highly statistically significant alttough the -Bar squared
statistics are 1- than is ccnmxdy achieved for similar sample sizes. The implied values of
time;
which vary sanewhat accordingM e 1 2.1 yields a value of time vhich i s relativelyhigh a t 5.99 pence per minute a l t h q h this may be influenced by higher than average incane respondents having a p r t i c u l a r l y h i g h value of time. The value of time estimate has a relatively s m a l l standard error: a 95% confidence interval r q e s e n t s a range of plus o r minus 8% of the central estimate.
M e 1 2.2 yields value of time estimates vhich vary according to whether a petrol cost or toll charge equivalent of the marginal. u t i l i t y of time is taken. The toll charge coefficient implies an effect up3n u t i l i t y s a n d t greater than that for petrol cost.
Both the petrol cost and toll charge coefficients are significant, as are the value of time estimates. The petrol cost
wd t o l l charge values of time have 95% confidence intervals vhich represent an approximate range of plus or minus 24% and 8% of the actual value of time estimates respectively. These relatively narrow ranges are encouraging with respect to the precision with h i c h the value of time is being estimated.
'Ihe Ox??xd exploratDry study of private travel (Value of Time
Study 1983) fomd that motorists responded differently to p t r o l cost and 'out of pocket' cost variations. We might; therefore; e x w t motorists to react differently to toll charge and petrol cost variations. The findings of 2.2 suggests t h a t matorists do in fact resfom3 differently: a z s t a t i s t i c of 3.516 indicating that the difference in the coefficients i s significant a t the usual 95% level of confidence; kdel 2.2 also represents a significant improvement upon 2.1 m terms of a l i k e l i b c d r a t i o t e s t . A chi squared of 9.72 exceeds the tabulated value of 3.84 a t a 95% l w e l of confidence £or one degree of freedan r e d u c t i a .
Wdel 2.3 explains route choice solely in terms of toll charge and travel time. Both coefficients are significant; implying a value of time in terms of toll charges vhich is not dissimilar to
that of 2.2. Emever; a s the petrol cost coefficient of the
prwious d e l is significant; it is not surprising that
according to a l i k e l i h c d r a t i o test; e e l 2.3 i s not an jrn~~ovenent over 2.2. Indeed 2.3 perfons considerably m r s e than 2.2 a d it appears that motorists have based t h e i r choices upon ptrol cost; toll charge
and
travel time considerations.In both 2.4 and 2.5; the toll dumy variables possess significant coefficients a c h are of the correct sign. N A e l 2.5; &ere t o t a l cost i s s p l i t into its constituent parts; represents a significant i m ~ o v m e n t over 2.4 w i t h a calculated chi squared of 8.88 for a reduction of one degree of freedan. Indeed; 2.5 represents the best f i t t i n g of these five linear formulations given the appromiate degrees of freedan adjustment.
The petrol cost and toll charge coefficients are; W v e r ; again significantly different; w i t h a z s t a t i s t i c of 2.81; although the relationship between the
tm
is reversed in canprison w i t h 2.2: variations in petrol costs m having a larger effect up3n ~ l i t y thanfne
toll charge. - It is to to expcted that the effect of the toll charge f a l l s i n relation to the impact of petrol cost changes given the introduction of the toll dumry variable. I t is; however; smwhat surprising that once the t o l l effect that is invariant with respect to the toll level is accounted for; such a large discrepancy between the two coefficients remains.The derived value of time in terms of petrol costs i n 2.5 is m e reasonable; a t 4.12 pence per minute; although the toll based value of time is sanehhat large a t 8.16 pence per minute. The value of time
for
canbined rmnetary costs in 2.4 i s also rather large although i n all cases; the range of the estimate a t a 95% level of confidence is encouragingly d l .In sane instances; the derived values of time are more significant; that i s p s s e s s relatively 1- standard errors; than the individml coefficients £ran vhich they are derived. This i s also found to be the case for certain of the wban route choice results r e p r t e d below.
If the options wsre formulated an the basis of an orthgonal design; the variables would be distributed independently of each other and hence the off-diagonal terms of the variance-mariance
matrix
of estimated coefficients would be zero. The options donot; however, follow such an orthqonal design and the covariance
between the
time
and cost coefficients i s here p s i t i v e . The fonnula for the variance of the r a t i o of tm coefficients is::Table 3 lists the results of further linear d e l s of route choice which were exmined; where dcnrmy variables are widely used in an attempt to discern certain effects. A duuay variable allows the estimation of the impact of moving £ran sane base level of variable x to sane other level. If there are n levels of variable x; n-1 dumny variables are specified and the u t i l i t y e f f e c t is
measured in relation to the n'th. The inclusion of n dunny variables muld lead to a sirgular matrix; and although sane
estimates may be obtained, they muld not be meaningful.
Model 3.1 continues the analysis of the effects of toll charges. Tne durany variables T1, T2; T3 and T4 represent the toll levels of £1, £2; £& and and respectively and alcng w i t h petrol cost ard
travel time are used to explain W r i s t ' s route choice. The toll d-es indicate the effect
u r n
u t i l i t y of intrducing a toll and subsequently increasing it to a maximun of £6. Weethe signs of the toll coefficients should be negative as u t i l i t y f a l l s as v.e m e away £rau the base toll level of zero. %reaver; the coefficients should also becane larger negative nunbers as the toll is increased to reflect the f a l l in u t i l i t y . Both of these cotx3itions are satisfied and the coefficient estimates are also highly significant.
The implied value of time in terms of petrol costs is quite plausible
ard
highly significant. Enever; the most Interesting findings stem £ran a consideration of the implied u t i l i t y effects of variations in the toll charge.It can be rea8onablyhypothesised f h a t the i n t r d r c t i o n of a toll
has a greater impact upon u t i l i t y ; £or a given toll charge variation; than subsequent increases &an a mn zero base. 'Ihis i s because the introduction of a toll i n c l d e s
the
u t i l i t y effect attributable to any aversity to tolls; either in principle or dm to perceptions concerning incorwenience and delay; i n addition to the monetary outlay that i s incurred. A m a n e n tfmn
a £l t o £2toll charge includes only the u t i l i t y effect r e l a w to the increased mcnetary outlay.
The implied u t i l i t y effects are l i s t e d in table 3 ~ : As expxted;
the intrcduction of a toll has a greater impact u p u t i l i t y ; per d t change in toll; than subsequent increases. Of Wther interest is the approximate constamy of the incremental u t i l i t y effect then the toll is continually increased £ran the £1 toll
level; which accords w i t h the often made assunption that the marginal u t i l i t y of incane is constant h e n
the
implied incane effect of a cost variation i s mi5 large. These fitdings are mst encouraging i n terms of the quality of the r e s p m s obtainedWIE 3: Linear i'4SeI.s to Examine NnGLinearities in Choice . . .
UX: LIKELIHOOD = -1334.53 RHGBAR
XXJARED
= 0.143. . .
...
3.2 U = 4.0043TC
+
1.133S1+
2.37582 +2.87993 (-14.75) (8.30) (15.99) (16.68)~LOG LIFXLJHOOD = -1380.54 RHGBAR SQ3ARED = 0.114
. . .
. . . .
...
3.3 U = -0.0023T+
0.89581+
1.76652+
1.861S3(-11.58) (6.73) (13.07) (13.17)
IKIG LIKELIHOOD = -1435.63 RHO-BAR
SUIARED
= 0.079. . . . . . . . . . .
3.4 U = 10.0056TC
+
4.171TIMEl+
3.711TIME2+
2.598TIME3 (-16.60) (17.20) (17.14) (12.79)ILX: LIKELMOD = -1323.50 RHO-BAR
SUIARB,
= 0.150 . . ....
3.6 U =
a.
0119PC-
0.0057~-
1.226TD+
0.429SD+
4; 9 5 3 ~ ~ 1 (-1.66) (-16.56) (10.99) (0.60) (7.60)LOG LIFXLJHOOD = -1322.57 -BAR W A R E D = 0.151 . . .
...
PC;
;
T; TD; SD repesent petrol cost; total cost; toll charye; d?nmy (= 1 if pyable);
and speed dunny (= 1 if 70 @).
WBIE 3Ai Bnpab of Tbll Charge Variations (Model 3 ; l )
CHANGE IN IEVEL CHANGE IN WILITY PER WTOLLcBmGE! WIT CHANGE IX I N T O L L
Model 3.2 uses dcnmry variables i n a similar manner to exmine ðer motorists have a preference Sor driving a t certain speeds a d thus base t h e i r rankings; in part; u p the speeds associated w i t h an option. The dunrry variables S1; S2 and S3 represent speeds of 40; 50 and 70
I@
respectively. As 30I@
is the base speed, fran vhich the u t i l i t y effects ofthe
faster speeds are measured, the speed coefficients should have pssitive signs, andincrease as s p e d increases; i f faster speeds a r e ~ e f e r r e d . 3.3 varies £ran 3.2 i n that total cost i s replaced by the toll
charge. Petrol costs w e m t inclded separately a s they are parUy dependent upon speed.
In both 3.2 and 3.3; a l l the coefficients are significant and of
the
correct sign. Emever; the substitution of the total cost t e r m by the toll charge leads to a marked mrsening in theexplanatorypker of 3.3 i n relation to 3.2. Model 3.2 does not i t s e l f prfonn as v d 1 as the linear d e l s previously considered and as such; it i s comlu3ed that such a Sonnulation; based largely upon speed; does not prwide the best insight into route choice behaviour
.
kdels 3.4; 3.5 and 3.6 attempt to discern m*linearities in the u t i l i t y function w i t h respect to time. Wkilst the marginal u t i l i t y of incane is unlikely to vary considerably i n these circunstames; where the implied incane effect i s not substantial; constancy of the marginal u t i l i t y of time might be seen as more of a special mse. In the analysis of North Kent camnuterm s mcde choice ( V a l = of T h e Study 1983 )
;
it ms Sowdthat a s times and costs increased; there tms a tendency for
respsdents to increasingly prefer the faster mode. Tnis suggests t h a t the value of time is mt invariant with respect to * the m u n t of travel time imurred.
The so called l a w of diminishing marginal u t i l i t y implies increasing marginal d i s u t i l i t y as travel time increases; that i s the u t i l i t y t o be gained &an a given t h e saving &lls a s travel
time
is lower. As l e s s travel is a g o d rather than a bad; thisassmption states t h a t the u t i l i t y to be gained a t the margin
£ran time savings f a l l s a s more
time
is saved; that i s a s time i t s e l f is lm. Emever; theoretical reasoning may also support a value of time which f a l l s as travel time increases; t h a t i sa constant value of time across time remains a special case; and the issue requires mpircal investigation. Indeed;
for
sane individuals the value of time may be a p s i t i v e function of time;£or others the reverse may be the case whilst there may ranain sane for the value of time is approximately invariant w i t h
respect to the level of time. It may be that the w e r d l l effect; being an average of these individual effects; i s m t
substantially different £ran a constant average value of time
w i t h respect to time.
The dumny variables in mcdels 3.4; 3.5 and 3.6 represent the four time groupings of 60 minutes; 85 minutes; 105 and 120 minutes canbined and 140 and 150 minutes d i n e d . lhe anitted time i s 200 minutes &ereupon the time coefficients should be p s i t i v e ; a r e d d o n in travel time being beneficial; and as travel time f a l l s ; so the coefficients should hecane
larger.
lhese conditions a r e satisfied for each oftne
d e l s vhnihllst i n nvdels 3.4 and 3.5 the remaining coefficients are of the correct signand all coefficient estimates are significant.
btdels 3.4 and 3.5 yield results f i c h are some-hat a t d d s with t h s e previously derived. 'Ihe petrol cost and toll d m q e coefficients in 3.5 are m t significantly different; a z
s t a t i s t i c for the difference being 0.63; and they are similar to the
total
cost coefficient in 3.4. Given this finding; it is not surpfising that w i t h a calculated chi squared of 0.40, a likelihood r a t i o t e s t suggests the l o s t degree of £reedan is notcanpensated by a sufficient increase in the log likelihDod such that 3.4 performs the better. Meed; according to this criterion; 3.4 provides the best explanation of matorist' s route choice i n this inter-urban context.
Plotting the time coefficients is somethat incowlwive: there is m clear relationship apparent between the time coefficients and the level of travel
time.
Tables 3B and 3C list the implied changes in u t i l i t y as travel time varies for 3.4 and 3.5 respectively: being the i n bath cases; The derived values of time; i n each instance; appear mn linear although m?aBIE 3B: I M p A of Time Variatiam n-Jtal Cost Base (Model 3.4)
change in T h e Utility Change per Implied Value Unit Change in Time of Travel Time
9nBm
x:
mpA
of Time Variatiam (Model 3i5)Change i n Utility Change per Implied Value of Time Time Unit Change in Time (petrol) (Toll)
Elode1 3.6 is the
mst
general formulation amsidered. The speed d v variable indicates whether the speed was 70 mph and i sinclded cn the assunption that it i s this speed; i f any; a t which travel is specifically preferred. IJowever; along w i t h the
petrol cost and toll dumryvariable coefficients; it is m t
significantly different £ran zero. Moreover; 3.6 does not represent a significant impmvment in pr£ormance wer 3.4.
The results £ran various mn linear u t i l i t y functions w h i c h were calibrated are given i n table 4. The quadratic form of 4.1 prwides a plausible explanation of route choice. Each
coefficient is significantly different &xm zero and in
canpariscm with t h e linear model 2.5; d c h is the best of the straigkrtfomard linear models; it is a significant imgmvement.
bwever; the coefficient associated w i t h the squared time term would imply a p s i t i v e marginal u t i l i t y of time;
and
hence a negative value oft h ;
a t sufficiently high levels oftime.
A ta travel time of 434 minutes; tjhich is w e r twice as large as the
.
longest travel t h e involved; the value of time would becane negative. Extrapolation over this range wuld; i n any event;
be risky: m have no observations of preference i n this range. A t the lowst time of 60 minutes; the implied values of time i nterms of petrol costs a d t o l l charges are 4.21 and 10.48 pence per minute thilst these f a l l to 2.64 and 6.56 pence p r minute respectively a t the largest travel time of 200 minutes.
The p t r o l cost am3 toll coefficients are again significantly different; w i t h a z s t a t i s t i c of 3.70; which i s reflected in the differential value of time estimates obtained a t a given time level. The toll charge based value of time estimates do appear
to be s c m e h a t large.
Tne
&el does not; however; perform as well a s the best linear mcdel of 3.4 as the l a t t e r achieves agreater 1 likelihacd for the same nunber of explanatory variables.
Wdel 4.2 aims to capture
rn
linearities w i t h a u t i l i t y expressim which includes time in l q a r i t h n i c £om. The petrol cost and toll coefficients are significant; and of the correct sign; but they are again sanewhat dissimilar. The implied values of time; based m petrol cost and toll charges are 6.00 and 15.33 pence per minute a t 60 minutes ranging to 1.80 and 4.60 a t 200 minutes. Tnis d e l i haever; provides a less satisfactory explanation of behaviourthan
the previous one.Wdel4.3 introduces the r e c i p r d of time; inclcded alorq with petrol cost and t o l l charges. The inclusion of the t o l l d q variable did not allow the iterative maximun likelihood
~~~~~e
to converge. The coefficient associated with the time t e r m i s of the correct order to imply a negative margindl ukility of
time
a s required whilst it i s also significant along w i t h the cost terms.TAB123 4: Nxl Linear Models of Inter4kban
mute
m i c eLOG LXKUJHOOD =
;
1332;
00 RHOlBARSWARED
= 0; 145. . .
LOG LIRXCHOOD = -1413.88 W B A R
SCXTARFD
= 0.115 . . ....
LOG LJXELIHOoD = -1344.42 RIGBAR sCXT?iREB = 0.136 . . .
...
NDTES: Kbtation as for W l e 3 except additionally: TIMiSQ = Time .%pared; IlMTIME = Log of Time; -IME = Reciprocal of Time.
'Ihe implied values of time in bnns of ~ e t r o l costs and toll charge vary £ran 18.14 and 15.83 pence per minute a t 60 minutes travel time to 1.63 and 1.42 pence p r minute at 200 minutes. This formulation does; hDwever; give a rather pmr explanatbn of choice in relation to other a e l s alst the value of time estimates s e a sanewhat implausible.
If it is considered that; for a non linear value of time with respect to
time;
the marginal value oftime
increases a s travel time increases; tjnich i s consistent w i t h concept of diminishirag marginal u t i l i t y ; models 4.2 and 4.3 wuld not be satisfactory. Given a p s i t i v e coefficent asswiated with thetime
squared term; d e l 4.1 would also be msatisfactory on these gromds. 'Ihe stated wefirence analysis of North Kent ccnmuters (Value of Time S t d y 1983) suggested that the value of time was an increasing function of travel time.Model 4.4 represents the final version of a series of non linear calibrations. The time variable is sane constant ('IT) minus the travel time of the relevant opticn. Disutility increases more rapidly i n the neighbourkd of the threshold lT: the u t i l i t y function being asymptotic a s travel t h e approaches 'IT. Avalue of TJ! must be selected before estimation can be dertaken; &re
TP
must exceed the maximun traveltime
present i n the choice set.As TP tends to infinity; the mdel returns to a linear form.
The selected values of 1T for which estimatim m s urdertaken ccnnnenced a t 210 minutes and was increased in intervals of 30 minutes up to the 360 minutes of the final estimated mcdel which
is r e p r t e d here. As the value of TP was successively increased; the lcg likelihood achieved
also
increased although the r a t e of increase diminished. Tne coefficients also became rmre significant as TP increased; although in the final calibration the toll d m i s not c p i t e significant. 'Ihe coefficient associated w i t h the t h e term is of the correct sign to imply a negative marginal u t i l i t y of time as required.This fonnulatim also allows the value of time to increase as travel time increases. T h e values of time; i n terms of petrol costs aml t o l l charges; range
fmn
4.62 and 5.52 pence per minute a t 60 minutes to 8.67 and 10.35 pence p r minute a t 200 minutes. With a 1cg likelihood of -1344.42; the final version of t h i sformulation did rot pmclwe an e v a l e n t pr£ormance; given the degrees of freedan; to that acheived by the quadratic mcdel or the better linear mdels.
It appears; therefore; t h a t a non linear u t i l i t y function may not be the best means of representing route choice. The dcnmry variable models 3.4 and 3.5 hinted a t a MtI linear value of time but no clear trend merges; m y due to the limited rider of valw of time estimates that are obtained *an these mdels.
Yjhilst it can be reasonably hypathesised that individual's values
6. -mgeS
As non linear u t i l i t y expressions do not pavide the best explanations of route c h o i e ; and £or ease of interpreting the results and a n w i n g them with results derived elsevhere; linear u t i l i t y functians were used in the analysis of route choice according to various incane groups. The N o r t h Kent results (Ebwkes 1984: Value of Time Study 1983; 1984~) conflicted i n t h a t the values of time derived £ran the stated preference analysis were not related to inccme vihilst those obtained hran the revealed preference analysis s h o d a strong positive relationship between i n a n e and the value of m a i n in vehicle
time. Table 5 swmarises the results derived ~Ycm segmentation according to incaw.
Tim model formulations were used: a straightforward linear expression including only total cost and travel time a s explanatory variables; and the best simple linear model; based an 2.5 abcnre; which includes travel
time;
p e w costs; t o l l charges and a toll dumry variable as explanatory variables.The values of time; i n terms of total cost; tend to increase a s incane increases. A s s m h g that the margindl u t i l i t y of incane f a l l s a s incane increases given the large incane difference between groups; and t h a t the marginal u t i l i t y of time i s
approximately constant across group; the findirgs conform to vhat might be hypothesised to occur. The averall v a l e of 5.99
peme per minute i s heavily influenced by the large values of time associated with the
tsm
highest incane groups considered. The results derived fran this segmentation; using a straightfarward linear model; are rather encouraging a l t b u g h the results based on model 2.5 are m r e Eanbigmus.
Model 2.5 was the best f i t t i n g of the linear malels used where an invariant value of time is implied. Exever; there appears to be no clear relationship between either the petrol cost
or
toll charge based value of time estimates and the level of incane. The petrol cost coefficient becanes insignificant upcn consideration of incane groups i n excess of 11; 000; This suggeststhat petrol costs are r e l a t i v d y unimportant for higher incane ,
motorists and &ice appears to be based ~ i m a r i l y upon toll c!haxge and travel time considerations. The discrepancy between the u t i l i t y effects attributable to p t r o l
cost
and toll charge variations; evident £or the respondents as a whole; i s also maintained across the various incane groups.TABU3 5: Value of Time a d
metme
Interqrbar~ mute mice. . .
...
: INCCME : N : U3 : W(E) : RHGBAR : ~wP(PC) : W ( T ) : F@D-BAR : : . . . GROUP
i
. . .:
. . .i - . . ! f ! . . . i . S - . i . . . ! t ? . . . :
. . . ( t ) : SQUARE? :...
: 5000 : 11 : 2 3165 : 0.107 : 2.32 : 8.69 : 0.138 :
:CRIESS . . . : : (6.94) : : (10.43) : (5.22) :
...
: 5001- : 13 : 143 : 4.03 : 0.132 : 2.94 : 6.86 : oil50 :
: . . . 7000 : (9.88) : : (7.25) : (5.47) :
...
: 7001- : 1 0 : 1 1 : 5.91- : 0 . 1 8 2 : 4.23 : 8.09 : 0.200 :
: . . . 9000 : (10.68) : : (4.21) : (5.41) :
: 9001- : 14 : 1 5 4 : 5.97 : 0.100 : 3.61 : 8.90 : 0.106 :
: . . . 11000 : (8.57) : : (4.57) : (4.40) :
...
: 11001 : 8 : 88 : 5.84 : oil76 :
*
: 6.89 : 0.188 :: . . . 13000 : (8.73) : : (4.12) :
: 13001- : 7 : 77 : 10.69 : 0.225 : x : 11.86 : 0.229 :
:I7000 . . . : (6.20) : : (3.46) :
:17001- : 8 : 8 8 : 11.95 : 0i316 :
*
: 1 0 ; 9 5 : 0.324 :: . . . 21000 : (7.87) : : (4.16) :
: W L E : 78 : 858 : 5.99 : 0.136 : 4.12 : 8.16 : 0.143 : : . . . SAMPLE : (23.48) : : (9.72) :(12.09) :
...
NOTES TO TABIE 5:
N = ~ u n h s r of Individmls; U3 = Usable Observations.
7 r e s p n d e n t s d i d not state their incane csr had an incane in
excess of 21;000.
W(E)
;
W(PC);
W(T) represent total ast based; p e t r o l costbased and toll based values of time respectively.
*
-
p e t r o l cost c o e f f i c i e n t m t s i g n i f i c a n t a t 9 5 % .The urban route choice e x p e r k t follows along similar l i n e s to the inter-urban route choice experiment: the c o e f f i c i e n t s are again taken to be generic and a l t e r n a t i v e s p e c i f i c constants are
not specified. RespMents ware r e r e d to rank ten t r a v e l
options in order of preference and a sample of 77 individuals
y i e l d s 693 discrete choice &-ations to be input to the l o g i t model a f t e r
the
full expansion of the o r d e r i q s to rank nine. Ther e s u l t s fran the various c a l i b r a t e d models; of a s t r a i g f r t f o ~ d l i n e a r form; are given i n table 6.
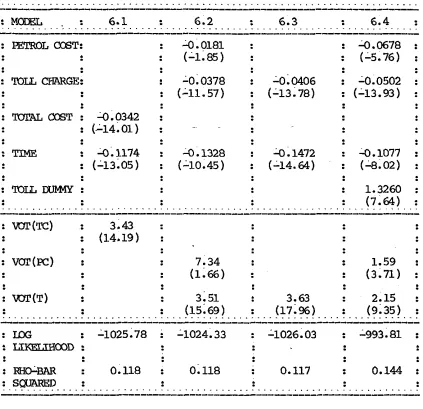
M e 1 6.1 i s the tmst s t r a i g h t f o m d form of u t i l i t y e x ~ e s s i o n .
Each c o e f f i c i e n t i s highly significarrt; and o f the correct sign;
and the resulting value of time estimate; in terms of total cost; of 3.43 pence per minute is quite plausible. The value of time estimate is canparable w i t h that derived in an analysis of North Kent r a i l ard coach m u t e r s by means of both revealed preference (Foudces 1984) and stated &reference (Bates 1984) techniques; although the journey p q s e is here different t o the
Wrth Kent study. The standard error associated with this v a l e
of
time
estimate is also relatively low: a 95% confidence interval having a range of plus or minus apoximately 14% of the actual estimate.Splitting total cost into its caapnent parts; a s is done in 6.2; suggests that motorists react differently to a given toll or petrol cost variation. 'Ihe petrol cost e f f i c i e n t is marginally insignificant whilst the value of t h e defined in tenns of p t r o l costs is al-so insignificant. The toll based
value of time a p p a r s quite reasonable ard is highly siginificant. This model does not; however; constitute an hprovenent aver 6.1 given a calculated chi-squared of 2.9 and a tabulated value of 3.84 for one degree of freedan reduction.
H e 1 6.3 assess whether choice i s simply a function of travel
time
and toll m e s ; given that the petrol cost coefficient in 6.2 i s insignificant. Both coefficients i n 6.3 are significant; as is to be expcted frcm the result of &el 6.2. Kmever; as mcdels 6.1 and 6.3 include the saw nmber of explanatory variables; it can be seen that 6.1 provides a marginally better explanation of route choice a l t b u g h the results are in any event cunprable.W e 1 6.4 s p l i t s total cost into its constituent parts d l s t a toll durnry variable is also included in an attempt to discern the toll effect which is invariant w i t h respect to the actual t o l l charge. 'Ihe results are; knever; scmeuhat confusing. Whilst the effect of a toll charge f a l l s in relation to that of petrol cost; i n canprison with 6.2;
the
toll dumy variable is of the wrong sign despite being significant. The £ormer result is to be expcted but the introduction of a toll h u l d not; i n i t s e l f , increase u t i l i t y . Emever; only t of the ten options are mtolled. This result contrasts with Wse derived i n the inter- urban context where the toll dimny variable successfully.
discerned the hypthesised ef£ect of the introduction of a tolllPIBIE 6: Linear bbdels of
lMMn
mute
(hoke: PETROL COST: : 4.0181 : : 4.0678 :
: : (-1.85) : : (-5.76) :
: TOLL CHARGE: : -0.0378 : -0.0406 : -0.0502 :
: (-11.57) : (-13.78) : (-13.93) :
: KEALCCST: '0.0342 :
: (-14.01) :
T I M E : 4.1174 : -0.1328 : 4.1472 : 4.1077 :
: (-13.05) : (110.45) : (-14.64) : (18.02) :
:
: T O L t i m M Y : : 1.3260 :
: (7.64) :
[image:30.602.83.506.109.518.2]. . .
...
:var(Tc)
: 3.43: (14.19) :
: VOT(FC) : 7.34 1.59 :
: (1.66) : : (3.71) :
: : : : :
: LOG : -1025.78 : -1024.33 : -1026.03 : -993.81 :
: UK!UmCOD :
:
: R H 6 B A R : 0.118 : 0.118 0.117 : 0.144 :
: . S F ?
. . . .i
. . . . . .:
. . .:
. . ....
Notes to Table 6: Notation a s fcor Table 2 W e .
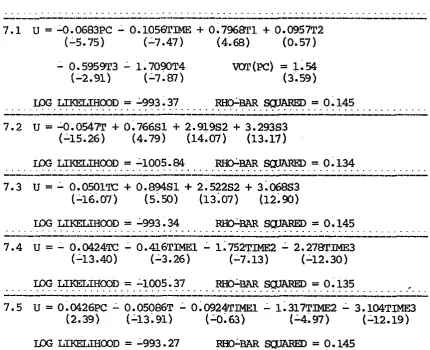
Table 7 lists the r e s u l t s obtained by using d m variable
specifications to discern various e f f e c t s ; as was done in the
-
inter-wban route choice expriment. kdel 7.1 uses dumty
variables to e s t a b l i s h the e f f e c t o f d i f f e r e n t toll charges u p c ~ l
u t i l i t y . It appears that this model has not been successful; in discerning the e f f e c t s we might hypothesise to e x i s t ; especially
in r e l a t i o n to the same analysis mdertaken in the inter-urban
context. The variables T1; T2; T3 and T4 represent i%e toll
charges of 10; 25; 40 and 60 pence respectively. Rs the base toll
lwei f m n which the u t i l i t y effects are measured i s zero; the
c o e f f i c i e n t s associated w i t h these variables should have a
negative sign.
The variables T1 and T2 both pssess coefficients of the wrong
sign; although t h a t associated w i t h T2 is insignificant. The
intrcduction of the 10p and
.-.
25p toll charges may be asscciatedw i t h options &chi otherwise imgrove u t i l i t y and hence such spurious relationships are implied. The results are canparable to that of 6.4 where the toll dunny variable also pssessed a
coefficent of the wrong sign.
k d e l s 7.2 and 7.3 consider mtorists' gueferences h r driving a t certain speeds where the dmmy variables 51; S2 ard 53 represent speeds of 20; 30 and 40 m& respectively. It can be seen t h a t the variables have the appropriate sign attached to t h e i r coefficients; given a base speed of 15 and that faster speeds are preferred, and are significant. The toll and total cost ccefficents are also significant, of the correct sign; and are
not dissimilar. P e t r o l costs are not inclded in 7.2 a s they are a func'cion of sped.
TABLE 7: Linear Moaels to F X d n e Nanr-ities
in
Choicem s
rn TABLE
7:TI; T2; T3; T4 denote tolls 10; 25; 40 and 60 pence respectively. 51; 52; S3 represent speeds of 20; 30 and 40
m f i
respectively.TIME1; TIME2; TIME3 denote travel times of 24; 27 and a canbind
[image:31.599.79.510.285.635.2]